PowerColor Red Devil RX Vega 64 8GB HBM2 Review: Cooling Vega Right
Why you can trust Tom's Hardware
Temperatures, Clock Rates & Overclocking
Overclocking & Undervolting
Conventional overclocking through a higher power limit and more aggressive clock rate is a dead-end. Brute force just isn't the answer. Because PowerColor had to follow AMD's guidelines, this implementation is already running at its limit. Sure, you could dial in higher fan speeds to cool things down, creating more noise in the process, but who really wants that? As we explained in AMD RX Vega 64: The Tom's Hardware Liquid Cooled Edition, even with higher frequencies and brutal power adjustments, it is almost impossible to get Radeon RX Vega running much faster. Instead, undervolting can achieve far better results.
First and foremost, the use of a suitable utility like OverdriveNTool works wonders. As always, though, your results will also depend on the quality of your GPU. We can't generalize; you'll have to compare your improvements to ours.
Temperatures & Frequencies
We’re using the GPU temperature value exclusively because that's what our test sample’s telemetry reports. Of course, the hot-spot temperature is a lot higher. Why? You can read all about in Does Undervolting Improve Radeon RX Vega 64's Efficiency? On PowerColor's Red Devil RX Vega 64, those readings are up to 14°C higher.
The following table shows a comparison of start and end values for temperatures and GPU (boost) frequencies. Just keep in mind that these clock rates can be considerably higher in games with significantly lower loads. For example, Wolfenstein 2's indoor environments might push the card to 1.63 GHz, only to knock it way down once you step outside.
| Header Cell - Column 0 | Initial Value | Final Value |
|---|---|---|
| Open Test Bench | ||
| GPU Temperature | 32°C | 65°C |
| GPU Clock Rate | 1523 MHz | 1381 MHz |
| Ambient Temperature | 22°C | 22°C |
| Closed Case | ||
| GPU Temperature | 34°C | 64°C |
| GPU Clock Rate | 1523 MHz | 1375 MHz |
| Air Temperature in Case | 24°C | 47°C |
Temperature vs. Frequency
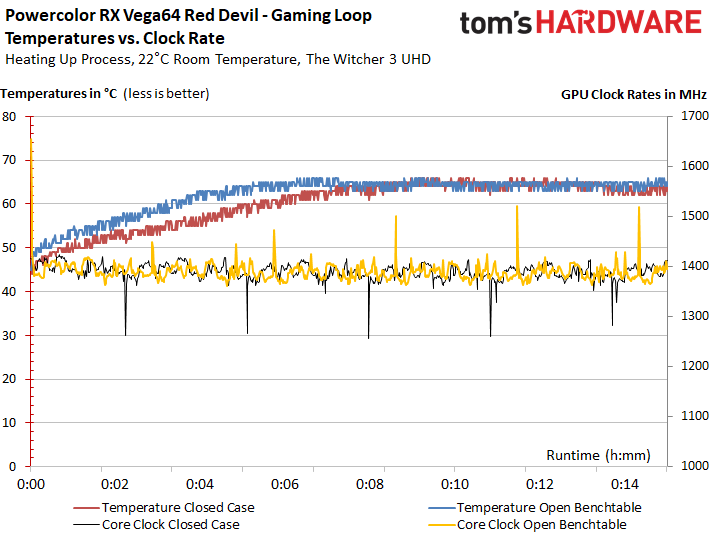
To better illustrate our findings, we plotted temperatures and frequencies during our sample's 15-minute warm-up phase. It's particularly interesting that there's such a small thermal difference between open and closed cases.
Frequencies in the gaming loop are about 100 MHz higher than what we measured from AMD's reference card. This average increase of 11% only improves gaming performance by 6-8%, which isn't particularly impressive.
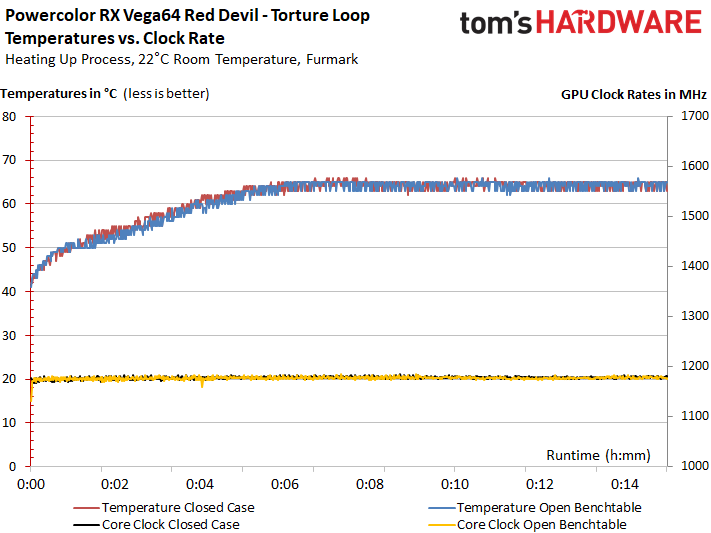
The results of our stress test look similar:
Get Tom's Hardware's best news and in-depth reviews, straight to your inbox.
IR Image Analysis Of The Board's Back
To round out this section, we take a look at board temperatures across several different load levels. To keep the test setup as practical as possible, we removed the backplate for IR measurements (since it doesn't help with cooling anyway). Comparative before/after tests show no difference in temperature or cooling performance.
Gaming
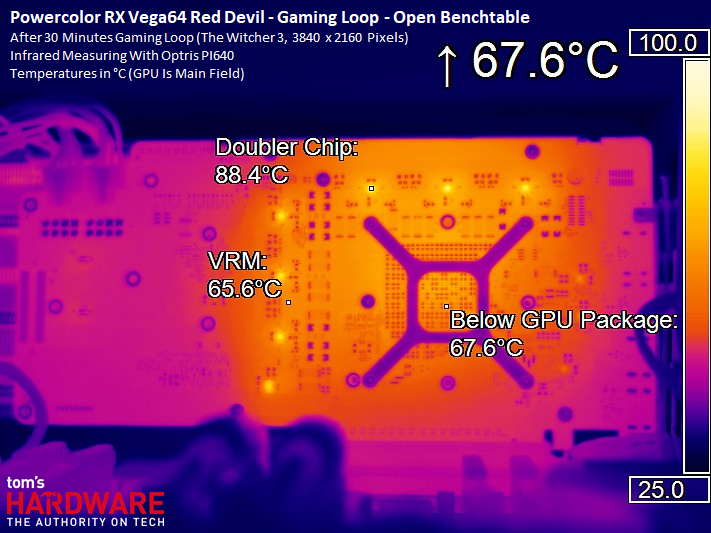
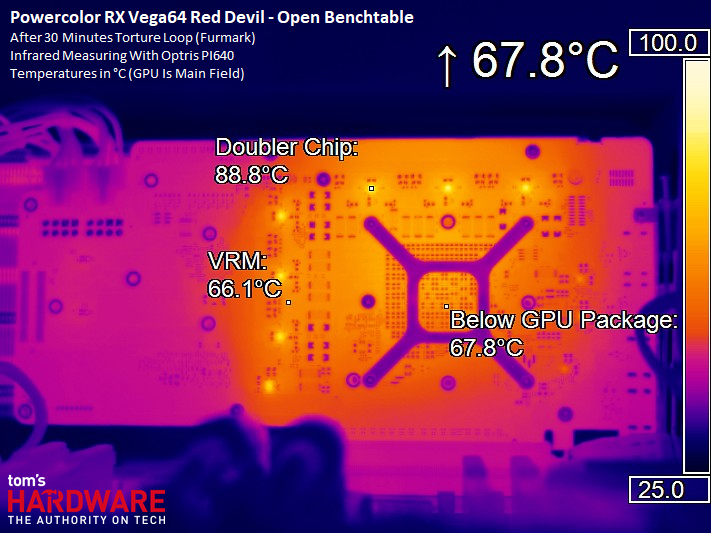
This card has no problem in our Witcher 3 gaming loop. Measurements of 68°C behind the GPU package and 66°C at the voltage converters are actually cool compared to some of the Radeon RX Vega cards we've tested. Does the situation change at all in a closed case?
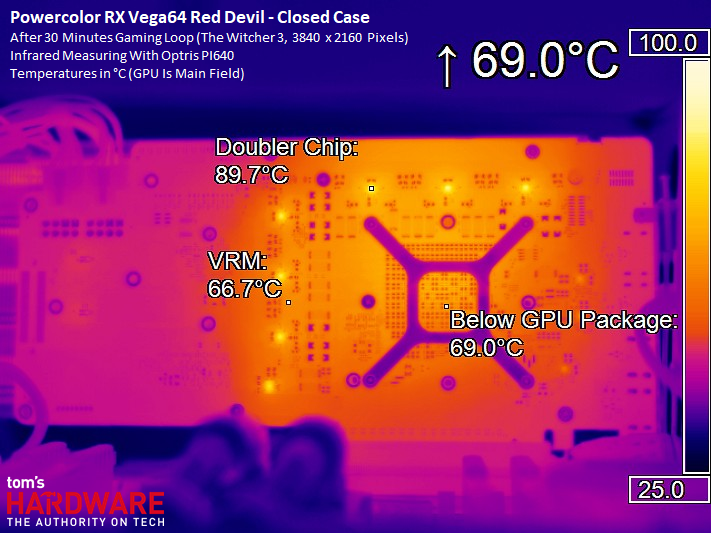
Not really, no. In a closed case, we measure one degree higher at the voltage converters, while the area behind AMD's GPU rises two degrees. This is enabled by faster-spinning fans, since PowerColor sets a fairly aggressive temperature target. We'll be paying close attention to what that does to noise output.
Stress Test
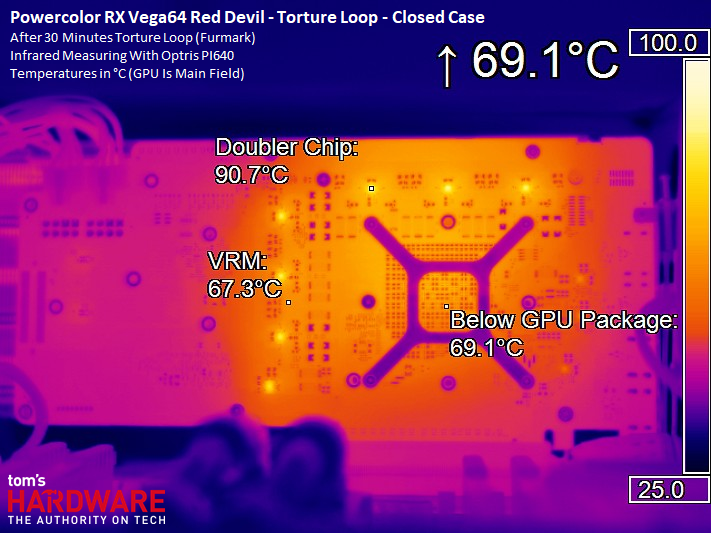
The stress test reflects slightly lower power consumption than our gaming benchmark. However, certain components (like the voltage converters) still get a little warmer. This is ultimately the result of a more constant load, which can be difficult to keep up with.
Again, the temperatures only rise one to two degrees moving from an open bench table to a closed case. Of course, the fan speeds needed to make this possible increase as well.
In the end, PowerColor's cooler proves itself to be incredibly effective. All of our thermal readings land within a very comfortable range.
Heating Up & Cooling Down
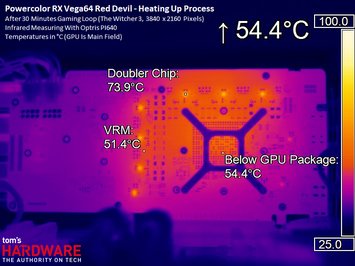
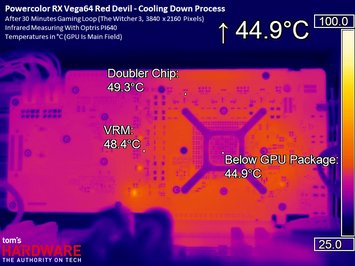
The last two pictures show where the heating starts and where the circuit board is cooled most effectively.
MORE: Best Graphics Cards
MORE: Desktop GPU Performance Hierarchy Table
MORE: All Graphics Content
Current page: Temperatures, Clock Rates & Overclocking
Prev Page Power Consumption Next Page Cooling & Noise
Igor Wallossek wrote a wide variety of hardware articles for Tom's Hardware, with a strong focus on technical analysis and in-depth reviews. His contributions have spanned a broad spectrum of PC components, including GPUs, CPUs, workstations, and PC builds. His insightful articles provide readers with detailed knowledge to make informed decisions in the ever-evolving tech landscape
-
Gillerer I wouldn't trust PowerColor's quality control.Reply
My old HD 5850 came with an "Engineering Sample" BIOS with no officially supported way of updating it. -
10tacle Nice to still see some AMD high end GPU reviews on Tom's. Well done. Unfortunately, this review continues to prove that AMD is well behind Nvidia in the upper tier GPU segment when it comes to gaming bang for the buck. AMD just doesn't have the R&D pockets that Nvidia does because they have shifted focus to CPU/APU production. I would love to see an AMD competitor to Nvidia's GTX x80 Ti high end GPU. Their last stab at it was with the Fury X against the 980 Ti which fell as flat as Bulldozer.Reply -
davidgirgis "We have a hard time recommending..." -Igor WallossekReply
However...
"9/10" and "Editor's Choice"
"Been dazed and confused for so long it's not true" -Robert Plant -
redgarl Reply21026800 said:Nice to still see some AMD high end GPU reviews on Tom's. Well done. Unfortunately, this review continues to prove that AMD is well behind Nvidia in the upper tier GPU segment when it comes to gaming bang for the buck. AMD just doesn't have the R&D pockets that Nvidia does because they have shifted focus to CPU/APU production. I would love to see an AMD competitor to Nvidia's GTX x80 Ti high end GPU. Their last stab at it was with the Fury X against the 980 Ti which fell as flat as Bulldozer.
It is the use of HBM 2 and the shortage that skyrocket the price of this card. The Vega 64, unfortunately, is a mining card. With proper undervolting and tweaks, it performs really well, unfortunately, for gaming at this price you better getting a TI. Still, if the price was about the same as a 1080, I would grab a Vega instead. -
eric.m.hudson1 "I wouldn't trust PowerColor's quality control.Reply
My old HD 5850 came with an "Engineering Sample" BIOS with no officially supported way of updating it."
That's a long time to hold a grudge. I've had 2 PowerColor 290x's and Red Devil RX 480 and 580 cards. All of them were great performers and had better cooling than the majority of the competition. Also, they were all unlocked/dual bios cards. I like what PowerColor does with AMD cards. -
Rogue Leader Card sounds great, looks awesome, but the price is double what its worth (and I say that as someone who owns a Liquid cooled Vega 64).Reply -
Rogue Leader Reply21027991 said:https://i.imgur.com/BfZBaTL.jpg
Was $1100 US this morning, now a more reasonable $719. Still here in the US a GTX 1080 can be had for $120 cheaper minimum and performs basically the same. However at the price where you are its totally reasonable. -
TJ Hooker Reply
You should really include the context for that first quote:21026820 said:"We have a hard time recommending..." -Igor Wallossek
However...
"9/10" and "Editor's Choice"
"But even though it's generally faster than GeForce GTX 1080, Nvidia's closest competitor is currently available at a $200+ savings. We have a hard time recommending any Radeon RX Vega 64 with such a chasm between boards best suited to 2560x1440 gaming."
A GTX 1080 and Vega 64 have the same MSRP, but he's saying the fact that the Vega is selling for $200 more makes it hard to recommend. Although in reality the price difference is much lower in many places.
Edit:
The price delta between the cheapest 1080 and Vega 64 on PCpartpicker US is $30 right now ($70 for red devil specifically). On Newegg.com that expands to $50 and $90, but only because that includes a dinky single fan 1080 that's $20 cheaper.21028036 said:Was $1100 US this morning, now a more reasonable $719. Still here in the US a GTX 1080 can be had for $120 cheaper minimum and performs basically the same. However at the price where you are its totally reasonable. -
hurnii Re: "Semi-passive" cooling mode not working:Reply
My Red Devil's BIOS switch has 3 positions:
Max OC (fairly useless)
Middle Position ("Normal ?")
Semi-Passive Mode
When switching BIOS, the Computer needs to be turned off, the switch set to the desired position, then Computer PSU turned back on.
For my card, if I turn the computer Off, set the BIOS switch position to semi-passive, and then turn the computer on, the fan stays off (passive mode) while the OS boots up.
In fact, when I first installed the card, the switch was already in semi-passive mode, so when the computer booted up initially, no fans spun. Had to shutdown, flip the switch, and power back up. That time, the fans did spin.
