Gigabyte Xtreme Gaming 1200 W PSU Review
Gigabytes re-enters the high-end PSU market with its Xtreme Gaming 1200 W PSU. Besides high capacity, it also features Platinum-rated efficiency, modular cables, and interesting looks. This unit is built to meet the demands of enthusiasts, to be sure.
Why you can trust Tom's Hardware
Performance, Performance Per Dollar, Noise & Efficiency Ratings
Performance Rating
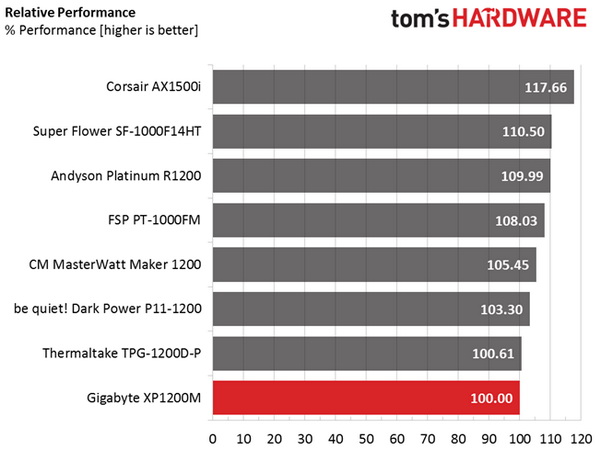
The following graph shows the XP1200M's total performance, comparing it to other units we have reviewed. To be more specific, the tested unit is shown as 100 percent, and every other unit's performance is shown relative to it.
The XP1200M shows poorly overall, mainly because of its not-so-tight load regulation and lousy efficiency levels under light loads. On top of that, most of the competition in this category offers even better ripple suppression. Gigabyte should either use another platform or drop this model's price if it wants to be more competitive.
Performance Per Dollar
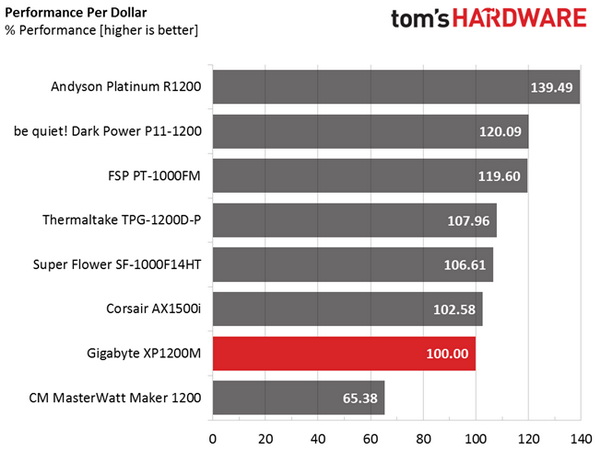
The following chart may be the most interesting to many of you because it depicts the XP1200M's performance-per-dollar score. We looked up the current price of each PSU on popular online shops and used those prices and all relative performance numbers to calculate the index. If the specific unit wasn't available in the United States, we searched for it in popular European Union shops, converting the listed price to USD (without VAT). Note that all of the numbers in the following graph are normalized by the rated power of each PSU.
The performance per dollar score is naturally fairly low since a high price tag puts the XP1200M in a very competitive space, where you'll easily find another PSU with better benchmark results.
Noise Rating
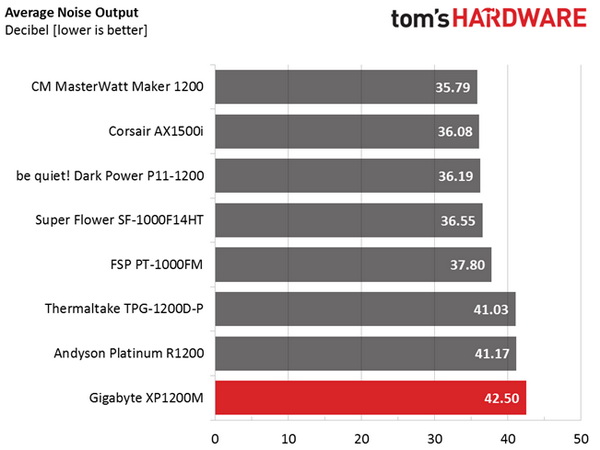
The graph below depicts the cooling fan's average noise over the PSU's operating range, with an ambient temperature between 28 °C and 30 °C (82 °F to 86 °F).
The XP1200M's overall noise output is very high, so steer clear if you're trying to build a quiet PC.
Efficiency Rating
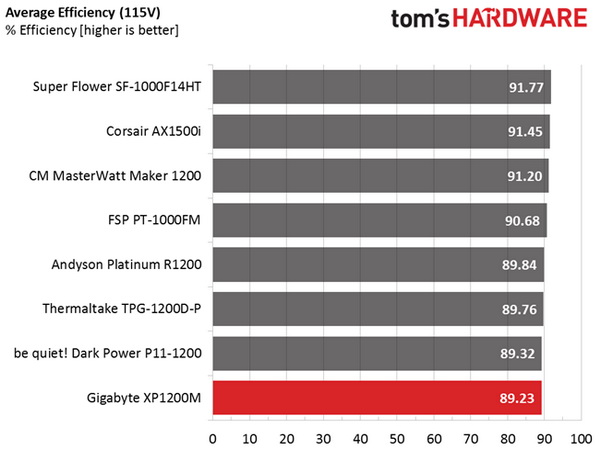
The following graph shows the PSU's average efficiency throughout its operating range, with an ambient temperature between 28 °C and 30 °C.
Get Tom's Hardware's best news and in-depth reviews, straight to your inbox.
In the overall efficiency chart, Gigabyte's XP1200M fails to impress once again. We do have to admit, though, that the difference between Platinum-rated PSUs isn't large at all.
Current page: Performance, Performance Per Dollar, Noise & Efficiency Ratings
Prev Page Ripple Measurements Next Page Pros, Cons And Final Verdict
Aris Mpitziopoulos is a contributing editor at Tom's Hardware, covering PSUs.
-
turkey3_scratch Yawn. It's loud. Might not be too loud in most people's cases where the unit is sucking cool air from underneath the computer, and where they overestimate their power requirements, but it's still way too loud. If they're going to make the fan that aggressive, they should give it a longer warranty. Give it an ol' 11 year warranty to beat the competition at least.Reply
The only way Gigabyte is going to sell this at whatever price is if they do some marketing. "Nvidia Gigabyte GPUs work best with Gigabyte PSU" and people will buy it. -
powernod Enhance continoues its mediocre performance!!Reply
The only series i can remember, in which Enhance showed some very good results were the Thermaltake's GRAND Platinum line.
Besides that,..... just mediocre !! -
Vorador2 When i saw that it used the word "xtreme" (ugh) and "gaming" together in the name of the product i knew it was going to be either overpriced or underperforming. Or both.Reply -
Sam Hain In the 1.2kw range... The EVGA SuperNOVA 1200 P2 is a great buy @$230 (or so), awesome specs and performance across-the-board and some of the highest customer ratings to back it's build quality.Reply


