Broadwell-E: Intel Core i7-6950X, 6900K, 6850K & 6800K Review
Is Broadwell more attractive to enthusiasts without graphics and up to 10 Hyper-Threaded cores? We test against two previous generations, plus Skylake to find out.
Game Results
Ashes of the Singularity
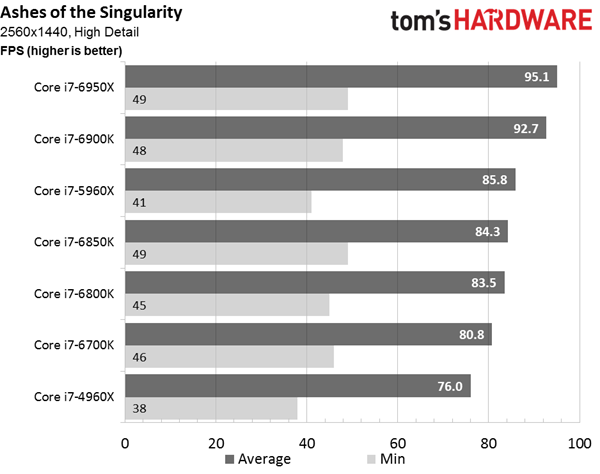
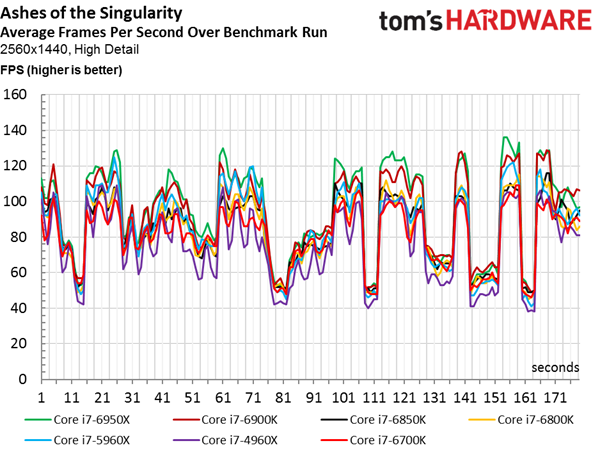
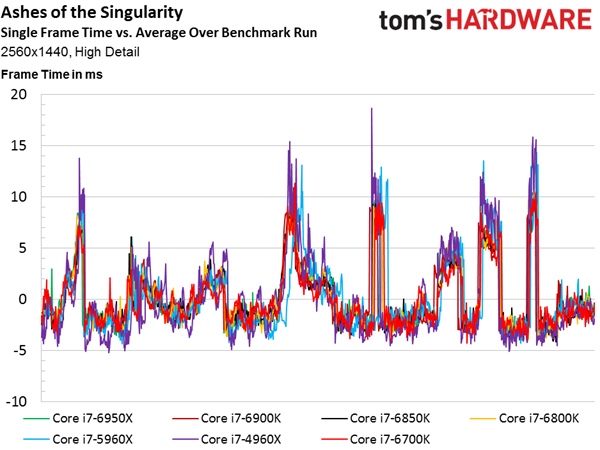
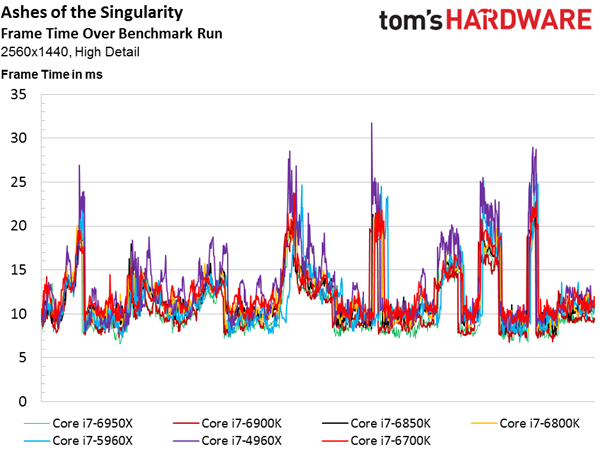
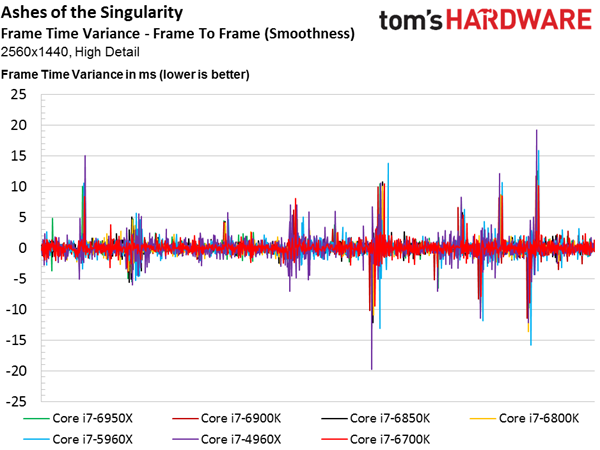
Nvidia’s GeForce GTX 1080 is the fastest graphics card available, so when we ask it to play through the Ashes of the Singularity benchmark at 2560x1440 using DirectX 11 mode, it’s bound by platform performance. We know this because the Ashes results file spits out a frame-by-frame accounting of the run, which includes a flag to indicate whether the CPU was waiting on the GPU or vice versa.
It’s also pretty clear that Ashes is optimized to take advantage of multi-core processors. Our average frame rate chart shows the Core i7-6950X up at the top, followed by both eight-core contenders. Two six-core Broadwell-E CPUs take fourth and fifth place, while Intel’s fast Skylake-based flagship snags sixth. Although Core i7-4960X features six cores, its lower clock rate and older Ivy Bridge-E architecture land in last.
The lower average manifests as outlying spikes in the frame time chart, though this only has a slight effect on our smoothness indicator.
Bioshock Infinite
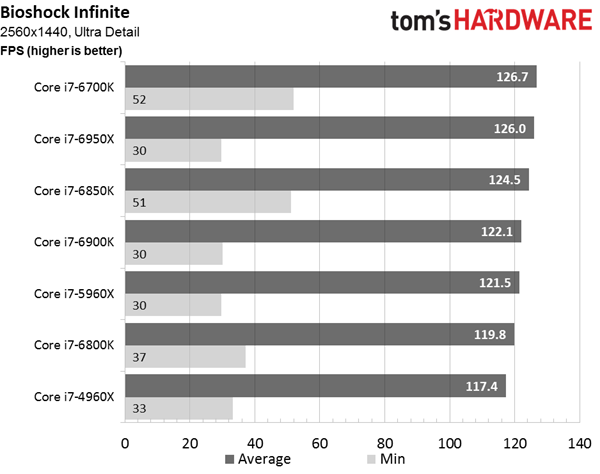
When you slide back to an older game like Bioshock Infinite, however, you’re a lot less likely to find optimizations for threading. As a result, architectural details determine the finishing order, all other components being equal.
Our average FPS chart shows the Skylake–based Core i7-6700K on top, bolstered by its 4GHz base frequency and 4.2GHz peak Turbo Boost clock rate. Three Broadwell-E-based CPUs follow, though we might have expected the -6850K to lead the -6950X—perhaps the extra 10MB of LLC improved the flagship’s average frame rate.
As we might have expected, the eight-core -5960X is just about as fast as its successor, the -6900K. Meanwhile, Ivy Bridge-E lags behind, even though it can hit 4GHz in lightly-threaded workloads.
F1 2015
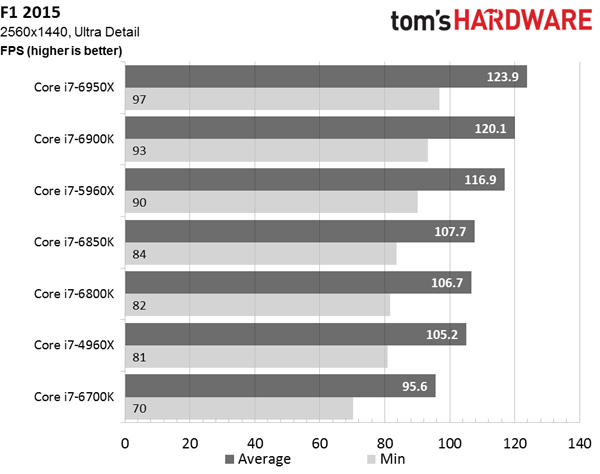
Results favoring high core counts suggest that F1 2015 readily utilizes whatever host processing resources are available—a supposition we confirmed by collecting data from Windows’ Resource Monitor after a pass through the game. Ten-, eight-, six- and four-core contenders finish our benchmark in that finishing order.
Get Tom's Hardware's best news and in-depth reviews, straight to your inbox.
F1 2015 and the two games above it just so happen to be the first real-world tests from our upcoming automated suite that are ready. The final list should include titles that tax graphics processing much more that host CPUs. And indeed, we know that many games simply cannot utilize as many cores as Ashes and F1. Still, it’s nice (if not surprising) to see both games giving enthusiasts a reason to look beyond the latest quad-core models.
3DMark
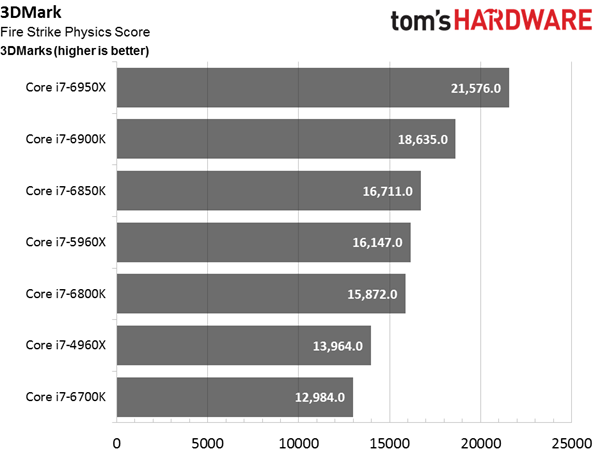
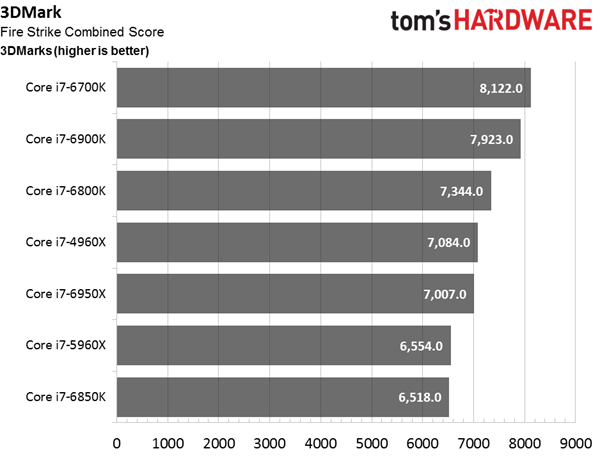
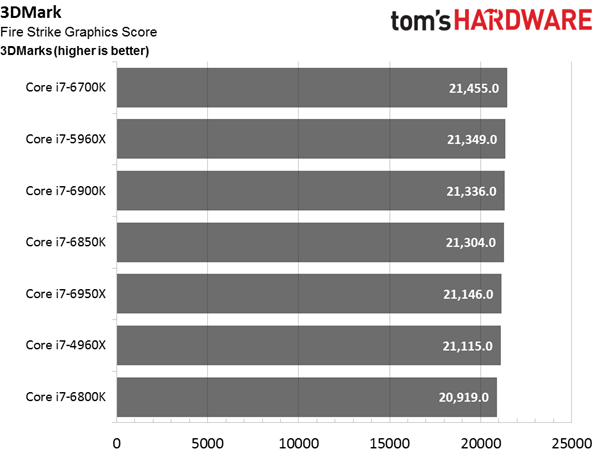
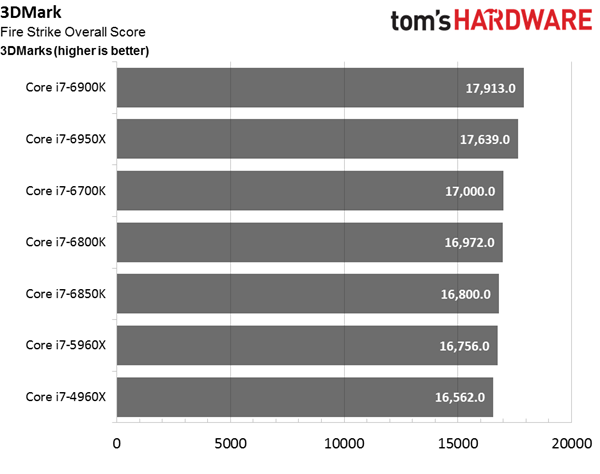
The 3DMark tests break gaming performance down into components that we should be able to analyze independently.
Graphics test 1 emphasizes geometry and lighting, while graphics test 2 focuses on particles and GPU simulations. Predictably, all of the CPUs we use as variables land very close to each other in a metric designed to isolate our GPU, which remains a constant.
The physics test measures the platform’s ability to run gameplay physics simulations on the CPU, minimizing GPU load in the process. It uses one thread per available core, and updates soft body vertex data to the GPU for each frame. The score comes from multiplying the test’s frame rate by 315 (Futuremark’s scaling constant). Clearly, the two Broadwell-E models with the most cores enjoy the biggest advantage. Intel’s Core i7-5960X, which we might have expect to place third, instead lands behind the -6850K. Meanwhile, Skylake’s four cores are a liability in any pure measure of threaded performance like this; the -6700K lands in last place.
The combined test hits the CPU and GPU simultaneously with elements from graphics test 1 and 2, plus 32 simulation worlds running in separate threads, each containing one statue breaking into 113 parts. The combined test employs a scaling constant as well, which is multiplied against the test’s average FPS. In this case, higher clock rates seem to be favored over lots of parallelization, counter to what the pure graphics or pure physics tests suggested. Unfortunately, there’s really nothing in Futuremark’s technical guide to help us explain why.
Finally, the overall result uses a weighted harmonic mean that encourages you to boost any score that doesn’t register as balanced. In other words, 3DMark rewards you for running without obvious bottlenecks. To that end, there aren’t huge gaps between the platforms we tested. Broadwell-E does occupy most of the top spots. However, 3DMark seems to recognize that a fast quad-core Skylake-based processor is also appropriately paired to the GeForce GTX 1080.
MORE: Best CPUs
MORE: All CPU Content
MORE: Intel & AMD Processor Hierarchy
Current page: Game Results
Prev Page Test Setup & Overclocking Next Page Desktop Productivity Results-
jt AJ was expecting a bit more info and review usage of turbo 3.0. also looks like most of broadwell E chip is junk.. except that one 6850k chip you received probably lucky 1.25v for 4.4v would be good thats only because its broadwell. got one here for 4.8ghz at just 1.22v.Reply -
Nuckles_56 Chris, how likely is it that a noctua NH-D15 would be able to cool these heat producing monsters if your h100i struggled and failed with the i7-6800k @4.4GHz.Reply
But a truly excellent review, even if it does show that there is little reason to go to broadwell-E over Haswell-E -
elho_cid I'd love to step up to the realm of higher core count, but given the results of Adobe SW when scaling to many threads, meas it is not really useful right now. :/Reply
That's a pity, because the most time I spend staring at a progress bar is when I'm using Adobe products. I don't really need more power to "background tasks" like zipping or lame encoding.
-
AdmiralDonut Standard SLI is not limited on the new NVIDIA cards. The only thing that's limited is the new High Bandwidth SLI. Normal 3 and 4-way SLI can be enabled easily by simply asking NVIDIA for an unlock code, something any half way serious enthusiast will most certainly do. Here's some more info on this matter:Reply
https://www.youtube.com/watch?v=2wBDt9tN5-c -
bit_user I don't really see the point of having a $1700 non-Xeon SKU. Of the few people who can afford it, even less would bother/dare to overclock it.Reply
I'm still wishing for the rumored 5 GHz SKU to surface. I've rarely needed more than 4 cores, but a couple extra GHz always comes in handy. Even so, I'll not be upgrading until at least Skylake-E or perhaps Kaby-E.
-
Cerunnir ReplyChris, how likely is it that a noctua NH-D15 would be able to cool these heat producing monsters if your h100i struggled and failed with the i7-6800k @4.4GHz.
But a truly excellent review, even if it does show that there is little reason to go to broadwell-E over Haswell-E
NH-D15 is arguably better or atleast equal to the H100i when it comes to cooling, and its noise levels is definatly lower both in load and while idle.
http://www.relaxedtech.com/reviews/noctua/nh-d15-versus-closed-loop-liquid-coolers/2 -
bit_user Reply
No. Buy a Xeon version, for that. It's practically the only difference. It's artificial product differentiation, known as "market segmentation".18045773 said:Does it have support for ECC ram?
Here, you can find links to the specs of the CPUs mentioned in this article: http://ark.intel.com/products/family/79318/Intel-High-End-Desktop-Processors#@Desktop If you view their individual specs, you can see that none support ECC.
Intel hasn't yet announced the E5-16xx v4 series CPUs, but you can turn up leaked specs with a bit of searching.
And you'll need motherboard support, too.
-
cats_Paw Good review (excellent if its only the heads up for a more in-depth one).Reply
I have to say that I would love to have a 6 or even 8 core CPU but these prices and performances dont add up.
In my country a 6700K and a 5820K are priced almost the same, but its still a hard choice (Do i want a "maybe" future proof 6 core that can be good for some work or a 4 core that is flat out faster and cheaper to build around for gaming?). -
pyoverdin Am I correct in saying I could build a PC that's 5 FPS off the 6950X for it's price?Reply
