Workstation Graphics: 19 Cards Tested In SPECviewperf 12
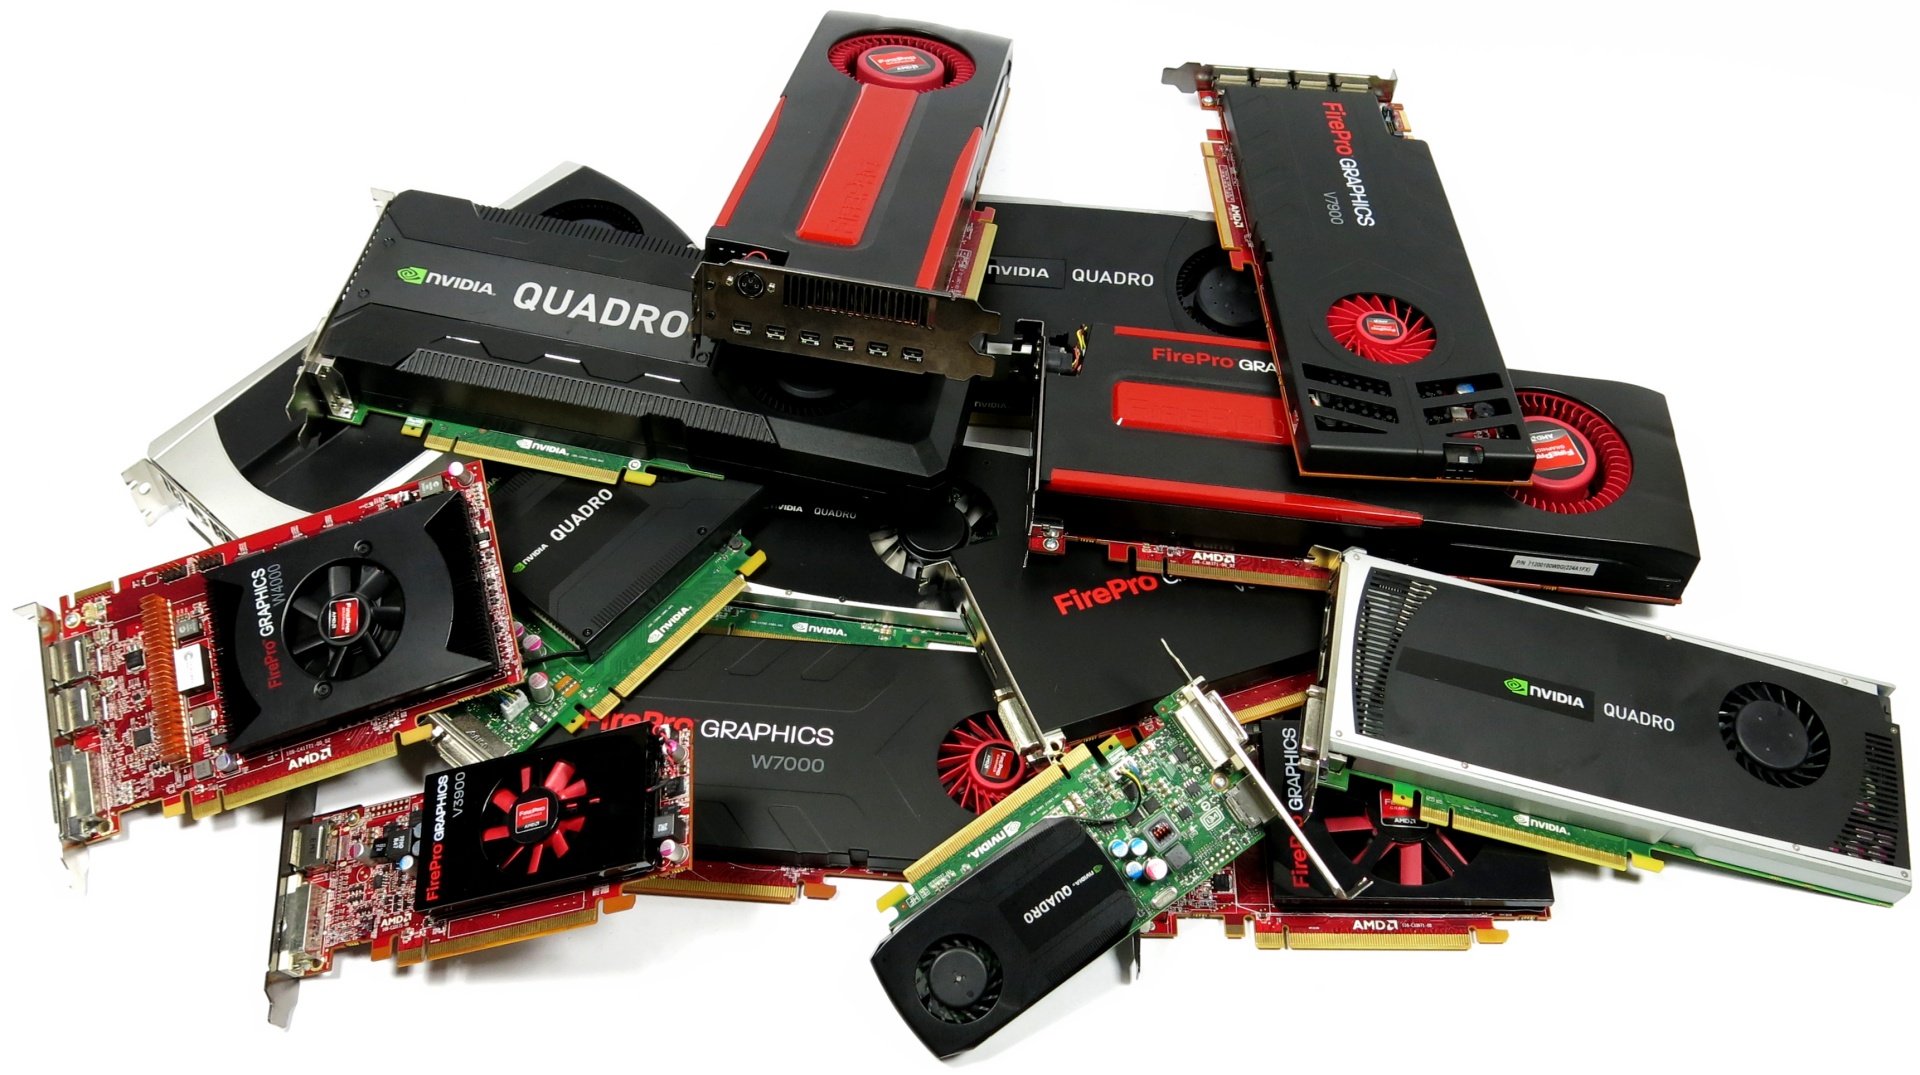
SPECviewperf 12 sets out to be the standard for evaluating workstation graphics cards by including the latest professional applications, more complex models, and synthetic workloads pulled from important market segments. We test 19 cards in the new suite.
Get Tom's Hardware's best news and in-depth reviews, straight to your inbox.
You are now subscribed
Your newsletter sign-up was successful
Introducing Our Benchmark System
SPECviewperf 11, introduced back in 2010, has been showing its age for a while. It wasn't really giving us a realistic-looking picture of modern workstation graphics hardware and driver performance anymore. The applications composing it were just too old. Moreover, AMD and Nvidia were thoroughly optimizing for the specific workloads, throwing off the suite's value.
So, the Standard Performance Evaluation Corporation (SPEC) chose to step up its game with a much-needed update. After all, SPEC’s mission is to create relevant benchmarks that closely adhere to current industry standards.
AMD and Nvidia are both members of SPEC, allowing them to exert some influence over the new collection of tests. The idea is that no company gets an unfair advantage. We'll see how that works out in practice, though.
Update: 3/17/2014
We added benchmark results for the Quadro K6000, which naturally excels in many of this suite's sub-tests. Bear in mind that Nvidia's flagship is a purpose-built board, though, selling for $5000 on Newegg. Unfortunately, SPECviewperf doesn't include any general-purpose compute workloads, which is where the Quadro K6000 would undoubtedly excel most.
We wanted to run tests using SPECviewperf 12 as quickly as possible in order to provide a baseline look at workstation-class graphics performance, before drivers start getting optimized specifically for the test's various workloads (similar to what happened with SPECviewperf 11). To that end, it's also important for us to gauge how relevant the performance of SPECviewperf 12 is compared to the software it claims to represent.
Important Preamble: SPECviewperf 12 is a demanding benchmark, targeting upper-middle and high-end workstation-class graphics cards. In tests that employ extremely complex models or workloads with immense memory requirements, the lower-end boards are at a disadvantage. Consequently, the results for those entry-level products need to be considered in relative terms; they're simply not meant to handle tasks like this.
Benchmark System
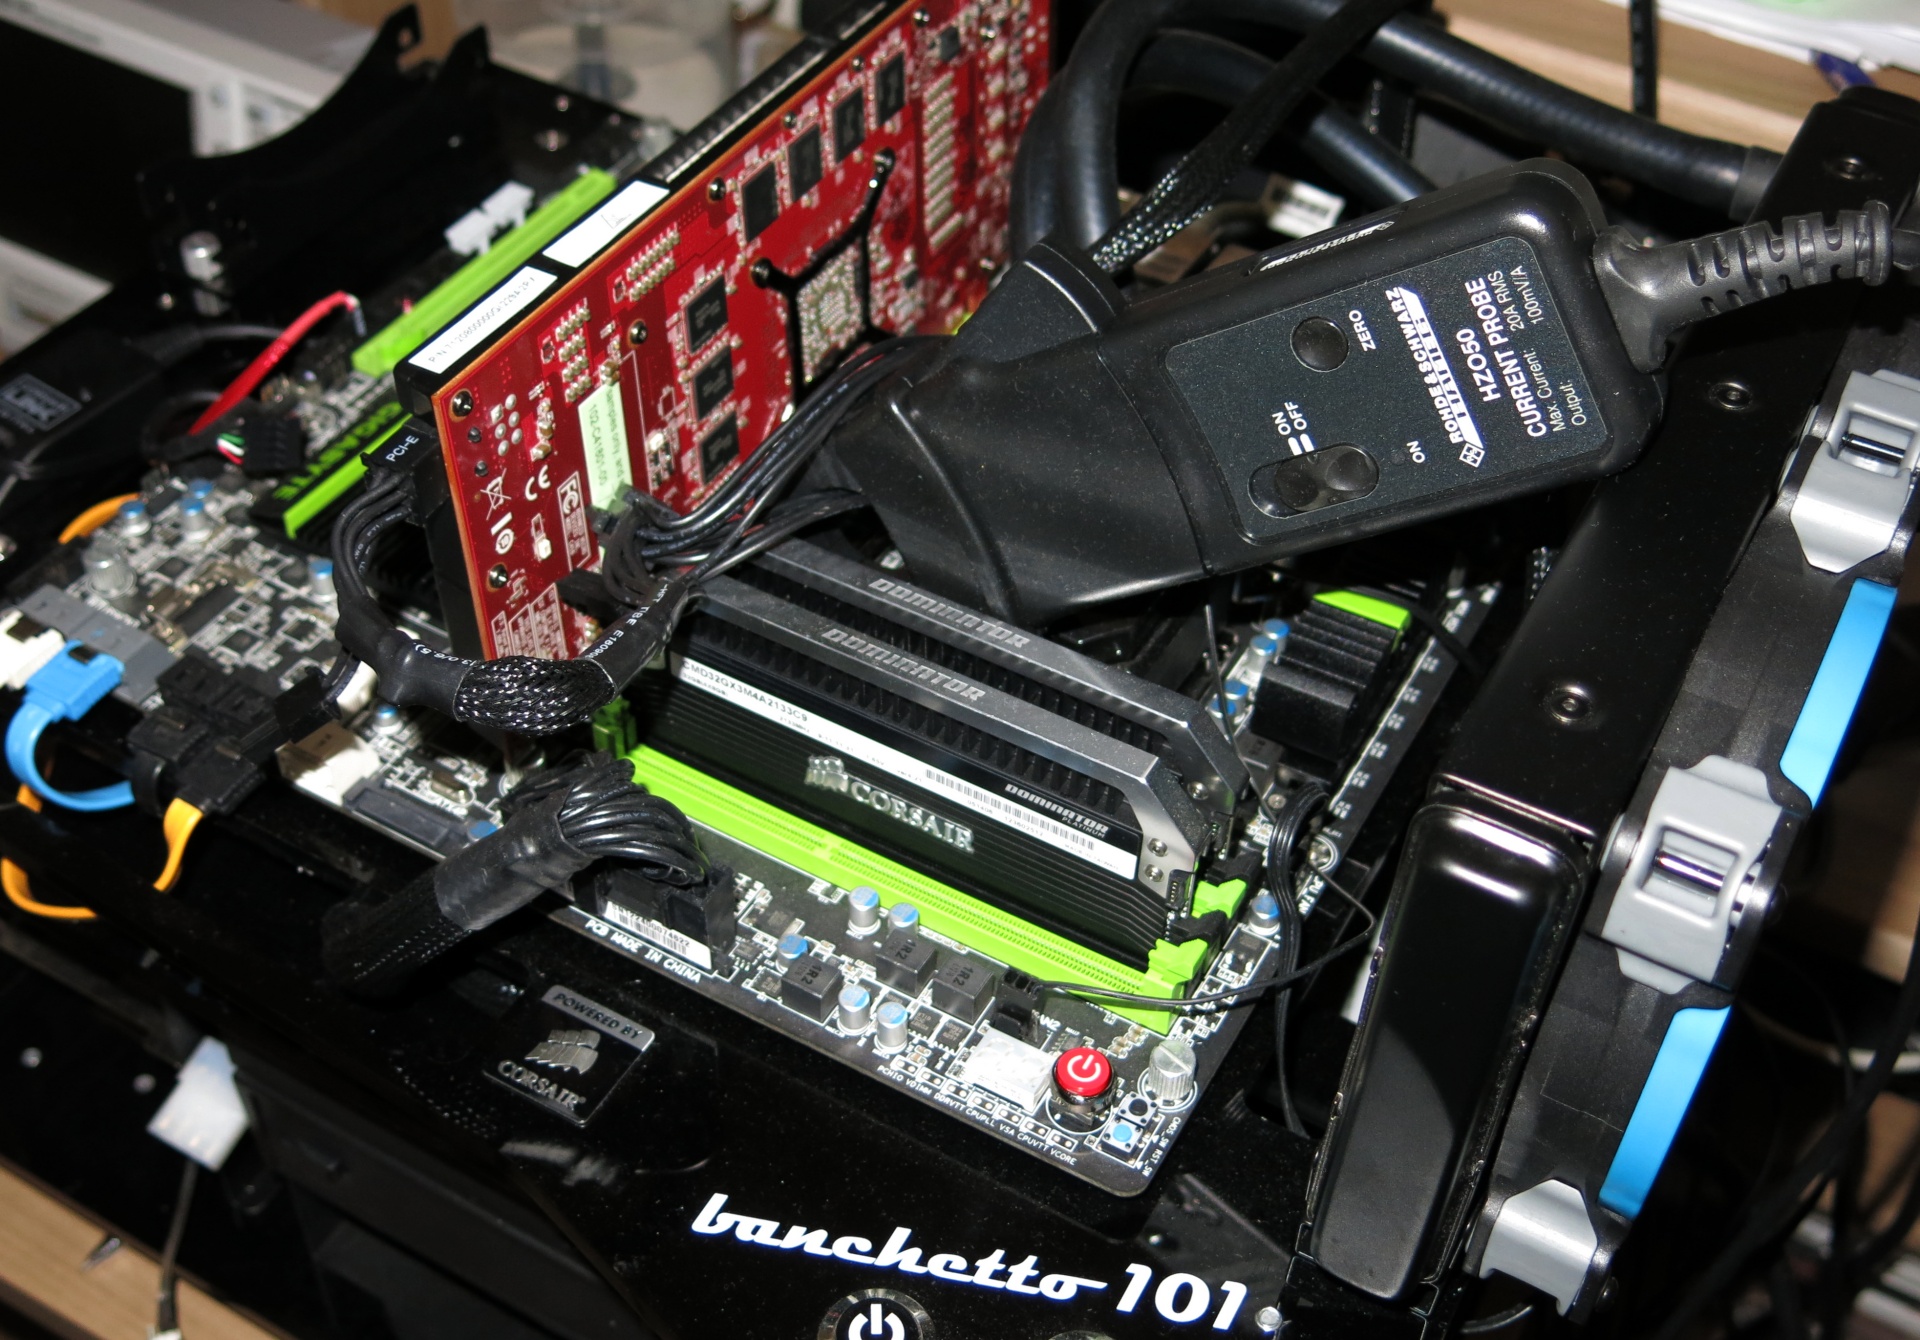
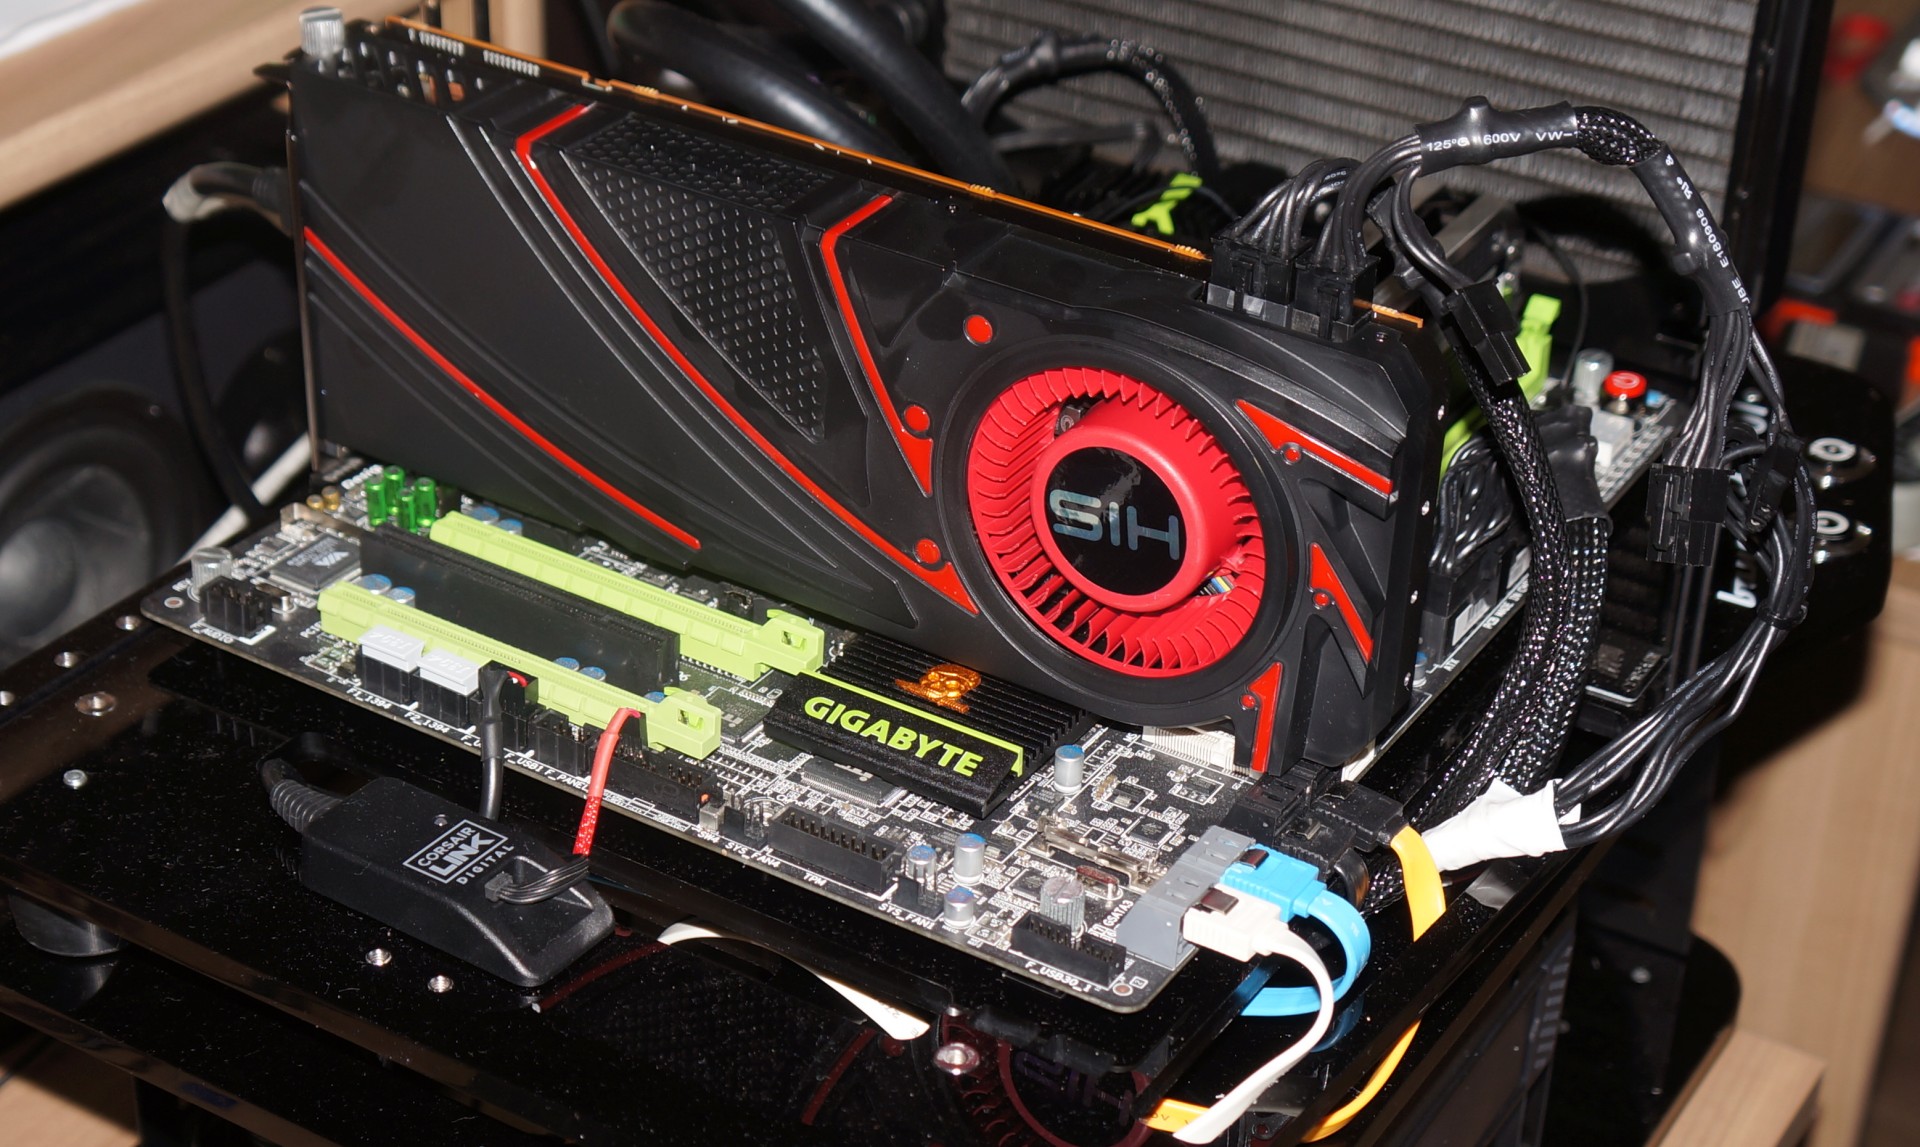
A carefully-picked test system is designed to facilitate analysis of CPU scaling based on cores, threads, and clock rates. For most of the benchmarks, the processor is overclocked to prevent platform-limited situations. However, I also have a complete page dedicated to processor-oriented testing for a more complete performance picture.
Get Tom's Hardware's best news and in-depth reviews, straight to your inbox.
| CPU and Cooler | Intel Core i7 3770K (Ivy Bridge), Overclocked to 4.5 GHzCorsair H100i Compact Water Cooler (Gelid GC Extreme) |
|---|---|
| Motherboard | Gigabyte G1. Sniper 3 |
| RAM | 32 GB (4 x 8 GB) Corsair Dominator Platinum DDR3-2133 |
| SSD | 2 x Corsair Neutron 480 GB |
| Power Supply | Corsair AX1200i |
| Operating System | Windows 7 x64 Ultimate SP1 |
| Drivers | AMD FirePro 13.251.1Nvidia Quadro 332.21 |
| Other Equipment | Microcool Banchetto 101HAMEG HMO 1024 Four-Channel Digital Memory OscilloscopeHAMEG HZO50 (1 mA-30 A, 100 kHz DC, Resolution 1 mA)HAMEG HMC 8012HAMEG HZ154 (1:1, 1:10), Assorted Adapters |
Three Gaming Cards (For Comparison, Of Course)
Admittedly, it's usually pointless to throw gaming-oriented graphics cards into a round-up of professional products. Software drivers are such a big part of what makes a FirePro or Quadro card distinct, that we know the Radeons and GeForces just won't fare as well. Then again, it's still important to know how desktop boards are represented in performance and image quality comparisons. Are there certain applications that don't necessitate workstation-class hardware? That's what we want to know. So, we're throwing in three gaming cards as well. They'll be the gray bars in the benchmark results graphs.
Let’s jump right in with the first of eight benchmark sections.

Igor Wallossek wrote a wide variety of hardware articles for Tom's Hardware, with a strong focus on technical analysis and in-depth reviews. His contributions have spanned a broad spectrum of PC components, including GPUs, CPUs, workstations, and PC builds. His insightful articles provide readers with detailed knowledge to make informed decisions in the ever-evolving tech landscape
-
spp85 AMD FirePro now a days performs very good at a cheaper price. Good job AMD. Keep on improving that.Reply
When AMD releases the mighty 16GB FirePro 9100 based on Radeon R9-290X core will be competitive to the Quadro K6000 in performance. -
FormatC I've also reviewed the FirePro W9100 in a large article with a lot of real-world benchmarks (the review was published last week in German). But AMD is really funny: the W9100 launch was at 7th, the R9 295X2 at 8th... So we got not time enough to translate it faster or merge the results. It's a shame :(Reply -
Shankovich Can't wait for the W9100 benchmarks! Getting one sent to me but oh man I still want to see some results :DReply -
PepitoTV I would've loved to see Titan benchmarks included as that card is often named as a 'poor man' workstation card...Reply -
bobcramblitt Thanks for this. Would love to see some future benchmarking of workstation-level systems using the new SPEC workstation benchmark (SPECwpc V1.0 -- http://www.spec.org/gwpg/wpc.static/wpcv1info.html). But, then again, I'm a SPEC guy...Reply -
edhap Hey SPEC guy, when can we do away with synthetic benchmarks for the workstation market? Hopefully VP12 is the last of these and you can focus on real applications. The last thing I need is another benchmark that does not match real world use casesReply
I find that internal benchmarking the only way to really understand the value of workstation cards. W7000 for example - it was awesome in our internal testing. While good, the cards is much better than these benchmark results suggest. Not sure why I would look at another SPEC benchmark when I will still need to test the cards in-house to really know how good they are for our applications and models. -
adamglick Fortunately, VP12 is MUCH MUCH closer to an actual (non-biased) representation of real-world application performance than was VP11. Yes, it's still "synthetic" but it uses actual code traces from updated versions of real applications -and its results are typically in-line with actual application testing results.Reply
Unfortunately, testing in the real applications (using something like APCapc) requires actual licenses of the software apps. Many of these vendors (CATIA, NX, etc) simply don't make temp licenses available for reviewers/journalists or other non-users.
VP12 should be quite good enough to help make informed evaluations of GPU hardware. If you are concerned about seeing in-application performance measurements for particular apps, you can ususually find the data with a bit of googling, although take results you find posted on the internet by "regular Joe's" with a grain of salt.
Adam Glick
Sapphire Technologies
-
adamglick *It is a shame Tom's did not include the results of the latest AMD FirePro 9100 card. They do actually have this card for eval and testing in house and It's a mystery to me why they chose not to include the results here.Reply
tsk tsk tsk -
filippi It was a great review. thanks a lot!Reply
About CPU Scaling: "In the second set of our scaling results, only SolidWorks responds to CPU frequency. Core and thread count don't make a difference.¨
This is not entirely true. It goes as far as 10% at 4.5 GHz.


