3D XPoint: A Guide To The Future Of Storage-Class Memory
Memory and storage collide with Intel and Micron's new, much-anticipated 3D XPoint technology, but the road has been long and winding. This is a comprehensive guide to its history, its performance, its promise and hype, its future, and its competition.
Synthetic Performance Previews - Optane Vs QuantX
First, we caution readers that all of the benchmark data presented is of the vendor-supplied variety, and we urge you not to rely too heavily on the results. Intel and Micron generated these tests with early 3D XPoint media revisions on prototype boards, so end products may vary significantly.
General Performance
A perfect storage device for today's workloads would provide increased performance under light load with mixed workloads, lower latency, and a superb QoS profile. IMFT's test data indicates that 3D XPoint improves all of those categories.
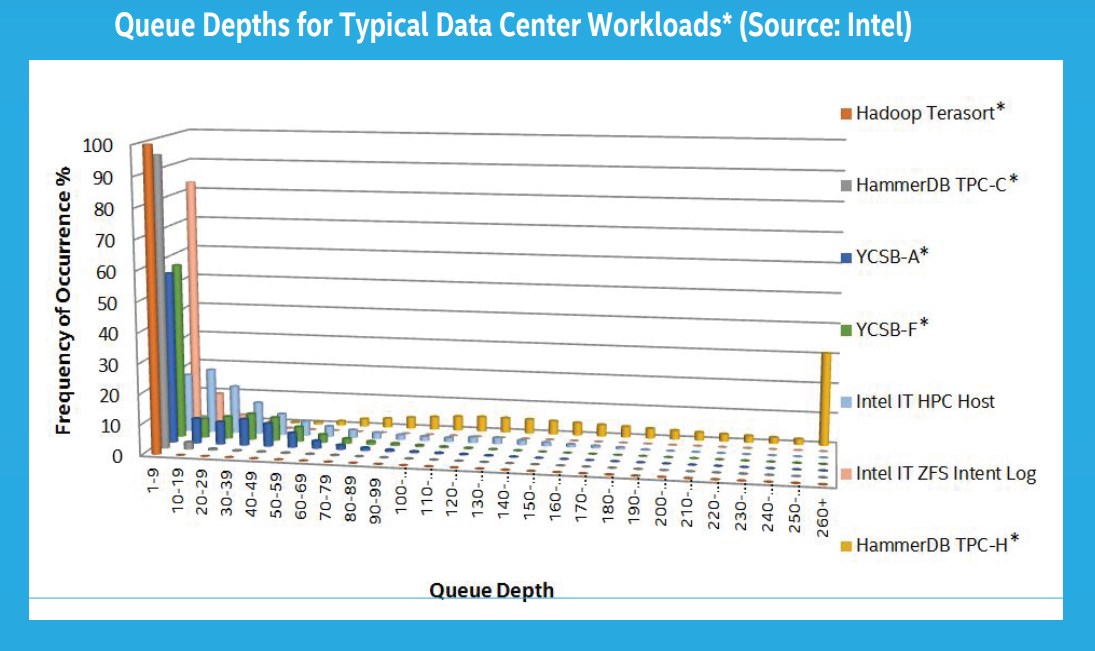
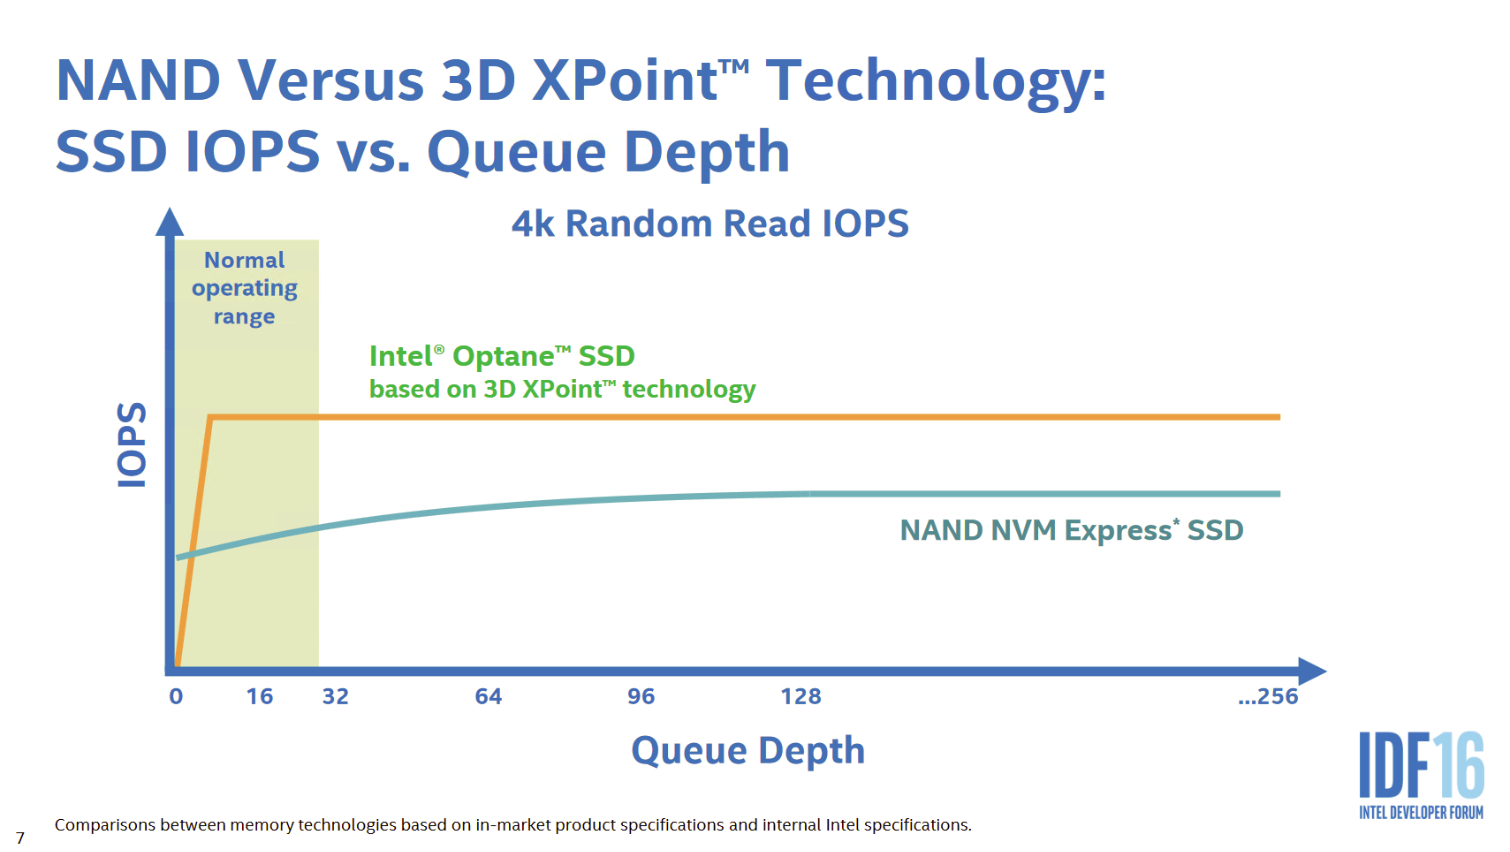
Before we jump into the performance benchmarks, it is important to understand the nature of normal workloads for both client and enterprise workloads. According to Intel's workload examinations and our own internal observations the majority of workloads rarely stray into high Queue Depth (QD) territory. Even intense workloads tend to spike into high-QD areas for only short periods, and then quickly fall back into lower ranges. These spikes result from the outstanding I/O stacking up behind the storage device. If the device were faster and answered the requests sooner, it would eliminate most of the short spikes we see on the chart. A perfect example is found by measuring the average QD of an identical workload with an HDD and an SSD. The SSD will have a lower average QD measurement during the same workload because it satisfies the incoming requests faster.
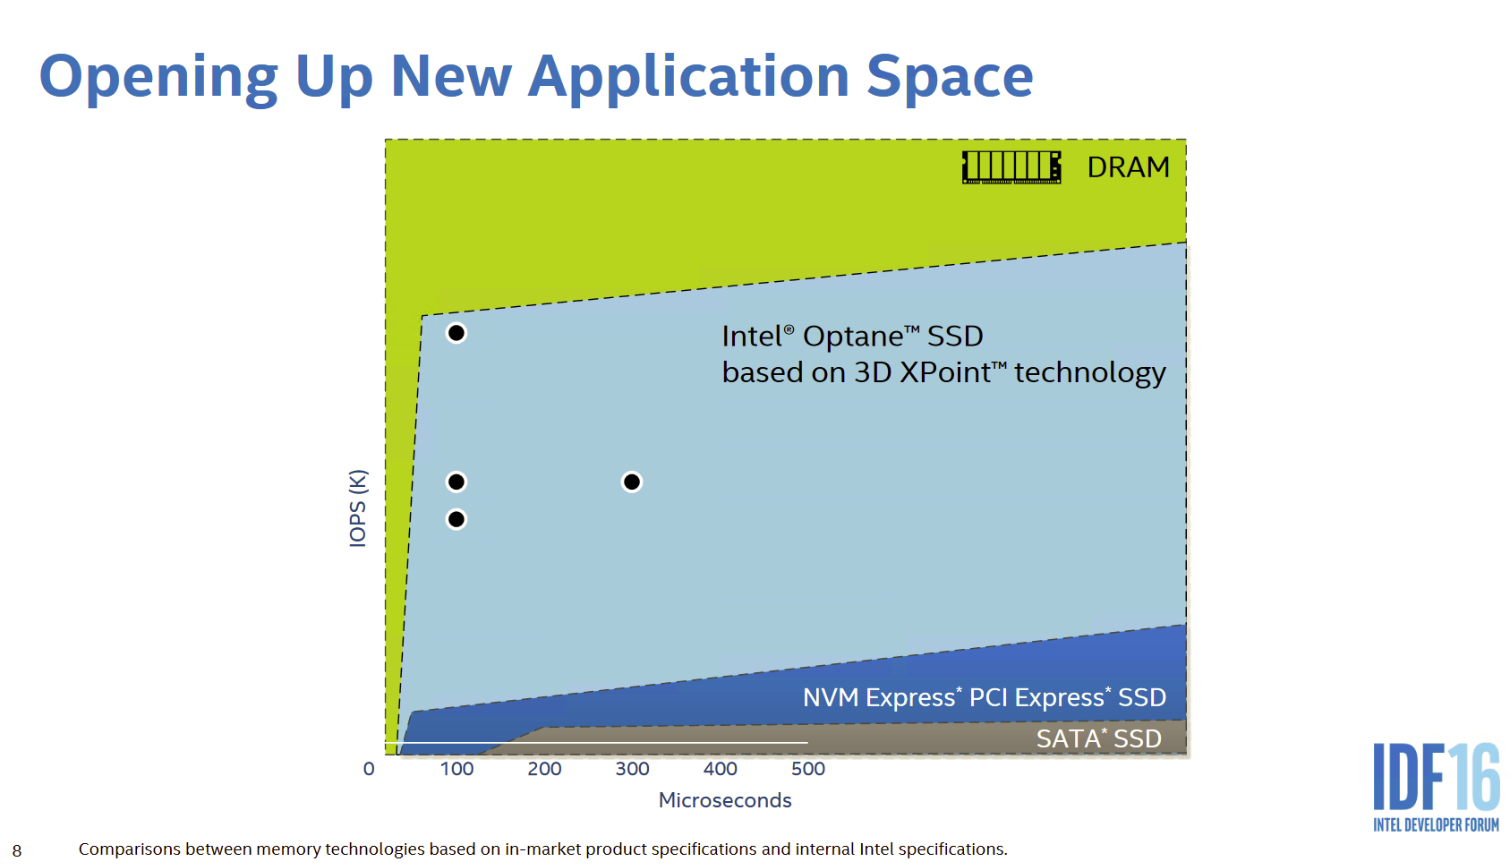
Consumer workloads rarely surpass QD2, and never for an extended period. IMFT designed 3D XPoint to address this reality with outstanding low-QD performance. The interface largely holds the media back from providing extreme performance measurements beyond what we observe with modern SSDs under heavy load, but it brings the unique characteristic of excellent low-QD performance and better mixed random performance. Today's leading NVMe SSDs require rare heavy-QD workloads to extract maximum performance, but 3D XPoint outperforms them with ease under real-world light load conditions.
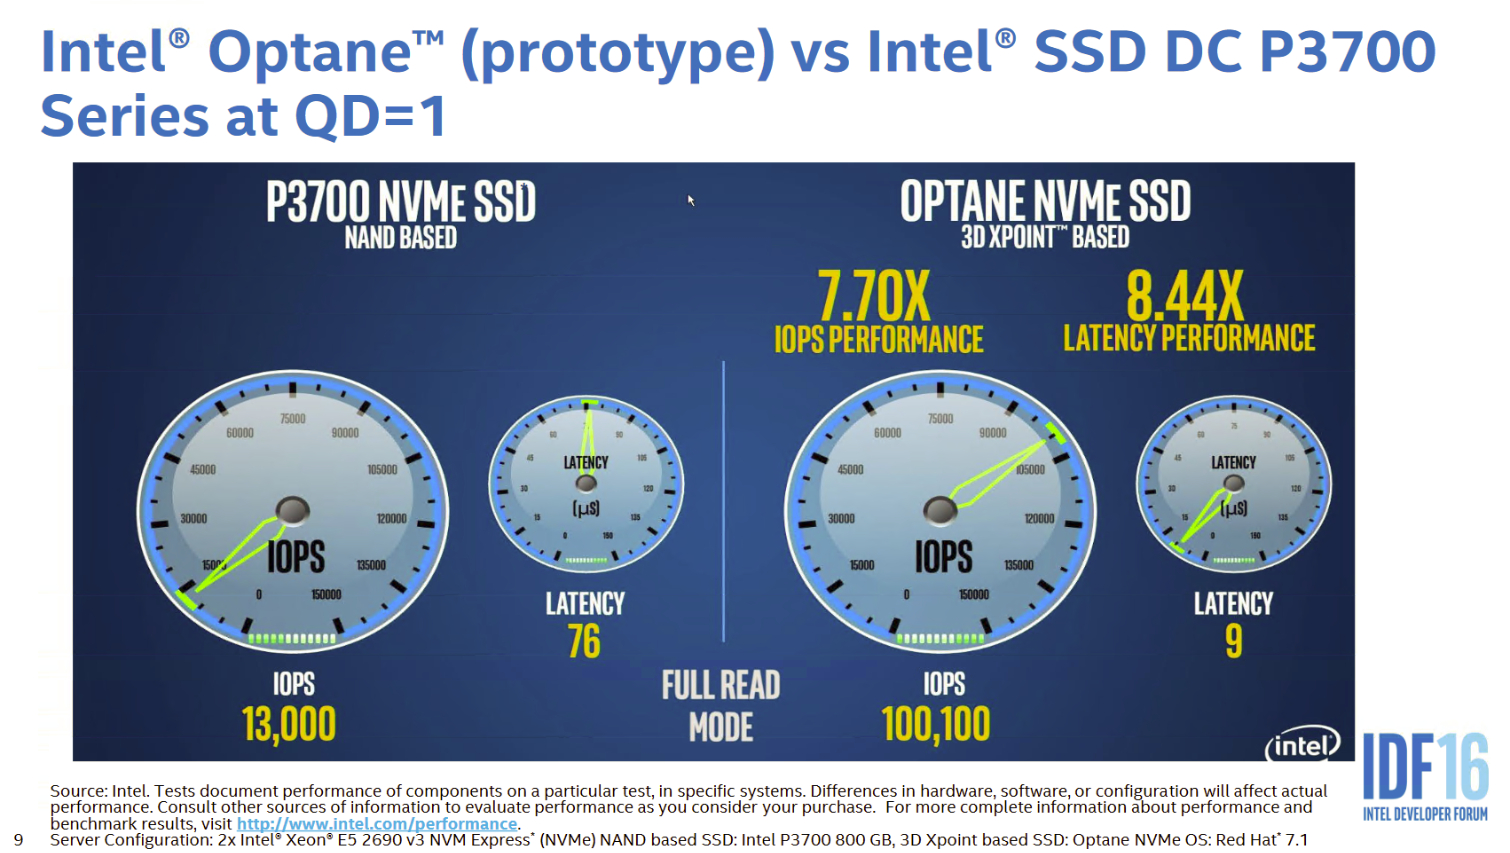
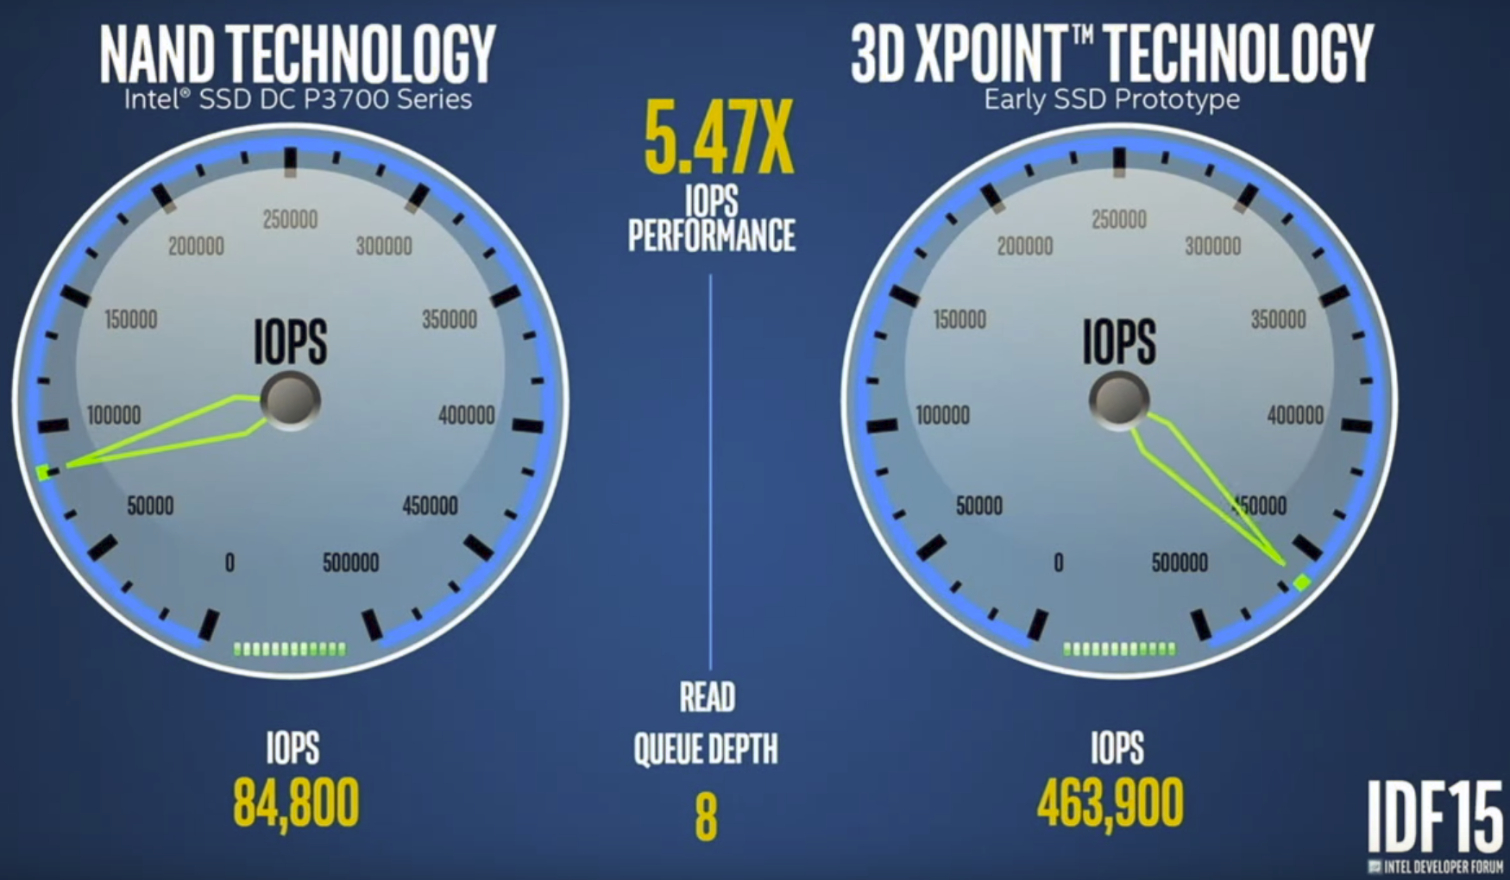
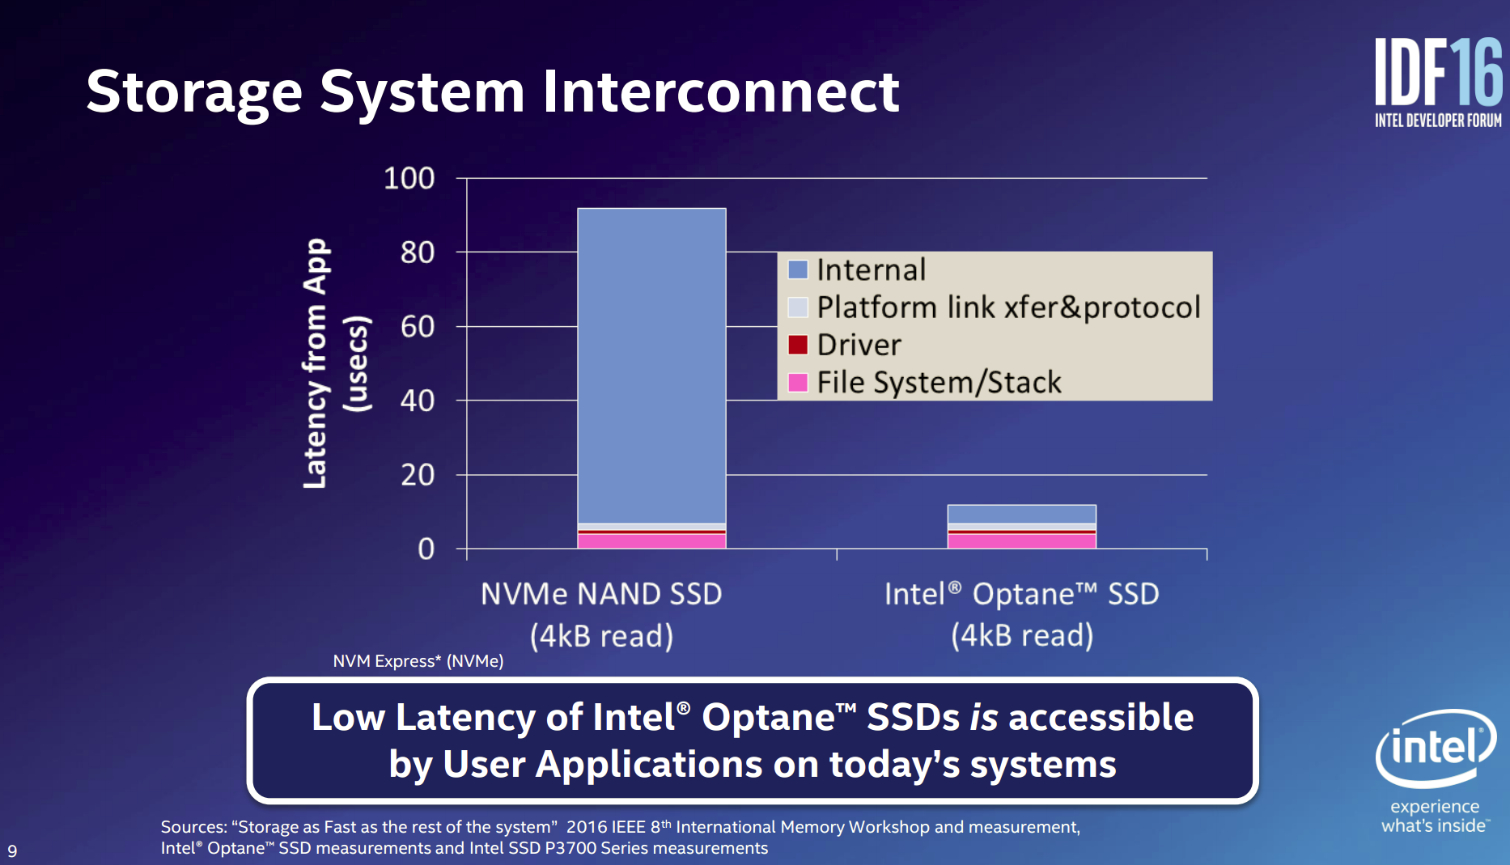
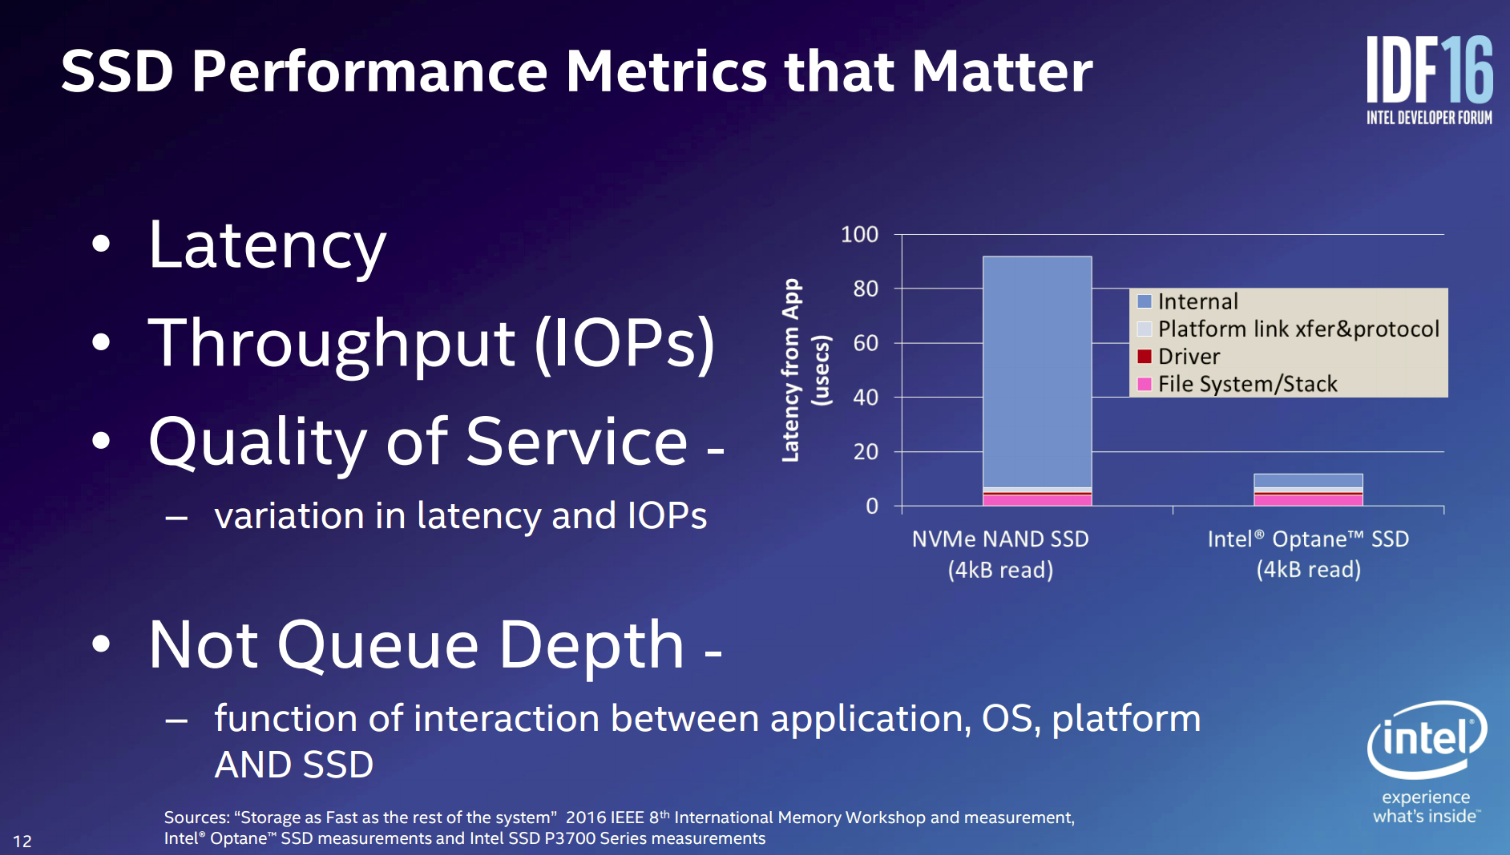
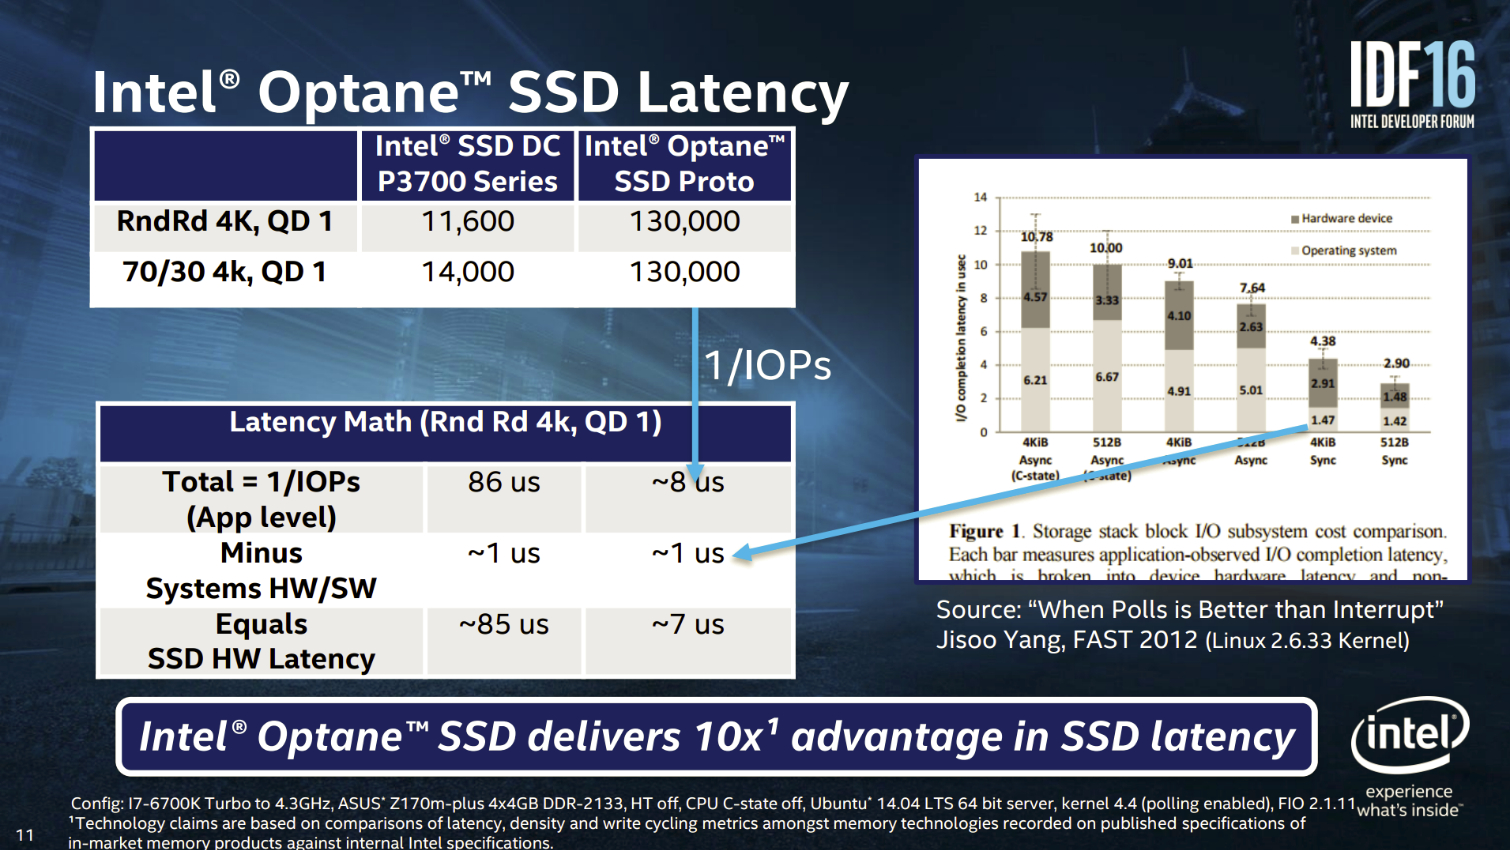
Intel's Optane handily beats the Intel DC P3700 at QD1 and QD8 by tremendous margins, even though they are both utilizing the same PCIe 3.0 x4 connection and NVMe interface. 3D XPoint-based devices can provide even more performance, but the interface remains the primary barrier after internal latency is removed. The internal latency of the NVMe SSD is in the 80ms range, while the Optane SSD is in the 5ms range. Removing the internal latency (faster media and proprietary media interface) provides more performance to the applications, even at low QD, but it exposes the remaining platform link transfer and protocol, driver, file system, and stack latencies.
NVMe provides the most lightweight and efficient interface available, at least currently, but it still restricts performance. Intel famously started the broad 60-member strong industry group that developed the NVMe interface.
Intel also touts the improved QoS (Quality of Service) metrics. QoS is an important facet of performance for applications; in fact, we built our entire enterprise test regimen specifically to measure performance variability (see The QoS Domino Effect). The NVMe interface, streamlined internal 3D XPoint processes, and low-QD workload satisfaction all help to improve QoS.
Get Tom's Hardware's best news and in-depth reviews, straight to your inbox.
Optane Synthetics
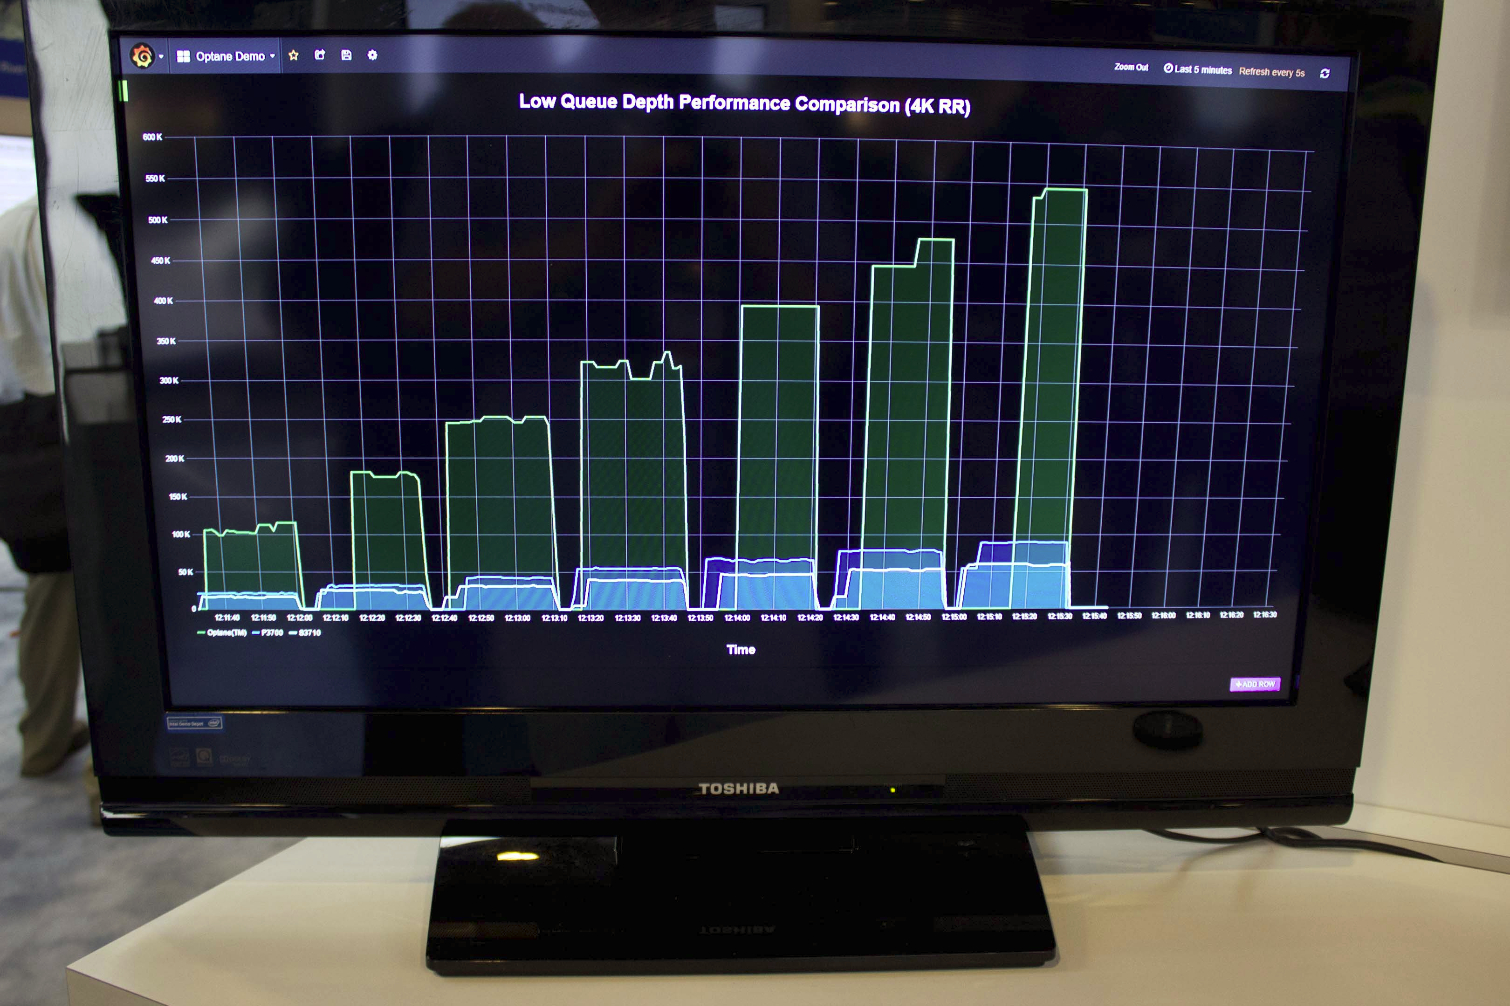
Intel provided a closer look at Optane performance during a demo at IDF 2016. The legend on the left (which is blurry) tops out at 600,000 IOPS, so the Optane SSD peaks near 550,000 IOPS during the scaled 4K random read workload at QD64. The horizontal axis is time-based, and we note some variation during the read workloads, which is likely due to the early material.
Most overlook mixed-workload performance and instead focus on simple random read/write specifications. However, mixed workloads are where the rubber meets the road. 100% random read or write environments are rare.
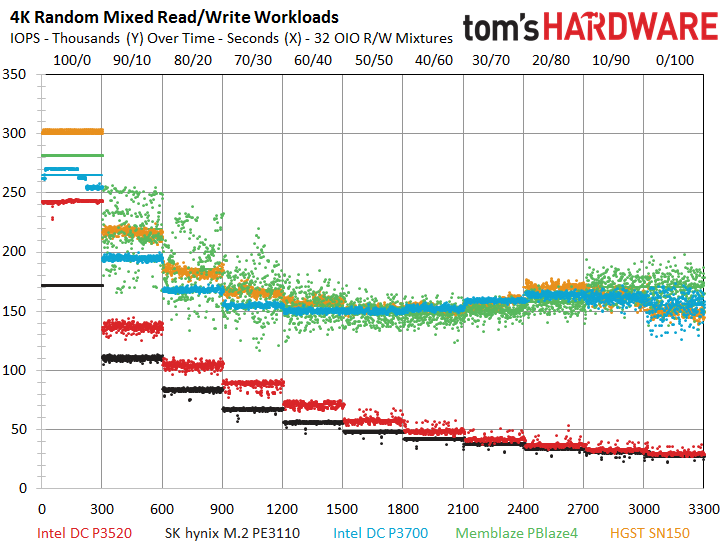
We've included our internal test results for the latest PCIe SSDs during mixed workloads. The test begins with a pure random read workload to the left (0%), and we steadily add in more write data in 10% gradients as we progress through the test, ending with a 100% write workload on the right. We conducted the entire test at an equivalent of QD32 (we use multiple threads, so we refer to it as Outstanding I/O). The 1.6TB Intel DC P3700 scores 150,000 IOPS at the commonly-encountered 70/30 mixed read/write workload.
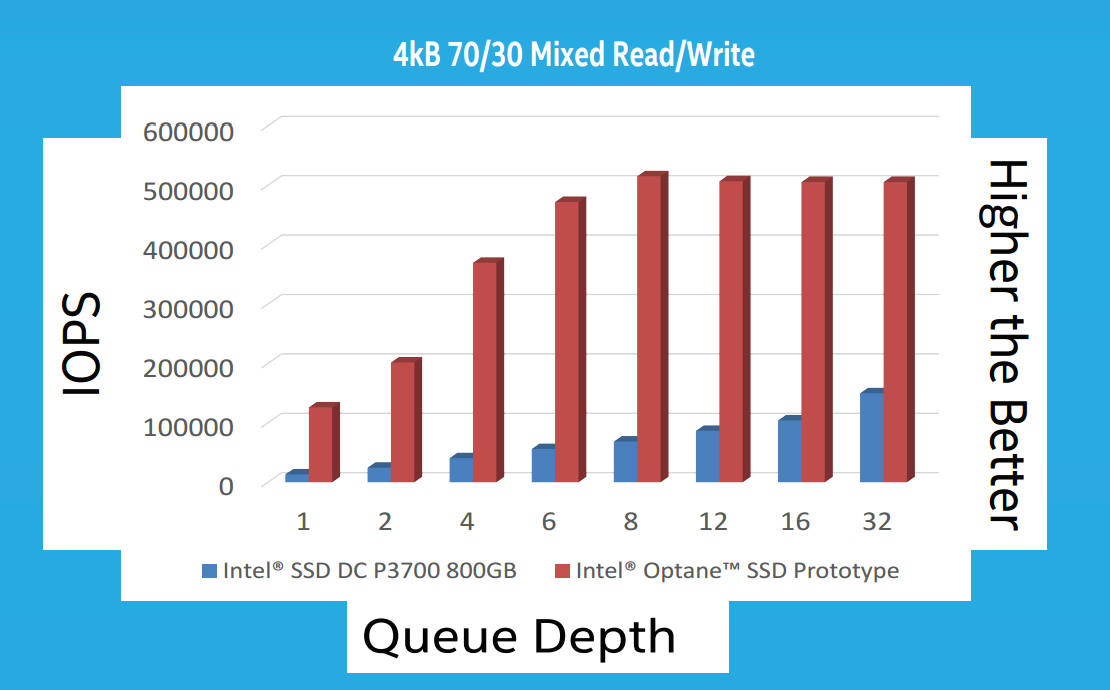
Intel provided a somewhat different chart alignment that shows scaling with an identical 70/30 mixed workload as QD increases. Intel recorded nearly the same 150,000 IOPS we observed with a DC P3700 at QD32, but the Optane SSD provided 500,000 IOPS under the same conditions. Intel used a single-threaded workload and hit 500,000 IOPS, whereas we used eight threads to extract 150,000 IOPS from an SSD. The Optane's performance is extraordinary for any storage device during a mixed workload, and it easily triples the performance of the leading SSDs we've tested.
Our chart also highlights another SSD characteristic: performance drops quickly as you mix more random write data into the workload (as we move to the right). This can be a tremendous differentiator between SSDs, as some will drop to their lowest level of performance with the addition of a mere 10% write workload (90/10). Intel informed us that 3D XPoint performance does not drop during mixed workloads, at least by any margin considered comparable to a NAND-based SSD. Our mixed workload chart would have an essentially flat line at 550,000 IOPS if we included a 3D XPoint sample. The rock-steady mixed workload performance is perhaps one of the biggest performance advantages, and it will provide tangible real-world results.
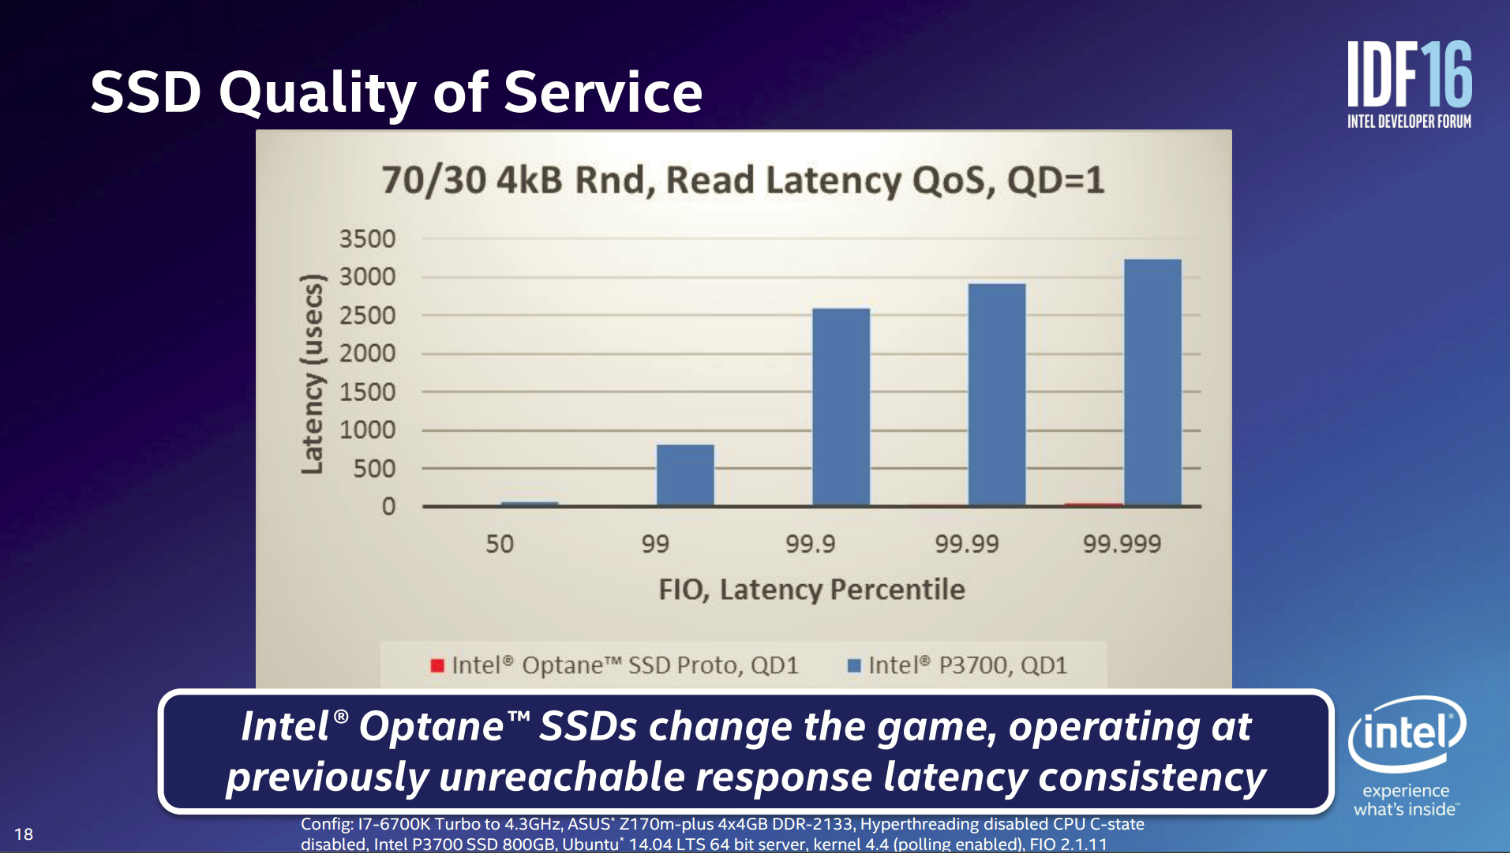
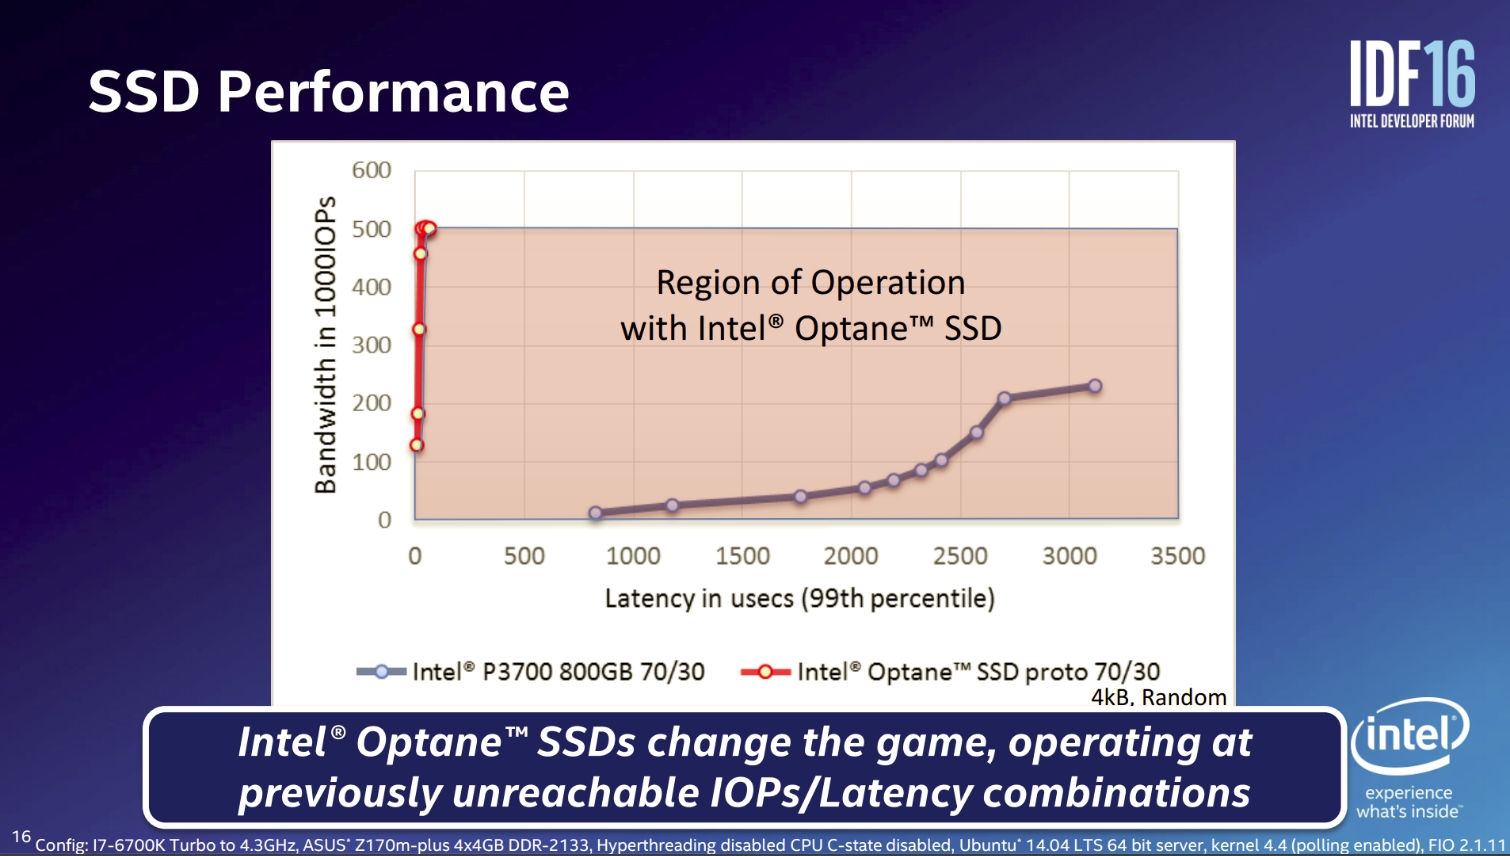
According to Intel, 3D XPoint also provides up to a 10X latency advantage over SSDs, and one of the most important metrics is the mixed workload QoS. Intel measured a (roughly) 3.2ms 99.999th% latency (a measurement of the worst-case latency) with a DC P3700 at QD1. The Intel Optane (in red) barely even registers on the QoS bar chart.
The bandwidth over 99th percentile latency chart contrasts the gulf between the Optane's QoS and that of a NAND-based SSD. QoS will be a minor concern with 3D XPoint devices due to workload satisfaction at low QD and the elimination or reduction of the background processes that hinder consistent performance, such as wear leveling, TRIM, and GC.
Micron QuantX Synthetics
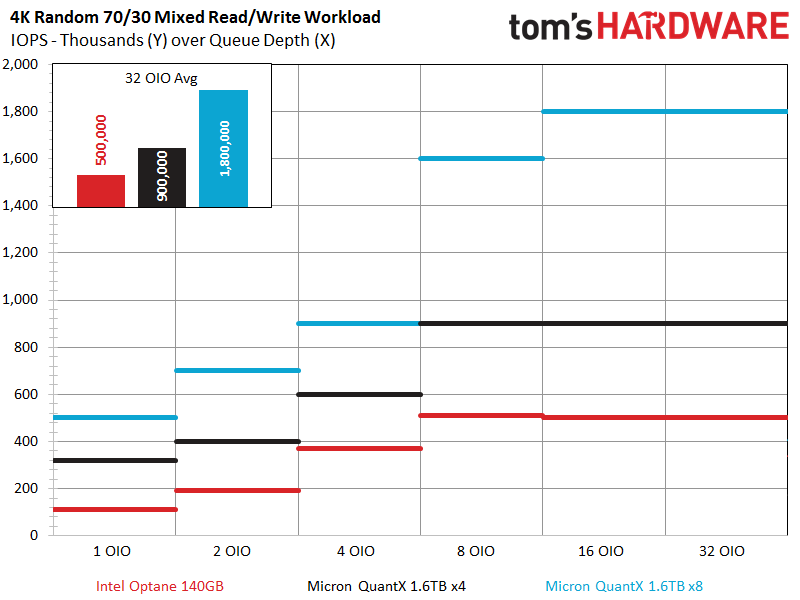
The Micron 4k 70/30 mixed read/write synthetic workloads are a lot more impressive than those for Optane. It appears that the QuantX products are nearly twice as fast as Intel's finest, even with the same PCIe 3.0 x4 connection. The Intel SSDs top out at 500,000 IOPS, but QuantX reaches 900,000. The NAND-based SSD (orange line) offers roughly 200,000 IOPS in the same workload (this is most likely the 1.6TB 9100 MAX we've tested).
Micron also included test results for a PCIe 3.0 prototype with an x8 connection, and it weighed in at 1.8 million IOPS. Interestingly, the QuantX is obviously saturating the x8 connection, so we certainly don't see the performance ceiling. Perhaps a PCIe 3.0 x16 or PCIe 4.0 interface can expose it, but that remains to be seen.
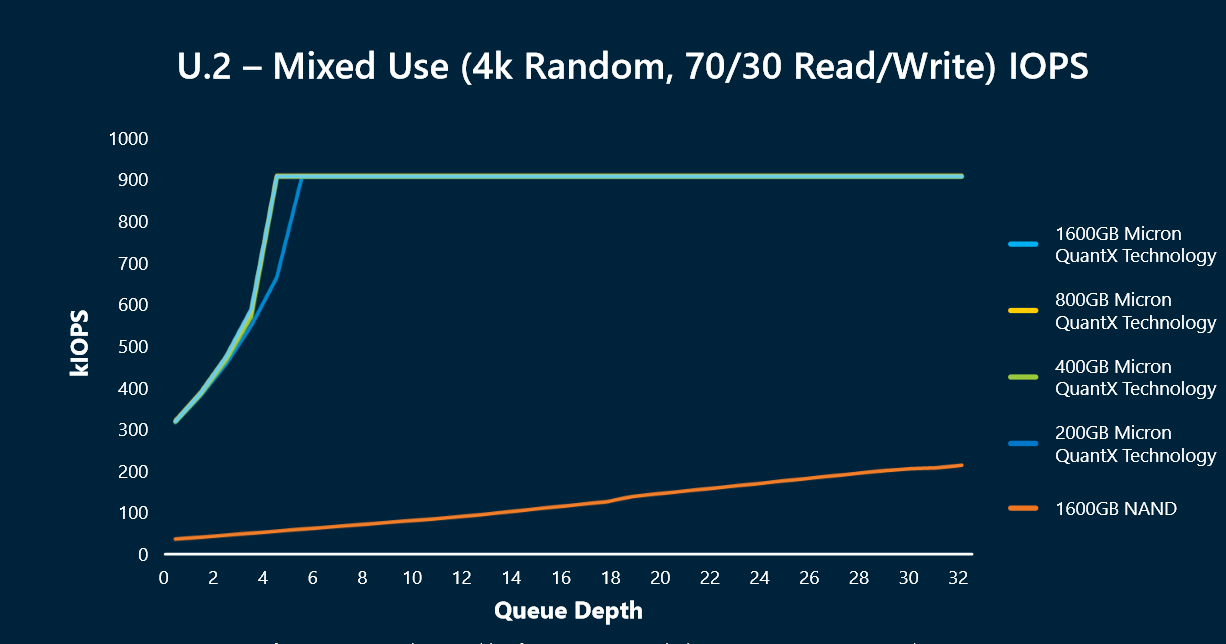
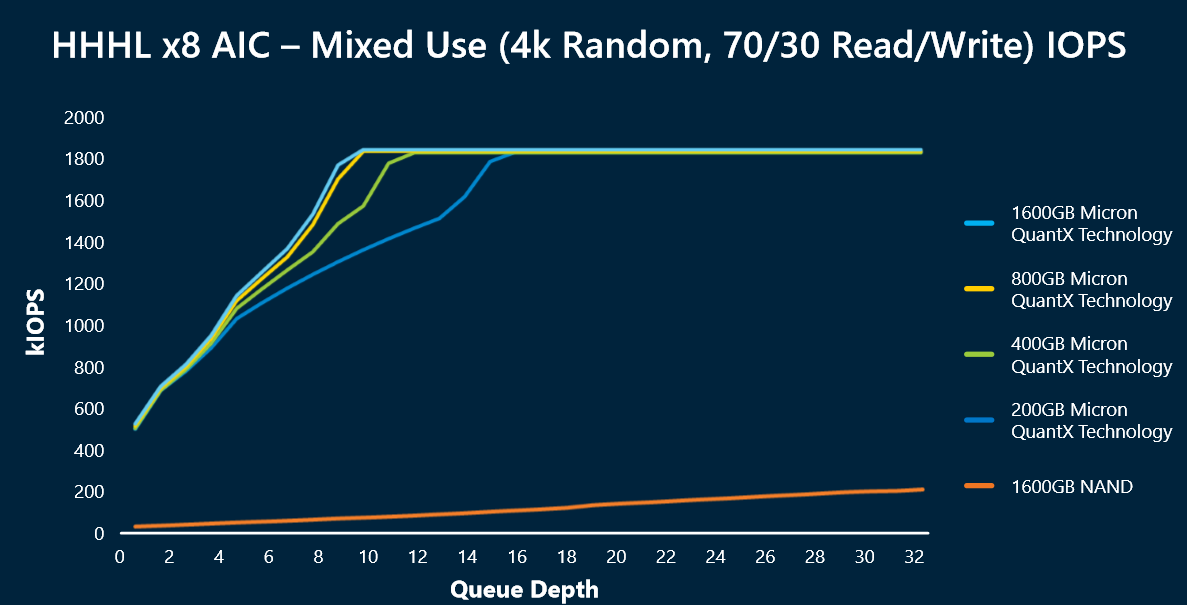
Another notable departure from the normal SSD routine is that QuantX SSDs offer the same maximum performance regardless of capacity. Typically, SSDs offer different performance based upon capacity due to the inter-related issues of both overprovisioning and parallelism. This often leads users to buy more capacity than they need to unlock higher performance.
QuantX kills both birds with one stone, as all of the capacities offer the same maximum performance and also offer the amazing low-QD performance, albeit with a minor low-QD scaling lag with the smaller models behind the x16 interface. It appears the only real drawback to smaller models will be the obvious lower capacity and, perhaps, endurance, but performance and scaling are no longer a concern.
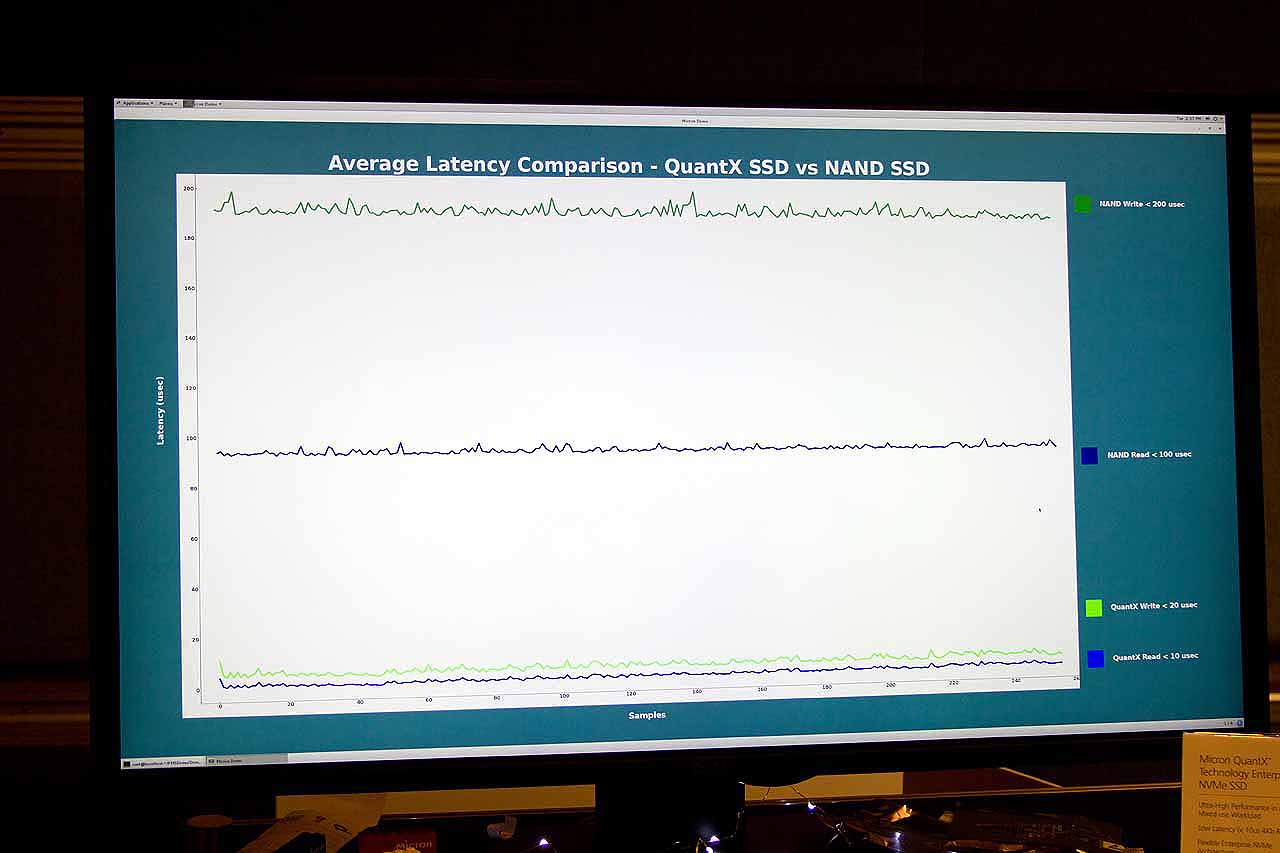
Micron also presented latency metrics for 4K read and write workloads. QuantX read/write latency was a mere 10/20 microseconds, in comparison to the SSD with write operations at 200 microseconds and read at 100 microseconds (a 10X improvement).
We couldn't resist, and created a chart with the Intel and Micron performance metrics combined. Intel indicated that its tests were conducted with a single worker, and Micron's test conditions appear similar, though the test conditions are unconfirmed. Different test conditions and other parameters could lead to depressed Intel performance values, but I am confident that Intel put its best Optane foot forward in its first public demo. In addition, Micron is experiencing superb small-capacity performance scaling, but that may be due to the company's unique architecture. Intel may not have that same scaling advantage, and its Optane prototype is only 140GB. Bigger Optane models may be faster.
Intel has already moved onto its own ASIC design, but the test results lead us to wonder if the company isn't simply re-purposing an SSD ASIC for the task. Micron may also employ novel FTL management techniques that provide an advantage. In either case, we notice that the QuantX provides superior performance at all levels of the test.
MORE: Best SSDs
Current page: Synthetic Performance Previews - Optane Vs QuantX
Prev Page The Hardware Next Page Enthusiast, Workstation, Data Center Performance
Paul Alcorn is the Editor-in-Chief for Tom's Hardware US. He also writes news and reviews on CPUs, storage, and enterprise hardware.
-
coolitic the 3 months for data center and 1 year for consumer nand is an old statistic, and even then it's supposed to apply to drives that have surpassed their endurance rating.Reply -
Paul Alcorn Reply18916331 said:the 3 months for data center and 1 year for consumer nand is an old statistic, and even then it's supposed to apply to drives that have surpassed their endurance rating.
Yes, that is data retention after the endurance rating is expired, and it is also contingent upon the temperature that the SSD was used at, and the temp during the power-off storage window (40C enterprise, 30C Client). These are the basic rules by which retention is measured (the definition of SSD data retention, as it were), but admittedly, most readers will not know the nitty gritty details.
However, I was unaware that JEDEC specification for data retention has changed, do you have a source for the new JEDEC specification?
-
stairmand Replacing RAM with a permanent storage would simply revolutionise computing. No more loading an OS, no more booting, no loading data, instant searches of your entire PC for any type of data, no paging. Could easily be the biggest advance in 30 years.Reply -
InvalidError Reply
You don't need X-point to do that: since Windows 95 and ATX, you can simply put your PC in Standby. I haven't had to reboot my PC more often than every couple of months for updates in ~20 years.18917236 said:Replacing RAM with a permanent storage would simply revolutionise computing. No more loading an OS, no more booting, no loading data
-
Kewlx25 Reply18918642 said:
You don't need X-point to do that: since Windows 95 and ATX, you can simply put your PC in Standby. I haven't had to reboot my PC more often than every couple of months for updates in ~20 years.18917236 said:Replacing RAM with a permanent storage would simply revolutionise computing. No more loading an OS, no more booting, no loading data
Remove your harddrive and let me know how that goes. The notion of "loading" is a concept of reading from your HD into your memory and initializing a program. So goodbye to all forms of "loading". -
hannibal The Main thing with this technology is that we can not afford it, untill Many years has passesd from the time it comes to market. But, yes, interesting product that can change Many things.Reply -
TerryLaze Reply
Sure you won't be able to afford a 3Tb+ drive in even 10 years,but a 128/256Gb one just for windows and a few games will be affordable if expensive even in a couple of years.18922543 said:10 years later... still unavailable/costs 10k
-
zodiacfml I dont understand the need to make it work as DRAM replaement. It doesnt have to. A system might only need a small amount RAm then a large 3D xpoint pool.Reply
The bottleneck is thr interface. There is no faster interface available except DIMM. We use the DIMM interface but make it appear as storage to the OS. Simple.
It will require a new chipset and board though where Intel has the control. We should see two DIMM groups next to each other, they differ mechanically but the same pin count.
