AMD Radeon R9 380X Nitro Launch Review
Tonga’s been around for more than a year now, and it’s taken all this time for it to finally be available for regular desktop PCs. Before now, this configuration was exclusively offered for a different platform. But does it still make sense today?
How We Test
Test System
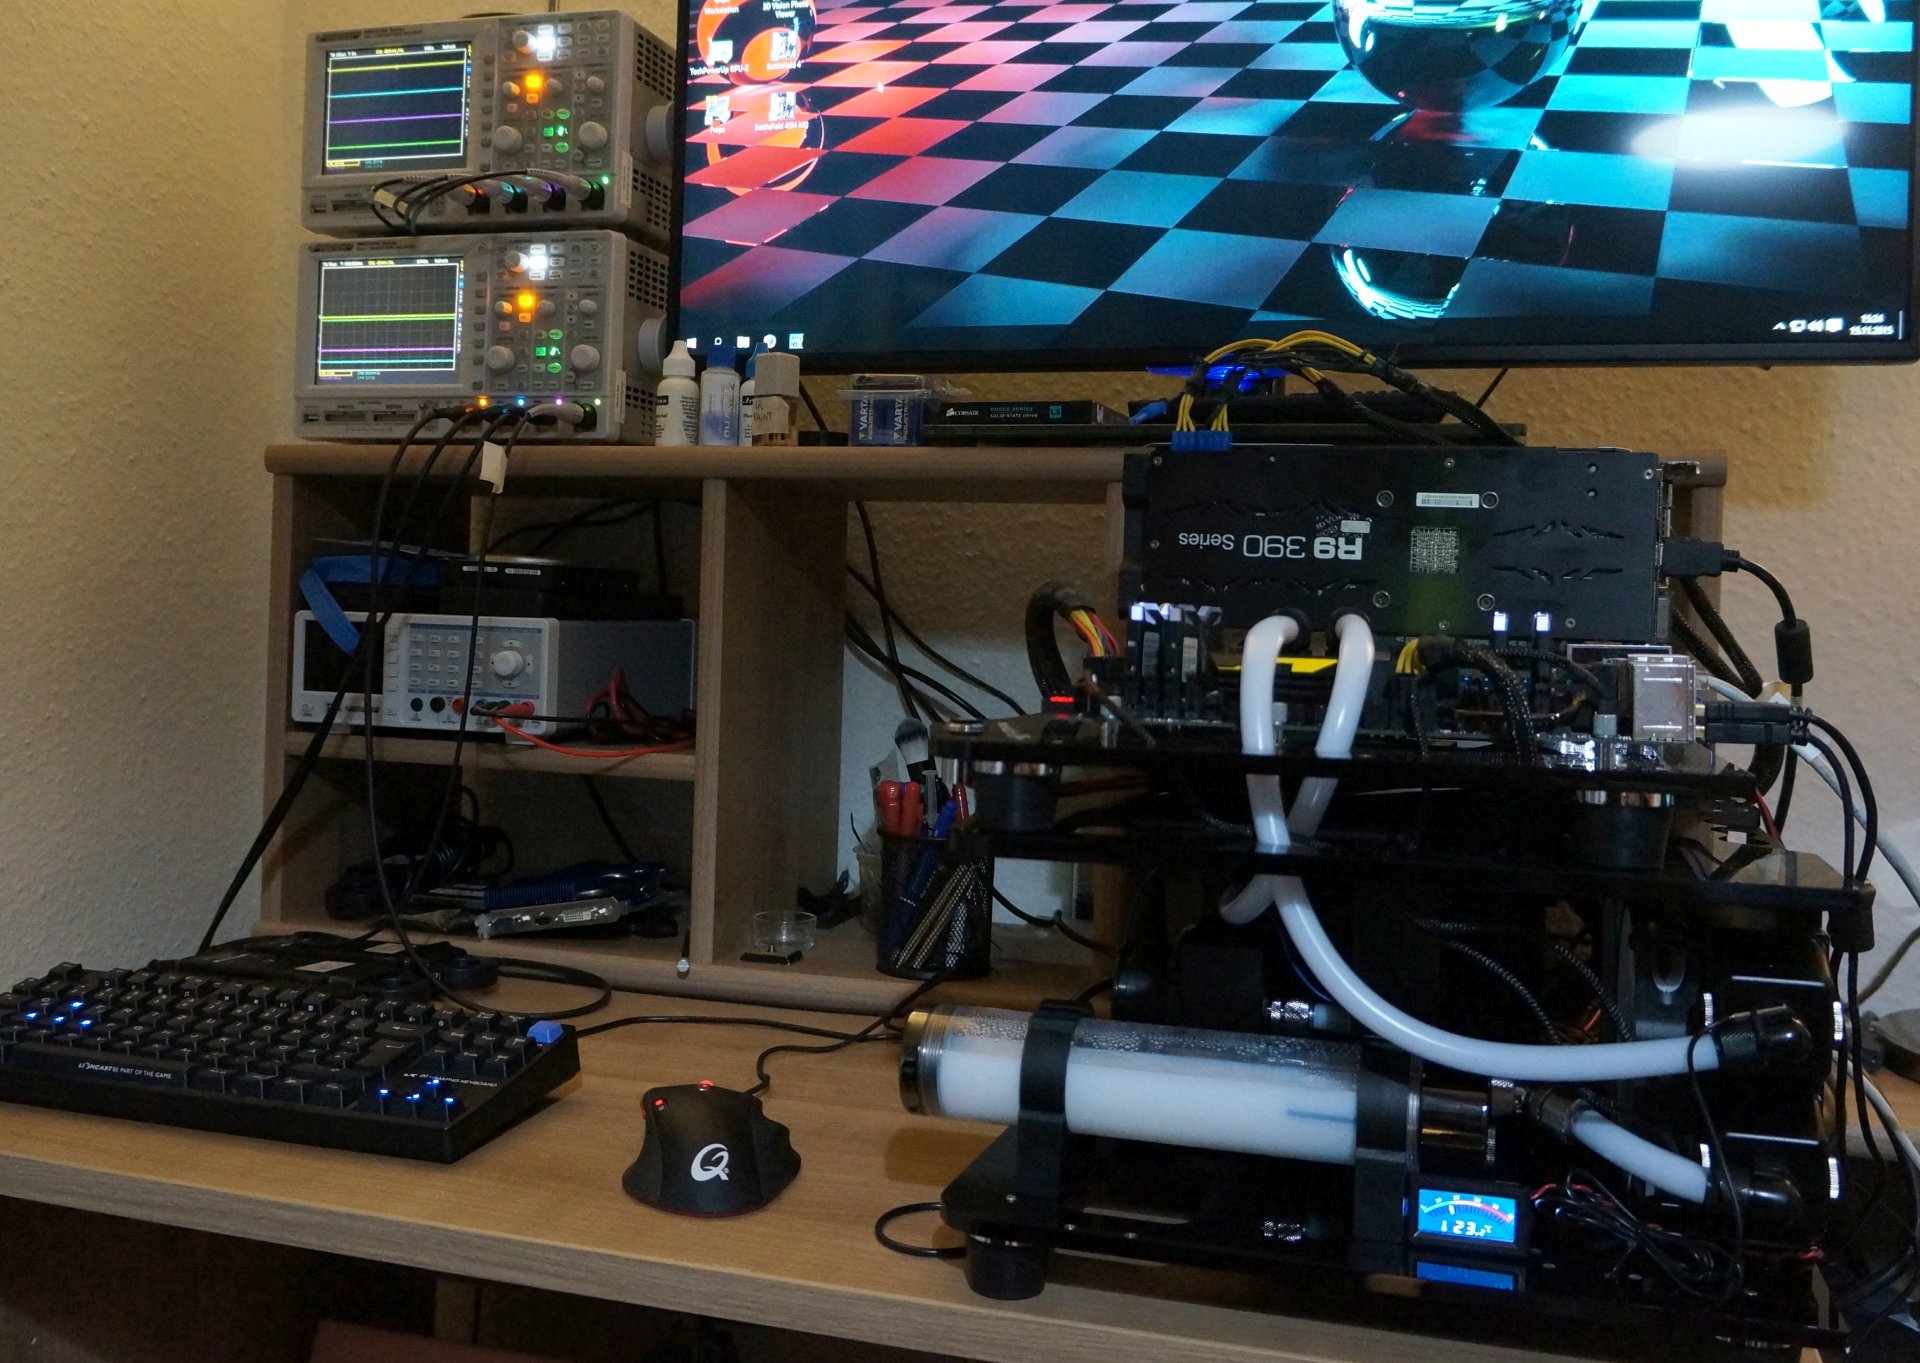
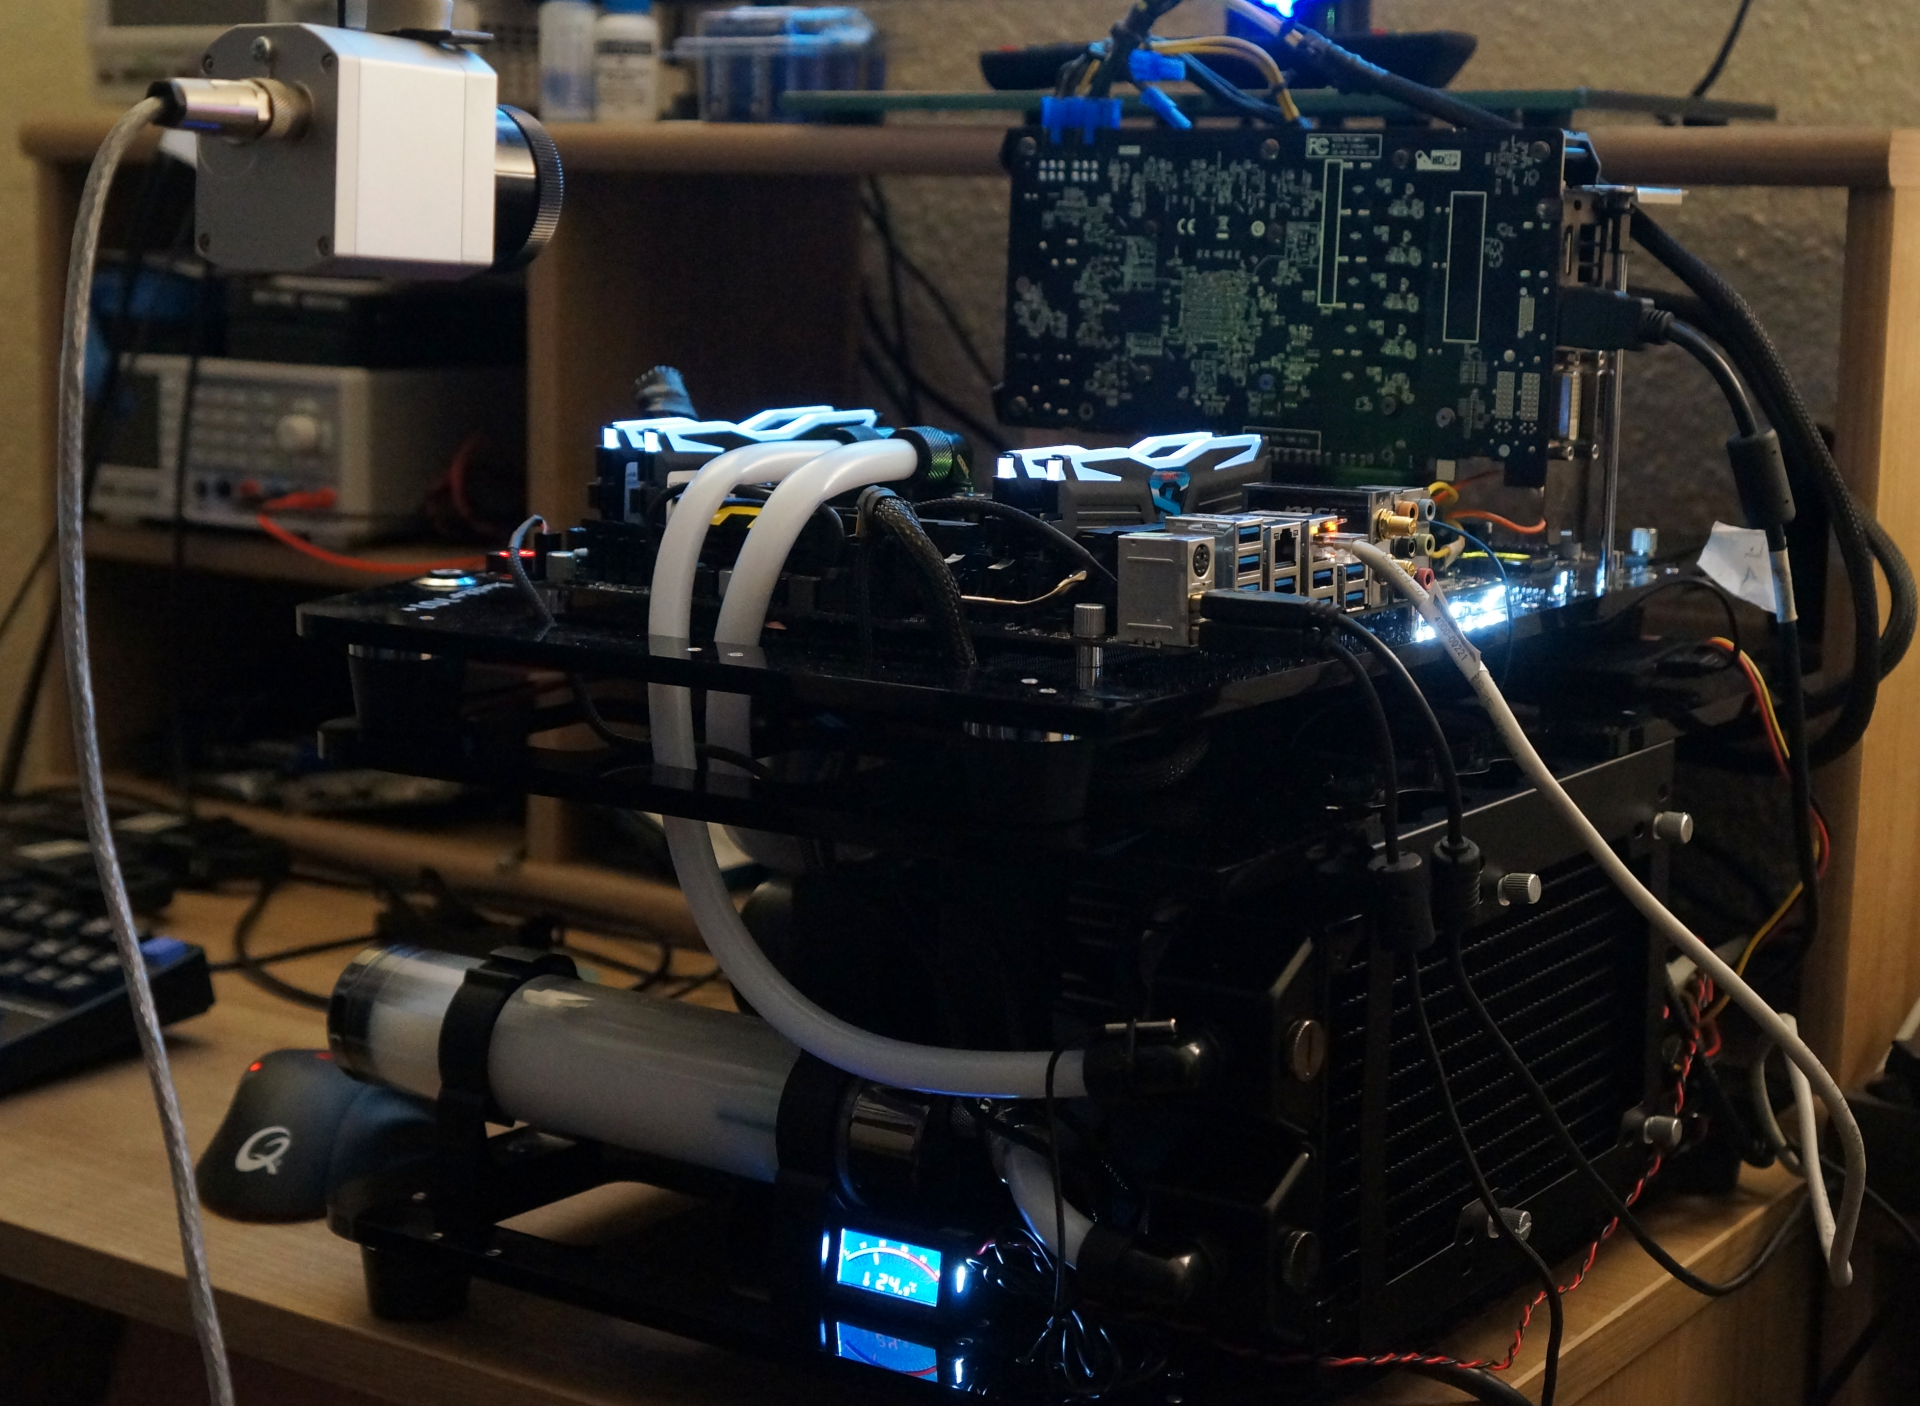
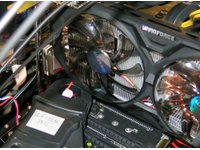
Our reference system hasn’t changed from a performance standpoint, though we did alter its cooling solution. Instead of the closed-loop liquid cooler, we're now using an open-loop solution by Alphacool with two e-Loop fans from Noiseblocker.
We changed our test system for two reasons. First, the near-silent setup enables us to take more accurate noise measurements. Second, it provides our new and even higher-resolution infrared camera with an unobstructed 360-degree view of the graphics card. There are no more tubes or other obstacles.
We follow the general trend and use Windows 10, which keeps us current and allows us to use DirectX 12.
| Test Method | Contact-free DC measurement at PCIe slot (using a riser card) Contact-free DC measurement at external auxiliary power supply cable Direct Voltage Measurement at Power Supply Real-time infrared monitoring and recording |
|---|---|
| Test Equipment | 2 x HAMEG HMO 3054, 500MHz digital multi-channel oscilloscope with storage function 4 x HAMEG HZO50 current probe (1mA - 30A, 100kHz, DC) 4 x HAMEG HZ355 (10:1 probes, 500MHz) 1 x HAMEG HMC 8012 digital multimeter with storage function 1 x Optris PI450 80Hz infrared camera + PI Connect |
| Test System | Intel Core i7-5930K @ 4.2GHzAlphacool water cooler (NexXxos CPU cooler, VPP655 pump, Phobya balancer, 240mm radiator)Crucial Ballistix Sport, 4 x 4GB DDR4-2400MSI X99S XPower AC1x Crucial MX200, 500GB SSD (system)1x Corsair Force LS 960GB SSD (applications, data)beQuiet Dark Power Pro 850W PSUWindows 10 Pro (all updates) |
| Driver | AMD: 15.11.1 Beta (press driver)Nvidia: ForceWare 358.91 Game Ready |
| GamingBenchmarks | The Witcher 3: Wild Hunt Grand Theft Auto V (GTA V)Metro Last LightBioshock InfiniteTomb RaiderBattlefield 4Middle Earth: Shadow of MordorThiefAshes of the Singularity |
Graphics Card Comparison
We’re using AMD’s Radeon R9 Fury Nano as the top of our range, allowing us to draw direct comparisons between it, the Sapphire R9 380X Nitro, a PowerColor Radeon R9 390, and a “smaller” MSI Radeon R9 380. These graphics cards should cover the entire range of AMD’s offerings in this segment. We were planning to add the Radeon R9 390X, but it’s just too close to the 390. In the end, we wanted to include at least one faster card for the higher-resolution tests.
MSI's GTX 970 4G and Gigabyte's GTX 960 Windforce represent Nvidia's portfolio. Interestingly, there's a large gap in the line-up between those two offerings. Or, seen from AMD’s point of view, there’s an opening to exploit that Nvidia created with its somewhat weaker GeForce GTX 960.
Benchmark Settings and Resolutions
The benchmarks are set to taxing detail presets, since that's what we expect someone who buys a graphics card in this price range to run. In order to demonstrate differences between the cards at progressively higher resolutions, we’re using Full HD (1920x1080) and QHD (2560x1440). AMD's new graphics card is specifically targeted toward the latter, it says.
Frame Rate and Frame Time
We completely updated how we represent frame time variance. In the end, percentages just don’t tell the whole story for longer benchmarks, which can have very different sections when it comes to rendering speed. We’ve settled on two ways of conveying the results. First, we show how long it takes to render each individual frame, telling you a lot more than bar graphs or an FPS graph based on averages. Second, we plot two different evaluations of each frame’s time.
Get Tom's Hardware's best news and in-depth reviews, straight to your inbox.
We start by normalizing each frame time by subtracting the average of the overall benchmark’s frame times. This puts the curves for each graphics card at a common average on the x-axis. This allows us to more easily spot outliers. After doing this, we assess the curve’s smoothness, which is to say that we’re looking at the relative differences in render time between the frames. This helps us to find subjectively annoying stuttering or jumps more easily without having the actual frame time influence the curve.
Power Consumption Measurement Methodology
Our power consumption testing methodology is described in The Math Behind GPU Power Consumption And PSUs. It's the only way we can achieve readings that facilitate sound conclusions about efficiency. We need two oscilloscopes in a master-slave setup to be able to record all eight channels at the same time (4 x voltage, 4 x current). Each PCIe power connector is measured separately.
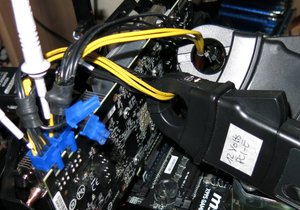
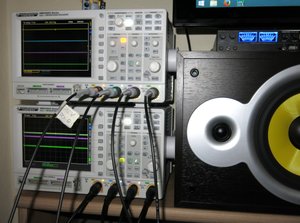
A riser card is used on the PCIe slot (PEG) to measure power consumption directly on the motherboard for the 3.3 and 12V rails. The riser card was built specifically for this purpose.
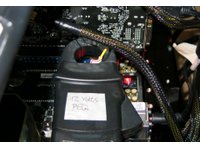
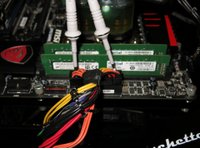
We are using time intervals of 1 ms for our analyses. The equipment cumulates the natively even more high resolution data for us so that we don't completely drown in the sheer amount of data that this system generates.
Infrared Measurement with the Optris PI640
We’ve identified a method to confirm what our sensors tell us and to spice up our usual temperature graphs a bit in the form of the PI640 by Optris. This piece of equipment is an infrared camera developed specifically for process monitoring. It allows us to shoot both videos and still shots at a good resolution, providing us with not just peak temperatures, but also a good view of any weak points in the graphics card's design.
Optris' PI640 supplies real-time thermal images at a rate of 32Hz. The pictures are sent via USB to a separate system, where they can be recorded as video. The PI640’s thermal sensitivity is 75mK, making it ideal for assessing small gradients.
Noise
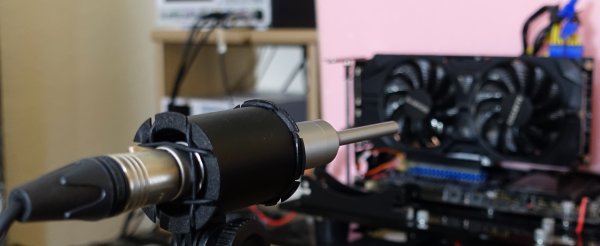
As always, we use a high-quality microphone placed perpendicular to the center of the graphics card at a distance of 50cm. The results are analyzed with Smaart 7.
The ambient noise when our readings were recorded at night never rose above 26 dB(A). This was noted and accounted for separately during each measurement. The setup was calibrated on a regular basis as well.

Igor Wallossek wrote a wide variety of hardware articles for Tom's Hardware, with a strong focus on technical analysis and in-depth reviews. His contributions have spanned a broad spectrum of PC components, including GPUs, CPUs, workstations, and PC builds. His insightful articles provide readers with detailed knowledge to make informed decisions in the ever-evolving tech landscape
-
ingtar33 so full tonga, release date 2015; matches full tahiti, release date 2011.Reply
so why did they retire tahiti 7970/280x for this? 3 generations of gpus with the same rough number scheme and same performance is sorta sad. -
Eggz Seems underwhelming until you read the price. Pretty good for only $230! It's not that much slower than the 970, but it's still about $60 cheaper. Well placed.Reply -
chaosmassive been waiting for this card review, I saw photographer fingers on silicon reflection btw !Reply -
Onus Once again, it appears that the relevance of a card is determined by its price (i.e. price/performance, not just performance). There are no bad cards, only bad prices. That it needs two 6-pin PCIe power connections rather than the 8-pin plus 6-pin needed by the HD7970 is, however, a step in the right direction.Reply
-
FormatC ReplyI saw photographer fingers on silicon
I know, this are my fingers and my wedding ring. :P
Call it a unique watermark. ;) -
psycher1 Honestly I'm getting a bit tired of people getting so over-enthusiastic about which resolutions their cards can handle. I barely think the 970 is good enough for 1080p.Reply
With my 2560*1080 (to be fair, 33% more pixels) panel and a 970, I can almost never pull off ultimate graphic settings out of modern games, with the Witcher 3 only averaging about 35fps while at medium-high according to GeForce Experience.
If this is already the case, give it a year or two. Future proofing does not mean you should need to consider sli after only 6 months and a minor display upgrade. -
Eggz Reply16976217 said:Honestly I'm getting a bit tired of people getting so over-enthusiastic about which resolutions their cards can handle. I barely think the 970 is good enough for 1080p.
With my 2560*1080 (to be fair, 33% more pixels) panel and a 970, I can almost never pull off ultimate graphic settings out of modern games, with the Witcher 3 only averaging about 35fps while at medium-high according to GeForce Experience.
If this is already the case, give it a year or two. Future proofing does not mean you should need to consider sli after only 6 months and a minor display upgrade.
Yeah, I definitely think that the 980 ti, Titan X, FuryX, and Fury Nano are the first cards that adequately exceed 1080p. No cards before those really allow the user to forget about graphics bottlenecks at a higher standard resolution. But even with those, 1440p is about the most you can do when your standards are that high. I consider my 780 ti almost perfect for 1080p, though it does bottleneck here and there in 1080p games. Using 4K without graphics bottlenecks is a lot further out than people realize.
-
ByteManiak everyone is playing GTA V and Witcher 3 in 4K at 30 fps and i'm just sitting here struggling to get a TNT2 to run Descent 3 at 60 fps in 800x600 on a Pentium 3 machineReply
