Video Quality Tested: GeForce Vs. Radeon In HQV 2.0
Test Class 1: Video Conversion
This video conversion test class focuses on the video processor’s ability to take different varieties of video and play them back as smoothly as possible. Ideally, jagged edges and artifacts will be eliminated, while proper color reproduction should remain intact.
Chapter 1: Video Resolution tests
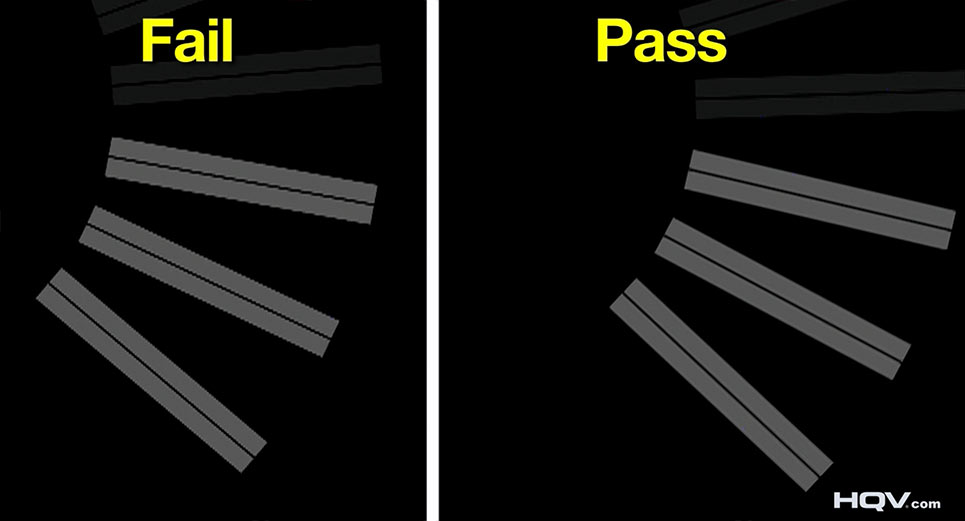
The first chapter of this class tests the hardware’s ability to display static and moving objects in the same interlaced scene with as little stepping (also referred to as “jaggies”) as possible. To achieve a good score, the video processor has to merge or interpolate between fields of video to create smooth edges where appropriate.
Test A: Dial
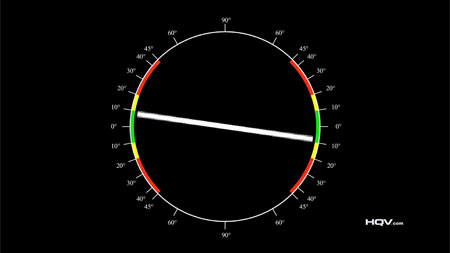
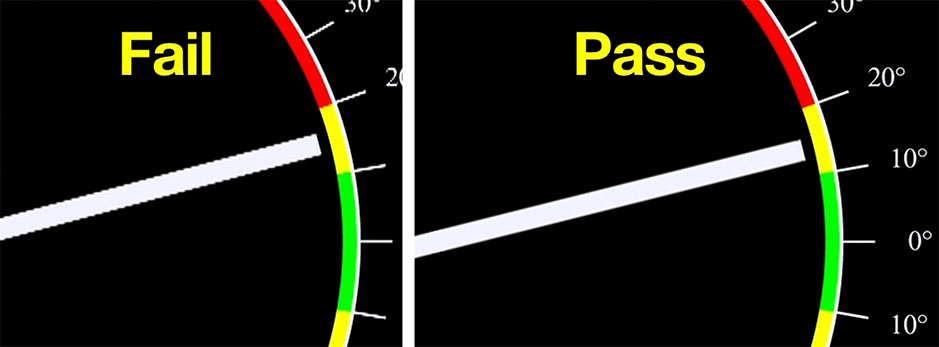
A straight line is rotated in the center of a circle. Interpolation becomes increasingly difficult at smaller angles, so an ideal score of five is achieved if the line appears smooth under 10 degrees from the horizon. Four points are awarded if jaggies are seen between 10 and 20 degrees, and two points if the jaggies disappear from 20 to 30 degrees. No points are given if the jaggies appear above 30 degrees.
This test can be difficult to judge, even though it should be entirely subjective. This is because the dial moves quickly and it’s hard to be 100% sure where the artifacting begins (if it starts close to 10 degrees).
| Dial Test Results (out of 5) | ||||
|---|---|---|---|---|
| Radeon HD 6850 | Radeon HD 5750 | Radeon HD 5670 | Radeon HD 5550 | Radeon HD 5450 |
| 5 | 5 | 5 | 4 | 4 |
| GeForce GTX 470 | GeForce GTX 460 | GeForce 9800 GT | GeForce GT 240 | GeForce GT 430 | GeForce 210 |
|---|---|---|---|---|---|
| 5 | 5 | 5 | 5 | 5 | 4 |
It’s important to note that some image quality enhancements can increase the result of some tests while lowering others. The dial test is an example of this. When the edge-enhancement feature is enabled, the jaggies can increase a little bit. This is why the GeForce 210 has a higher score than more expensive GeForce cards that have this feature enabled.
Get Tom's Hardware's best news and in-depth reviews, straight to your inbox.
Test B: Dial with Static Pattern
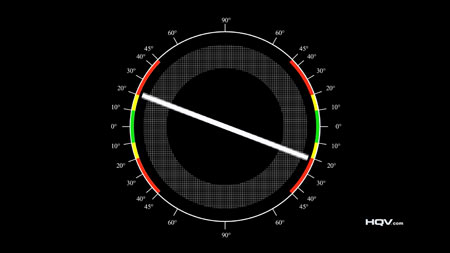
This test appears similar to the previous one, with the same line rotating within the circle. The focus here is different, however, and is on the grid. If the video processor breaks or warps the grid while the line moves through it, points will be lost. Note that a halo effect around the line is acceptable as long as the grid isn’t being warped or broken. A perfect score with no grid artifacts is five points. Some degradation of the grid or slight artifacts lowers it to two points, and a flickering or obviously degraded grid decreases the score to zero.
While this test is somewhat subjective (as far as the amount of degradation is concerned), all of the graphics cards we’re testing appear to leave the grid intact. There’s a small halo effect, but that doesn’t prevent all of the cards from getting full marks.
| Dial with Static Pattern Test Results (out of 5) | ||||
|---|---|---|---|---|
| Radeon HD 6850 | Radeon HD 5750 | Radeon HD 5670 | Radeon HD 5550 | Radeon HD 5450 |
| 5 | 5 | 5 | 5 | 5 |
| GeForce GTX 470 | GeForce GTX 460 | GeForce 9800 GT | GeForce GT 240 | GeForce GT 430 | GeForce 210 |
|---|---|---|---|---|---|
| 5 | 5 | 5 | 5 | 5 | 5 |
Test C: Gray Bars
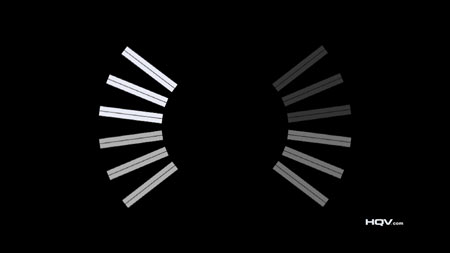
This test determines if the video processor’s de-interlacing capability performs consistently at all brightness levels. The focus here is not to see which bars have jaggies and which do not, but to see if all four shades of bars have the same de-interlacing without artifacting. Five points are awarded if all bars appear similar, three points if the darkest bars have artifacts, two points if the second darkest bars have artifacts, one point if the second-brightest bars have artifacts, and no points if all bars have artifacts.
The scoring criteria are objective, but the test relies on subjective observation. We can’t detect any differences between the levels of brightness on any test card, so we give all cards the full five points in this test.
| Grey Bars Test Results (out of 5) | ||||
|---|---|---|---|---|
| Radeon HD 6850 | Radeon HD 5750 | Radeon HD 5670 | Radeon HD 5550 | Radeon HD 5450 |
| 5 | 5 | 5 | 5 | 5 |
| GeForce GTX 470 | GeForce GTX 460 | GeForce 9800 GT | GeForce GT 240 | GeForce GT 430 | GeForce 210 |
|---|---|---|---|---|---|
| 5 | 5 | 5 | 5 | 5 | 5 |
Test D: Violin
This test simply appears to be some footage of a violin player. The violin strings are at low angles to the horizon and move around as the instrument is played. The full five points are awarded if the moving strings show no motion artifacts. The score is lowered to three points for small artifacts during motion transitions and zero points are awarded if there are notable artifacts during most of the video sequence.
Whether or not there are any artifacts should be fairly objective, but the amount of artifacting is subjective. All of the cards we tested achieved five points, according to our observations.
| Violin Test Results (out of 5) | ||||
|---|---|---|---|---|
| Radeon HD 6850 | Radeon HD 5750 | Radeon HD 5670 | Radeon HD 5550 | Radeon HD 5450 |
| 5 | 5 | 5 | 5 | 5 |
| GeForce GTX 470 | GeForce GTX 460 | GeForce 9800 GT | GeForce GT 240 | GeForce GT 430 | GeForce 210 |
|---|---|---|---|---|---|
| 5 | 5 | 5 | 5 | 5 | 5 |
Current page: Test Class 1: Video Conversion
Prev Page Test Setup And Benchmarks Next Page Test Class 1: Video Conversion, Cont’d.Don Woligroski was a former senior hardware editor for Tom's Hardware. He has covered a wide range of PC hardware topics, including CPUs, GPUs, system building, and emerging technologies.
-
jimmysmitty I second the test using SB HD graphics. It might be just an IGP but I would like to see the quality in case I want to make a HTPC and since SB has amazing encoding/decoding results compared to anything else out there (even $500+ GPUs) it would be nice to see if it can give decent picture quality.Reply
But as for the results, I am not that suprised. Even when their GPUs might not perform the same as nVidia, ATI has always had great image quality enhancements, even before CCC. Thats an area of focus that nVidia might not see as important when it is. I want my Blu-Ray and DVDs to look great, not just ok. -
compton Great article. I had wondered what the testing criteria was about, and Lo! Tom's to the rescue. I have 4 primary devices that I use to watch Netflix's streaming service. Each is radically different in terms of hardware. They all look pretty good. But they all work differently. Using my 47" LG LED TV I did an informal comparison of each.Reply
My desktop, which uses a 460 really suffers from the lack of noise reduction options.
My Samsung BD player looks less spectacular that the others.
My Xbox looks a little better than the BD player.
My PS3 actually looks the best to me, no matter what display I use.
I'm not sure why, but it's the only one I could pick out just based on it's image quality. Netflix streaming is basically all I use my PS3 for. Compared to it, my desktop looks good and has several options to tweak but doesn't come close. I don't know how the PS3 stacks up, but I'm thinking about giving the test suite a spin.
Thanks for the awesome article. -
cleeve Reply9508697 said:Could you give the same evaluation to Sandy Bridge's Intel HD Graphics?.
That's Definitely on our to-do list!
Trying to organize that one now.
-
lucuis Too bad this stuff usually makes things look worse. I tried out the full array of settings on my GTX 470 in multiple BD Rips of varying quality, most very good.Reply
Noise reduction did next to nothing. And in many cases causes blockiness.
Dynamic Contrast in many cases does make things look better, but in some it revealed tons of noise in the greyscale which the noise reduction doesn't remove...not even a little.
Color correction seemed to make anything blueish bluer, even purples.
Edge correction seems to sharpen some details, but introduces noise after about 20%.
All in all, bunch of worthless settings. -
killerclick jimmysmittyEven when their GPUs might not perform the same as nVidia, ATI has always had great image quality enhancementsReply
ATI/AMD is demolishing nVidia in all price segments on performance and power efficiency... and image quality.
-
alidan killerclickATI/AMD is demolishing nVidia in all price segments on performance and power efficiency... and image quality.Reply
i thought they were loosing, not by enough to call it a loss, but not as good and the latest nvidia refreshes. but i got a 5770 due to its power consumption, i didn't have to swap out my psu to put it in and that was the deciding factor for me. -
haplo602 this made me lol ...Reply
1. cadence tests ... why do you marginalise the 2:2 cadence ? these cards are not US exclusive. The rest of the world has the same requirements for picture quality.
2. skin tone correction: I see this as an error on the part of the card to even include this. why are you correcting something that the video creator wanted to be as it is ? I mean the movie is checked by video profesionals for anything they don't want there. not completely correct skin tones are part of the product by design. this test should not even exist.
3. dynamic contrast: cannot help it, but the example scene with the cats had blown higlights on my laptopt LCD in the "correct" part. how can you judge that if the constraint is the display device and not the GPU itself ? after all you can output on a 6-bit LCD or on a 10-bit LCD. the card does not have to know that ... -
mitch074 "obscure" cadence detection? Oh, of course... Nevermind that a few countries do use PAL and its 50Hz cadence on movies, and that it's frustrating to those few people who watch movies outside of the Pacific zone... As in, Europe, Africa, and parts of Asia up to and including mainland China.Reply
It's only worth more than half the world population, after all. -
cleeve mitch074"obscure" cadence detection? Oh, of course... Nevermind that a few countries do use PAL and its 50Hz cadence on movies...Reply
You misunderstand the text, I think.
To clear it up: I wasn't talking about 2:2 when I said that, I was talking about the Multi-Cadence Tests: 8 FPS animation, etc.
