Why you can trust Tom's Hardware
Comparison Products
We tossed the Team Group Cardea Ceramic C440 up against some of the best SSDs in the market, including a near-identical (at least under the hood) Seagate FireCuda 520. As the only SSD available with 2-bit MLC V-NAND, we included the Samsung 970 Pro as well as the company’s TLC NAND based 970 EVO Plus. We also added in WD’s Black SN750 and Blue SN550 along with SK hynix’s Gold P31, Adata’s SX8200 Pro, Crucial’s P5, and MX500.
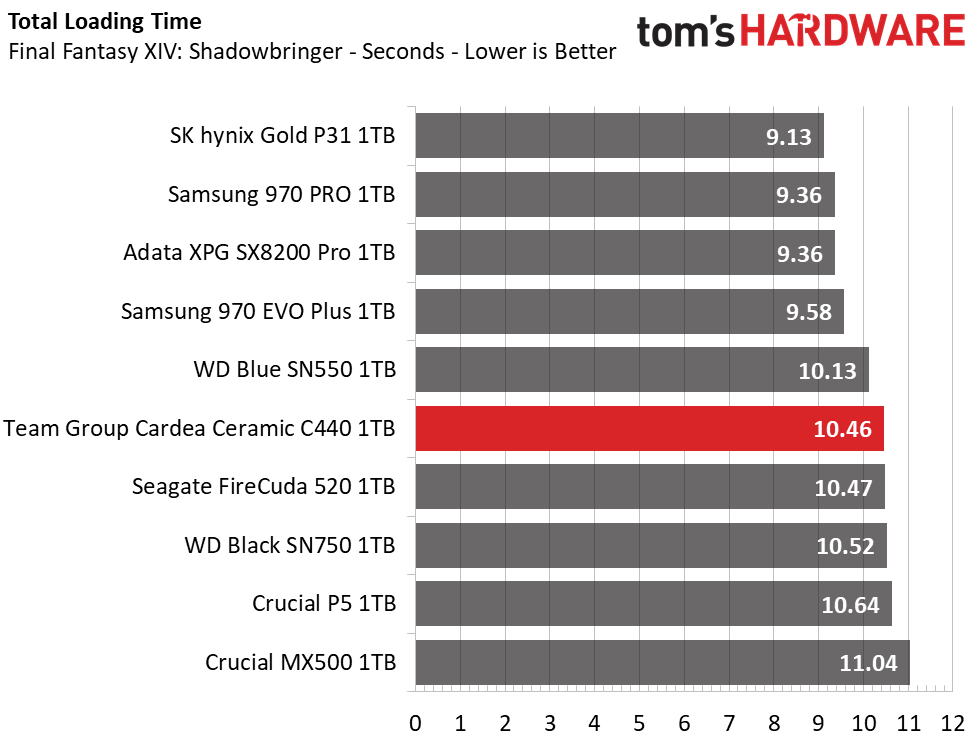
Game Scene Loading - Final Fantasy XIV
Final Fantasy XIV Stormbringer free real-world game benchmark that easily and accurately compares game load times without the inaccuracy of using a stopwatch.
As we have seen in the past, massive sequential performance doesn’t always equate to faster game load times; the SSD’s latency profile matters too. With faster 4K random performance, the SK hynix Gold P31, Samsung SSDs, and Adata SX8200 Pro take top ranks with sub-10-second total load times. Team Groups C440 holds up well though, loading up each game level fairly quickly, outperforming the WD Black SN750 and Crucial SSDs.
Transfer Rates – DiskBench
We use the DiskBench storage benchmarking tool to test file transfer performance with our own custom blocks of data. Our 50GB data set includes 31,227 files of various types, like pictures, PDFs, and videos. Our 100GB includes 22,579 files with 50GB of them being large movies. We copy the data sets to new folders and then follow-up with a reading test of a newly written 6.5GB zip file and 15GB movie file.
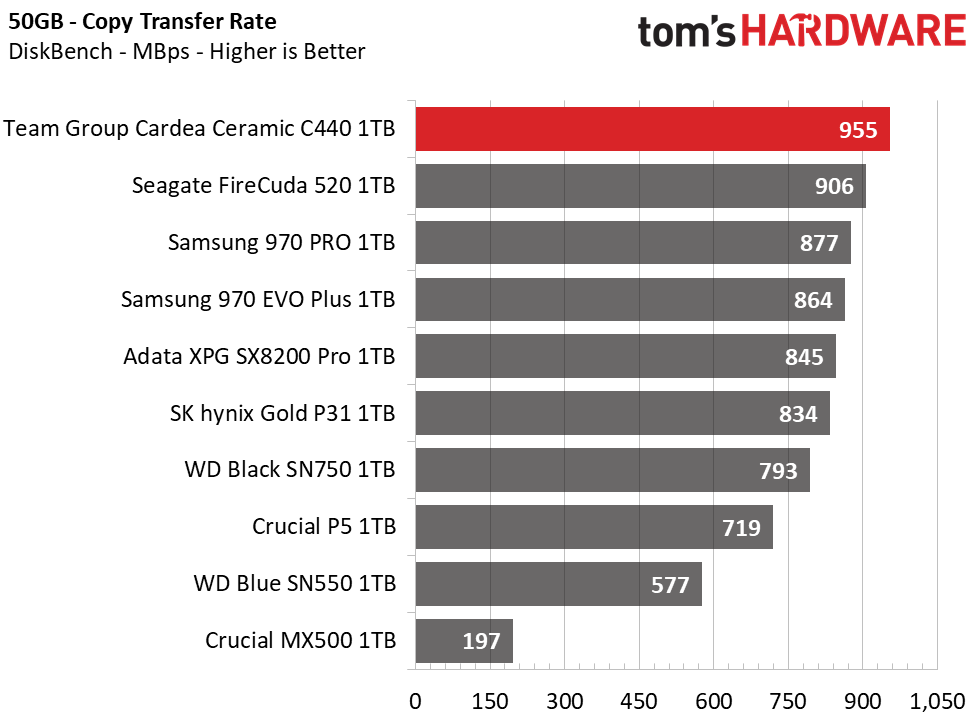
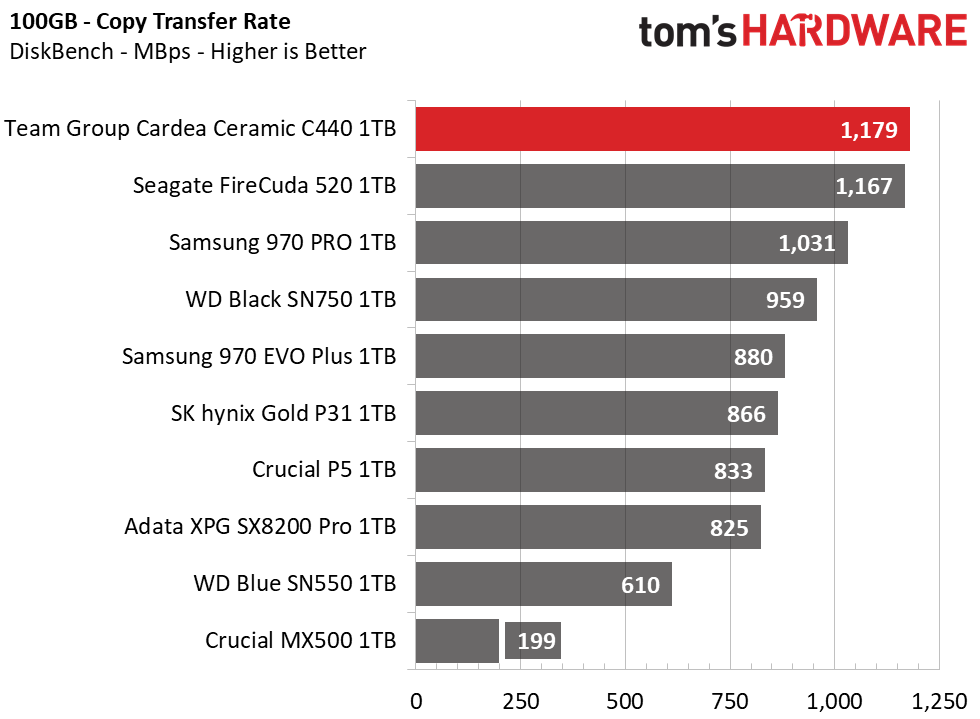
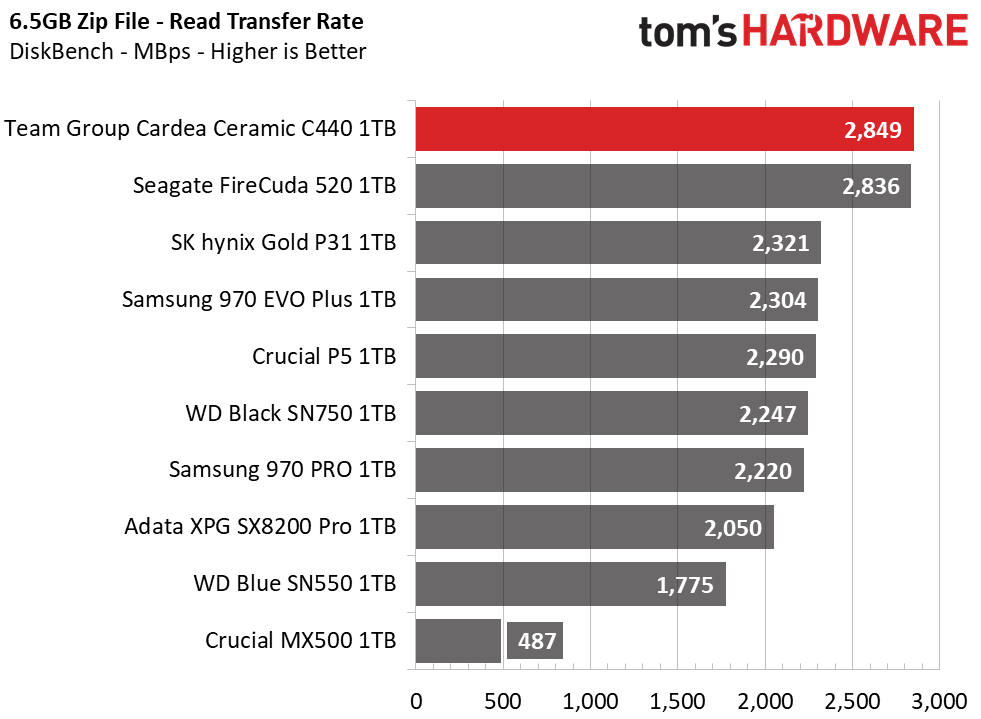
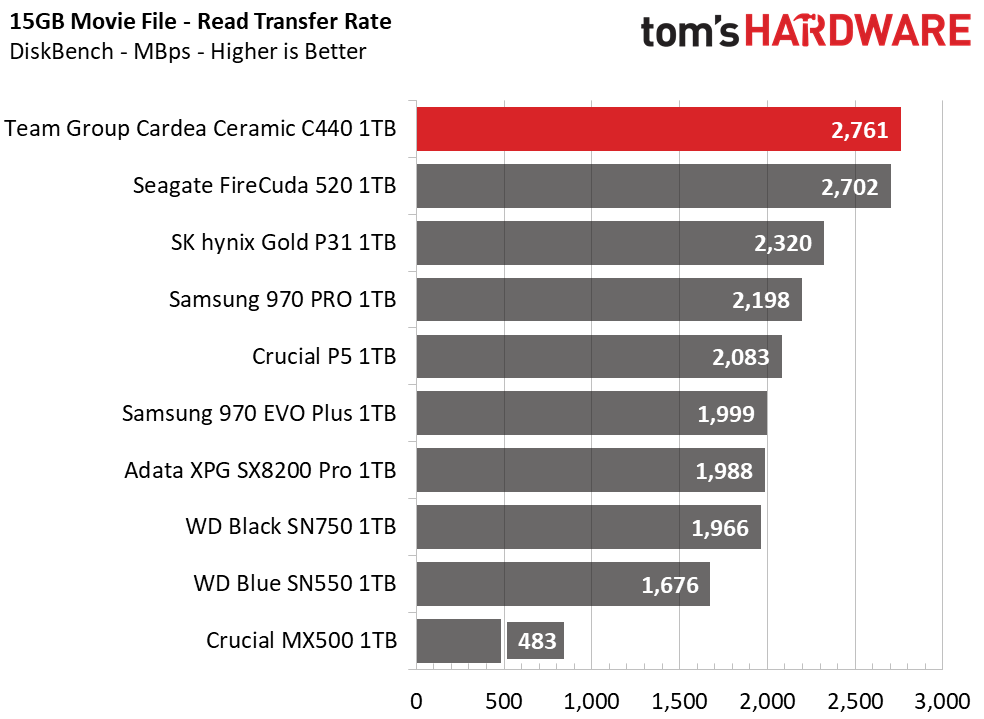
With a large dynamic SLC cache and a fast PCIe Gen4 interface, Team Group’s C440 delivers top file transfer performance, while Samsung’s offerings lag the Phison-based SSD by quite a bit. The Team Group C440 even outpaced Seagate’s FireCuda 520 by a few MBps on average and couldn’t be touched in the read tests.
Trace Testing – PCMark 10 Storage Tests
PCMark 10 is a trace-based benchmark that uses a wide-ranging set of real-world traces from popular applications and common tasks to measure the performance of storage devices. The quick benchmark is more relatable to those who use their PCs for leisure or basic office work, while the full benchmark relates more to power users.
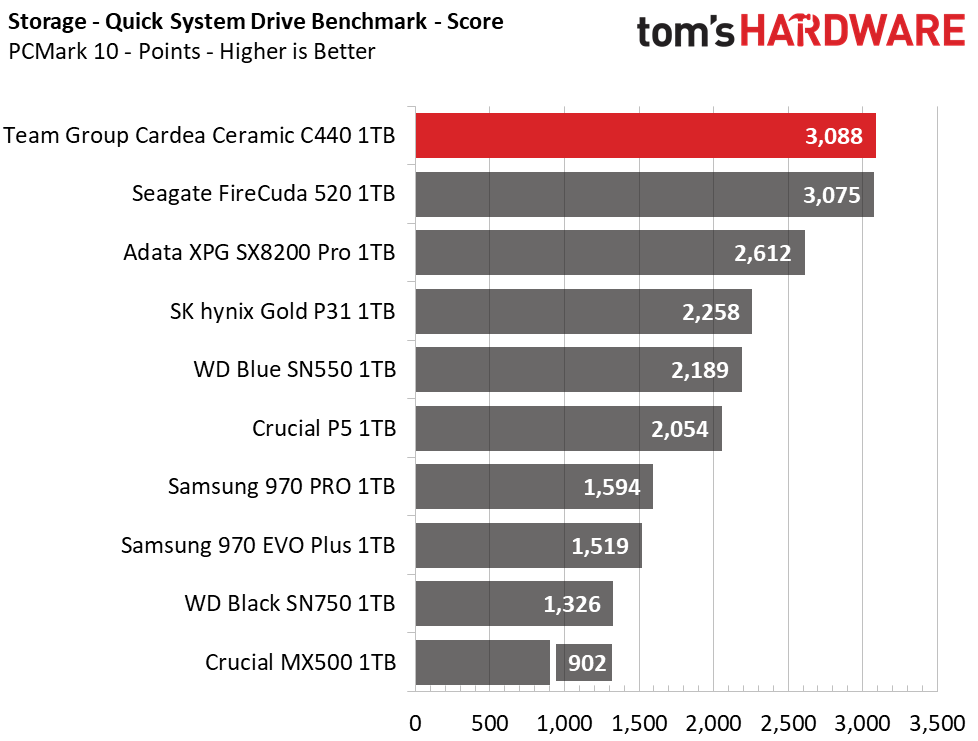
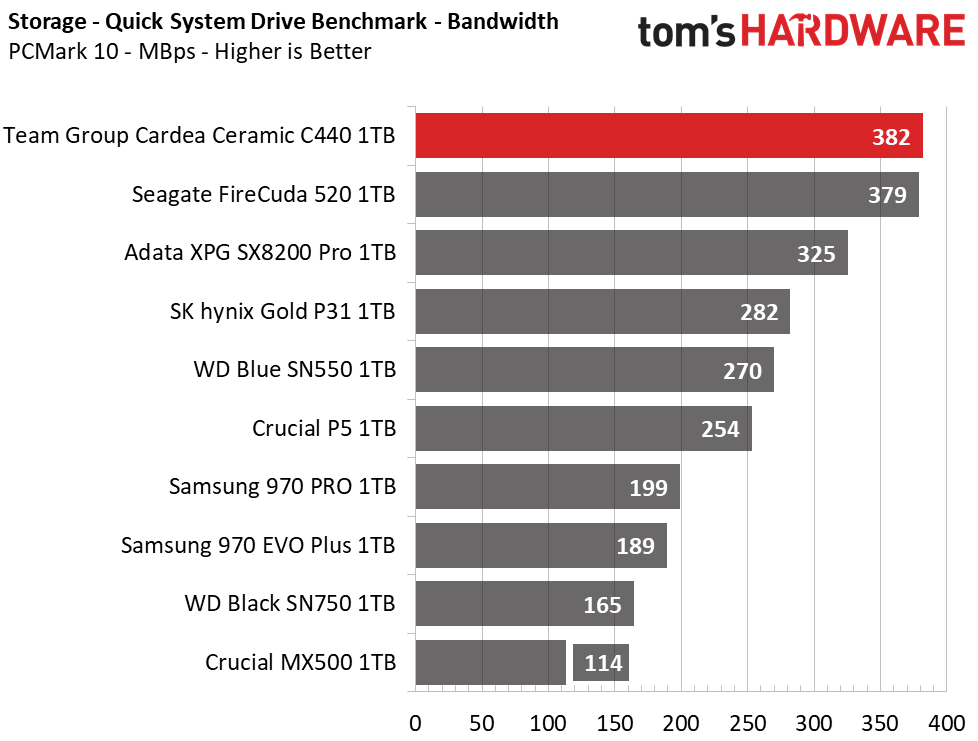
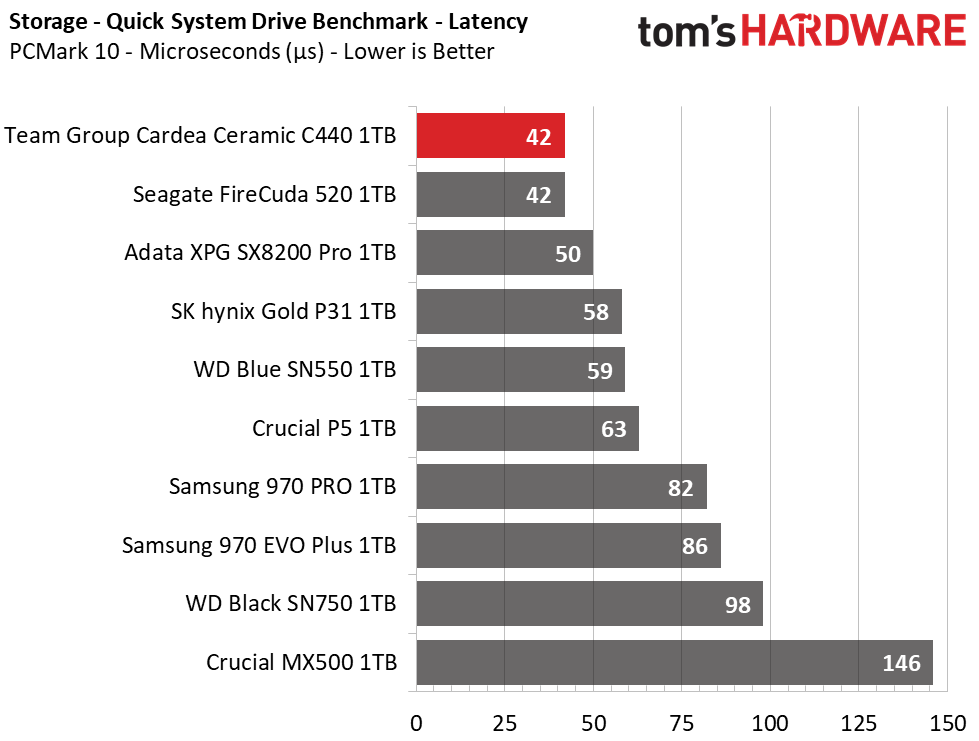
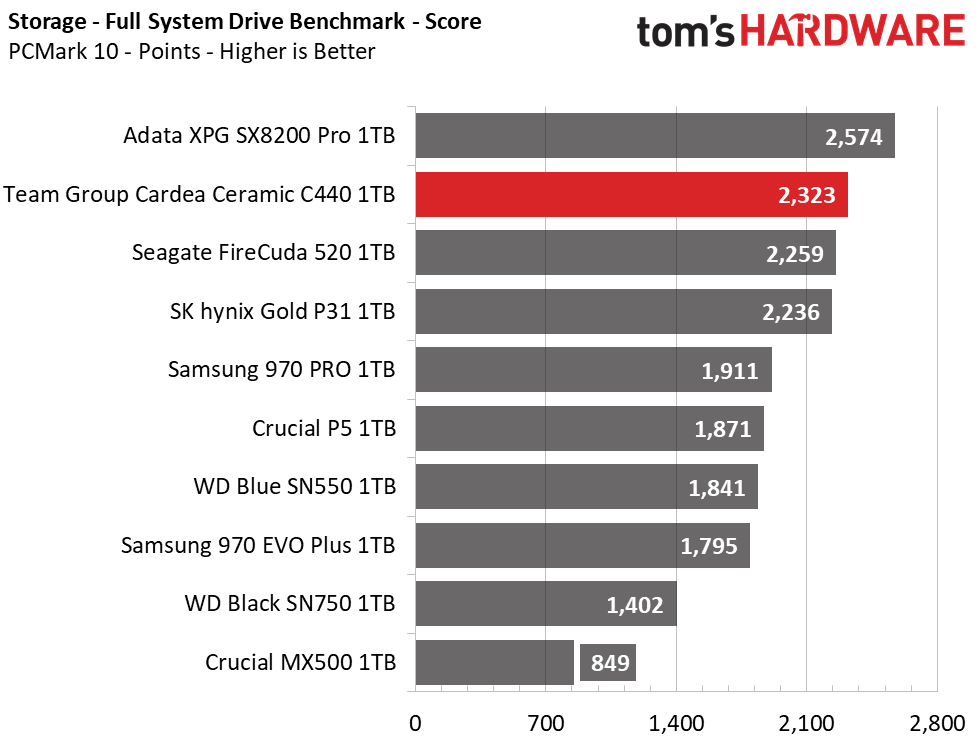
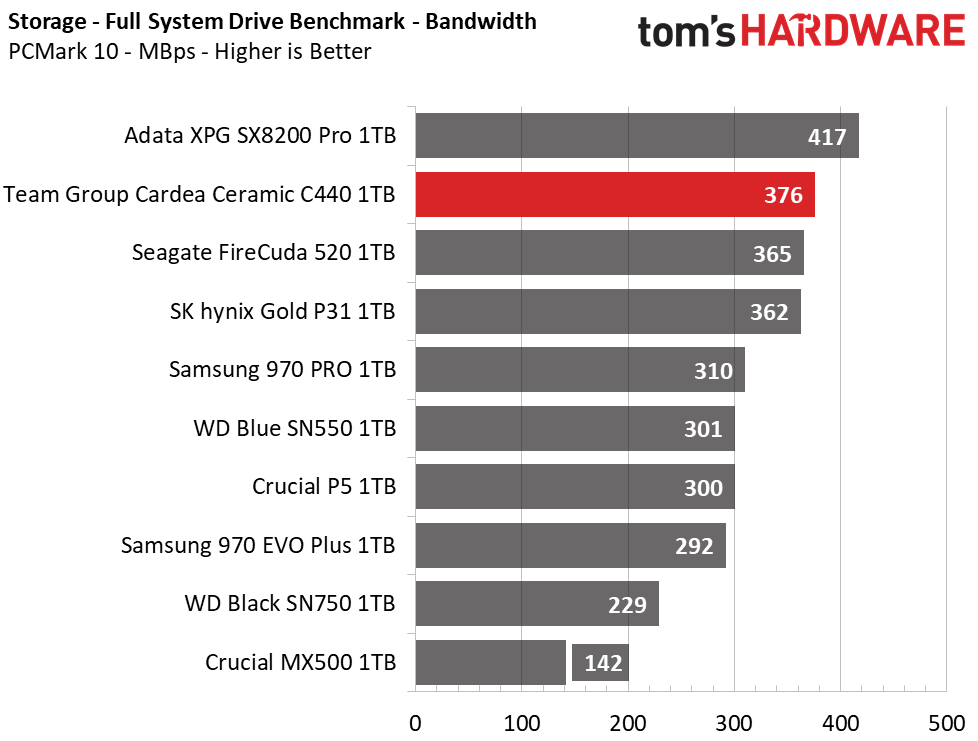
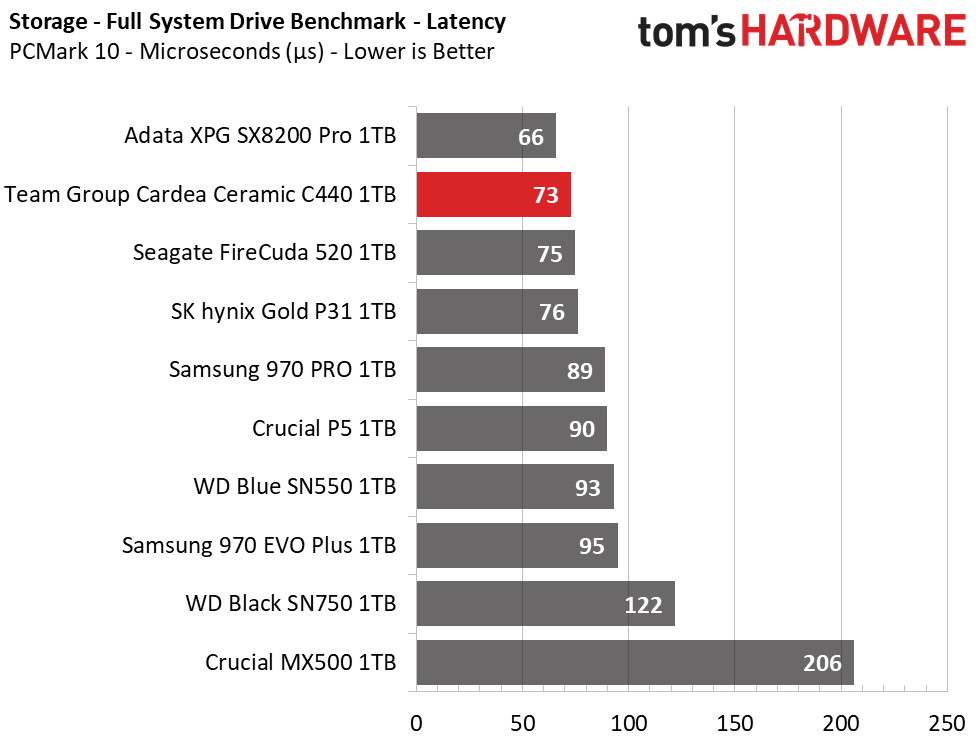
In PCMark 10’s quick benchmark, Team Group’s C440 hands the competition a spanking, topping the performance of all other competitors. However, when hit with the Full System Benchmark, it’s performance lagged behind the Adata SX8200 Pro. Still, iThe C440 easily took the lead over Samsung’s 970 series once again, as well as SK hynix’s Gold P31.
Get Tom's Hardware's best news and in-depth reviews, straight to your inbox.
Trace Testing – SPECworkstation 3
Like PCMark 10, SPECworkstation 3 is a trace-based benchmark, but it is designed to push the system harder by measuring workstation performance in professional applications.
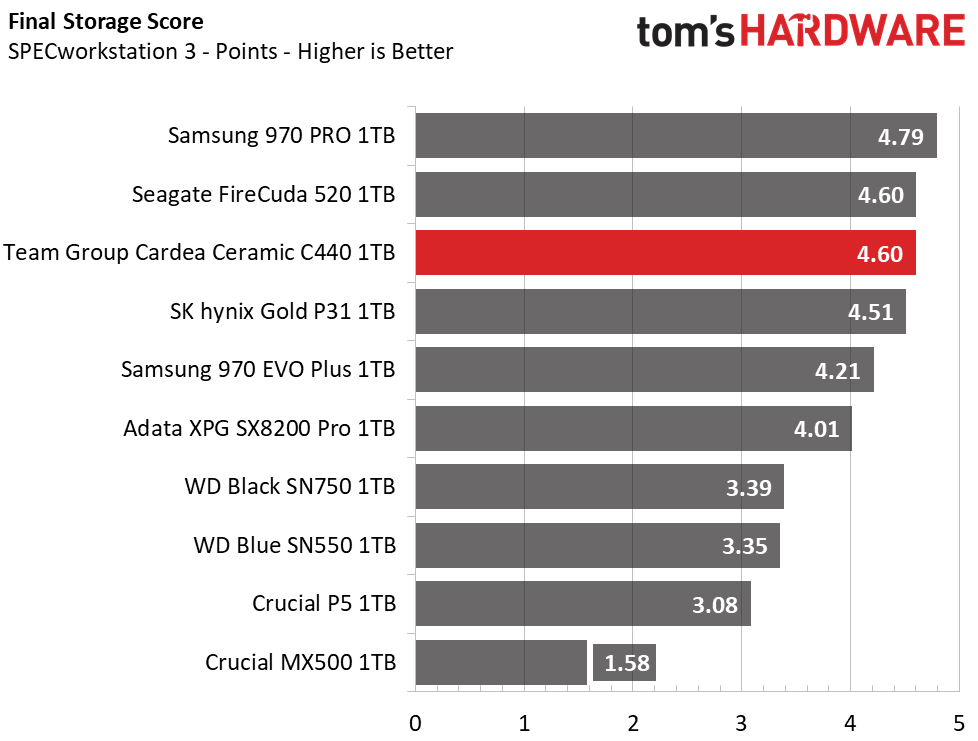
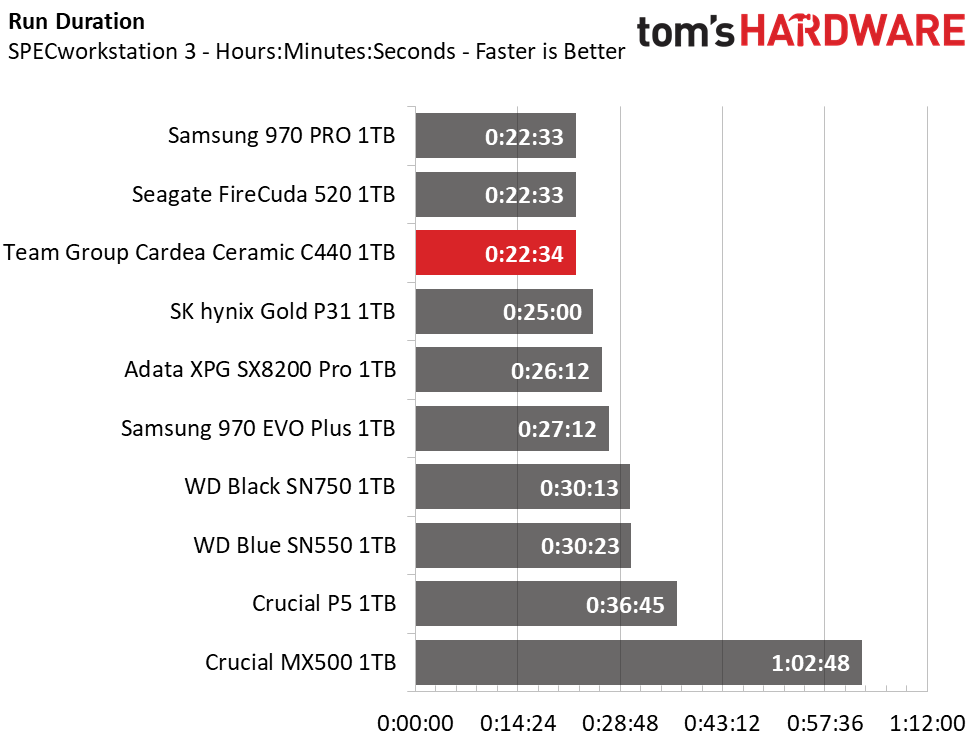
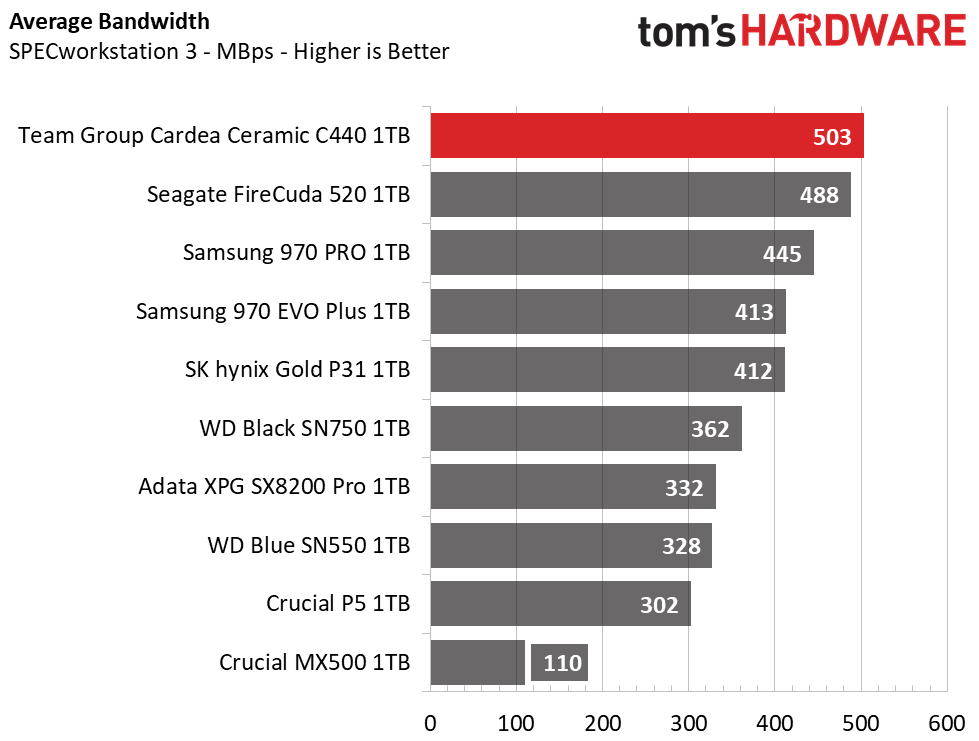
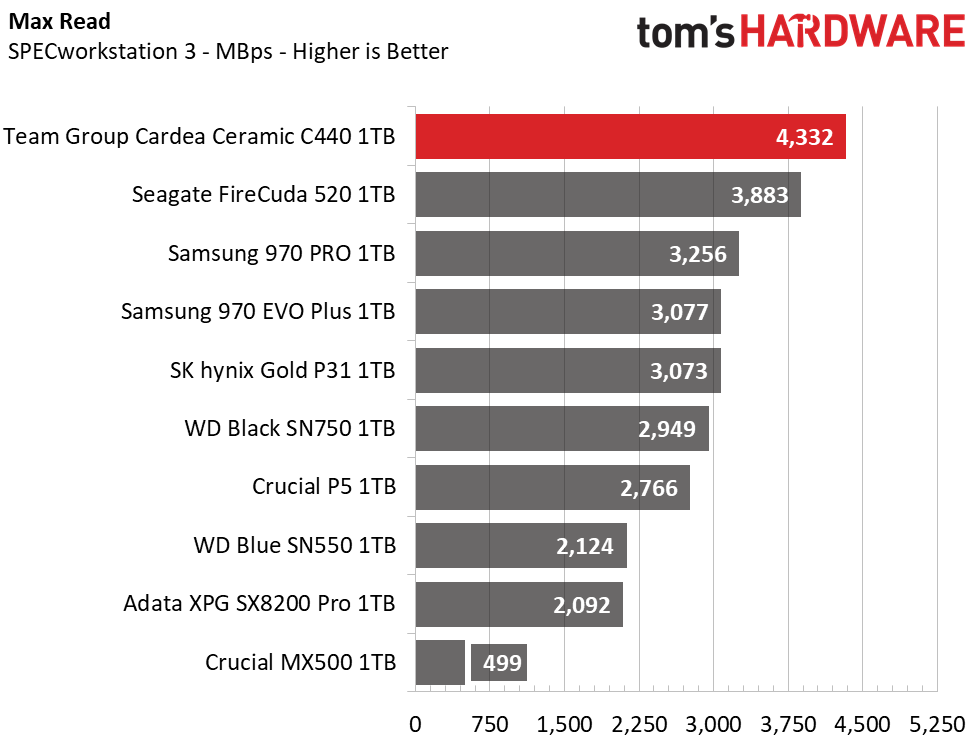
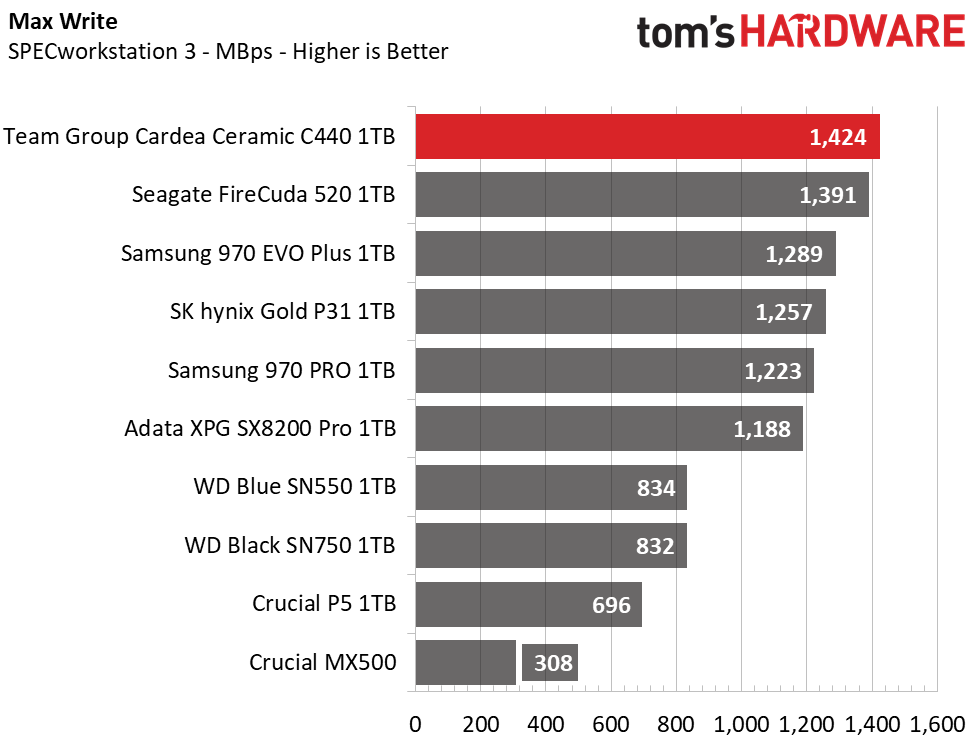
While the Team Group C440 can deliver some incredible burst performance and scores very well across the board, overall workstation performance falls in favor of the Samsung 970 PRO. This is mainly due to the 970 PRO’s very high and consistent write performance that stems from the MLC V-NAND while the TLC-based SSDs all degrade in performance once their SLC caches fill.
Synthetic Testing - ATTO / iometer
iometer is an advanced and highly configurable storage benchmarking tool while ATTO is a simple and free application that SSD vendors commonly use to assign sequential performance specifications to their products. Both of these tools give us insight into how the device handles different file sizes.
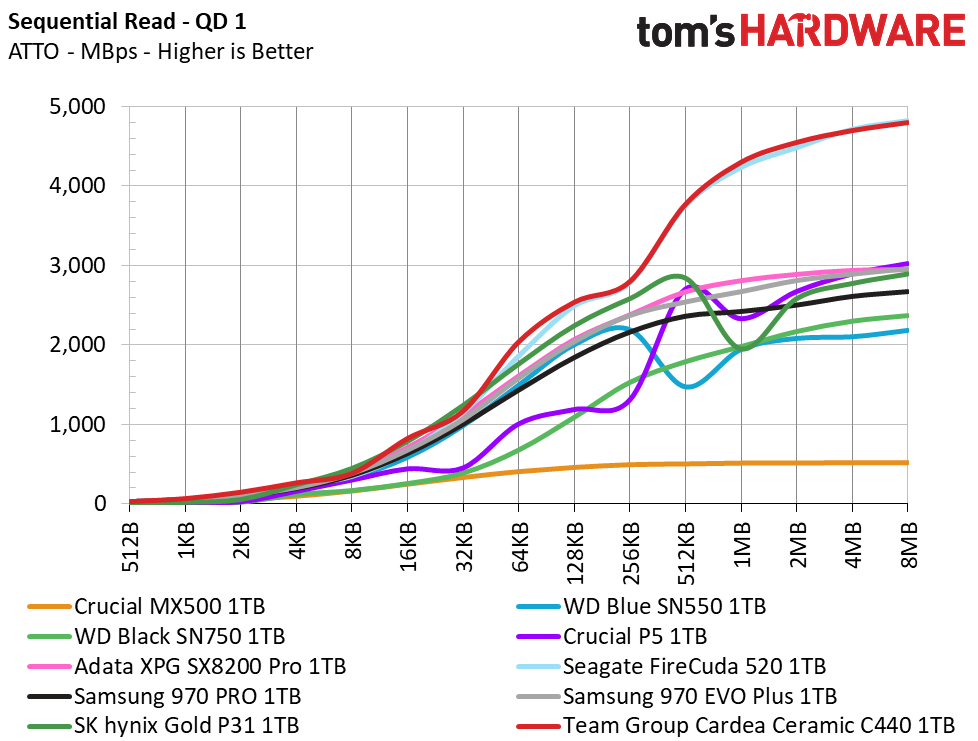
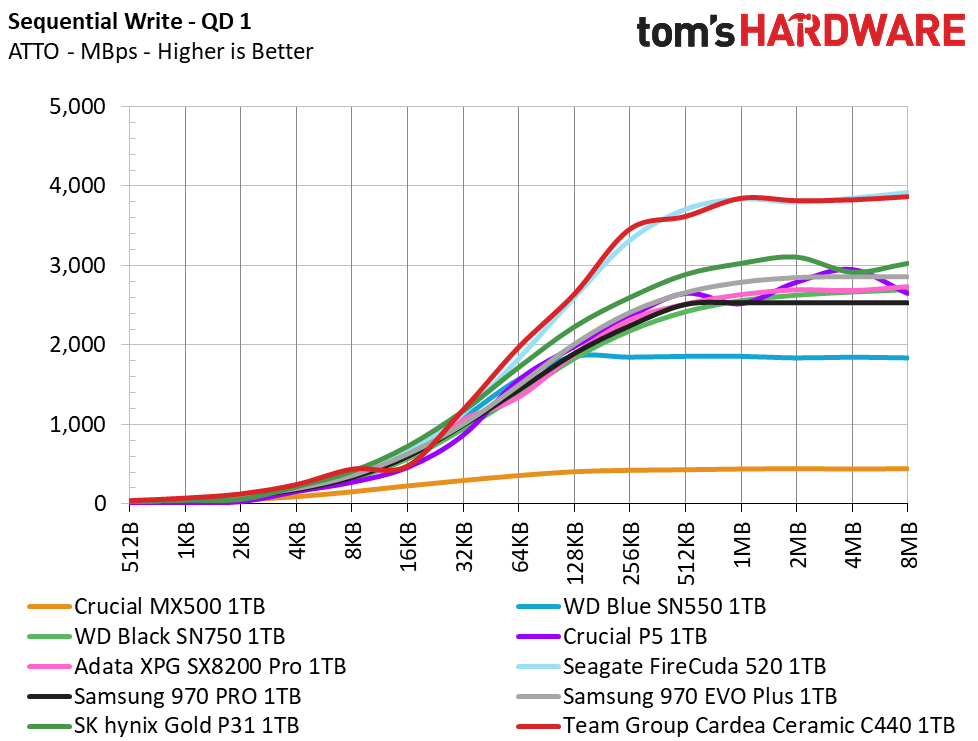
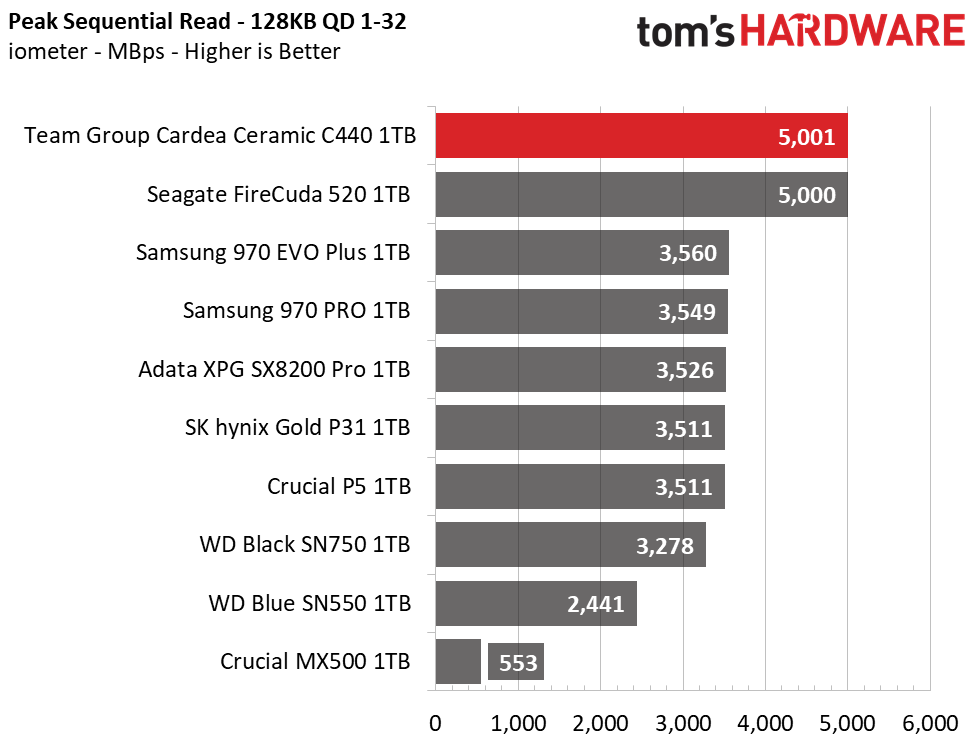
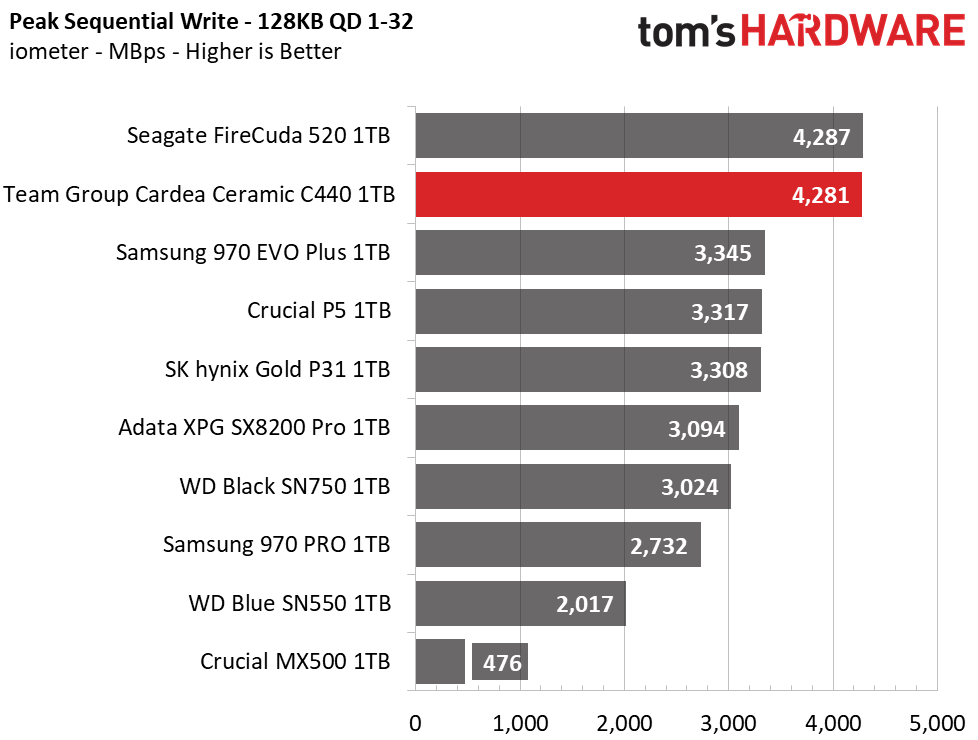
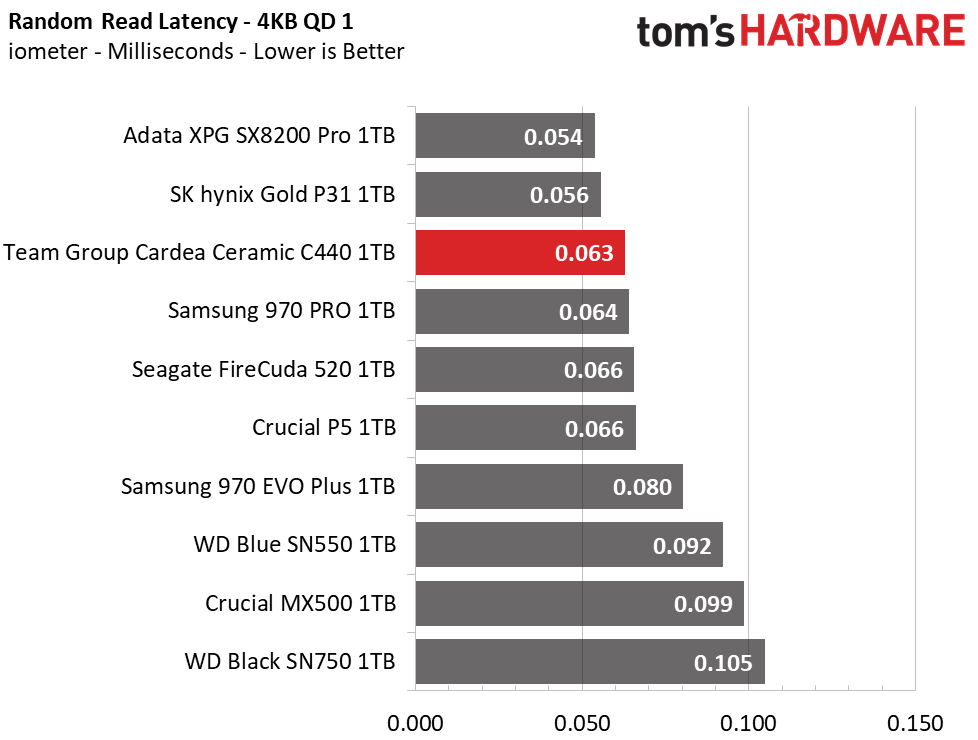
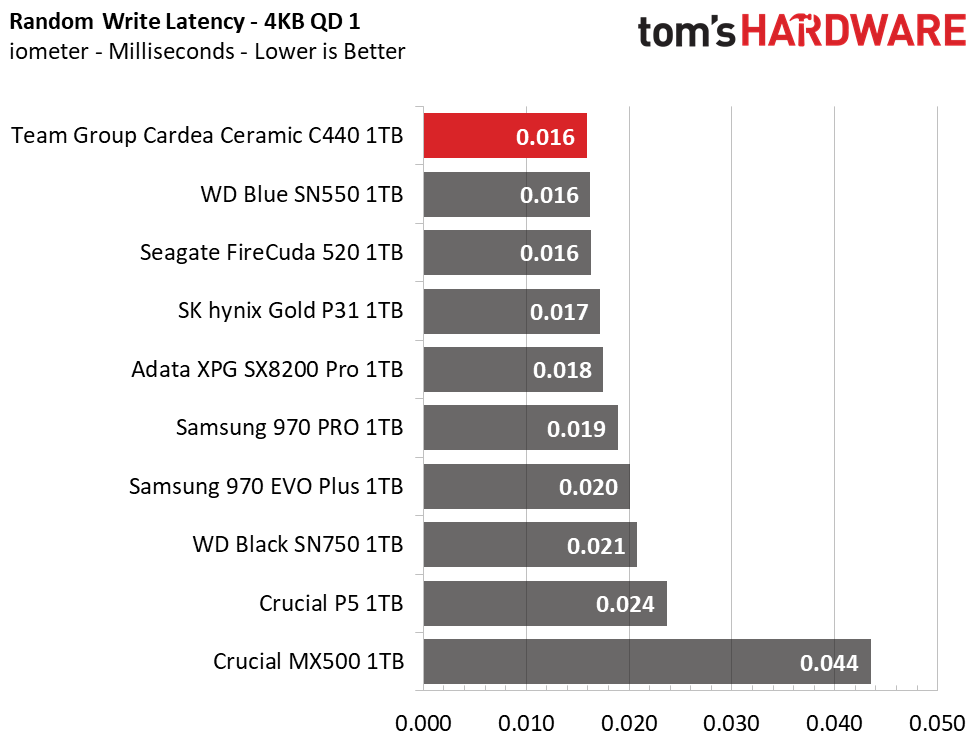
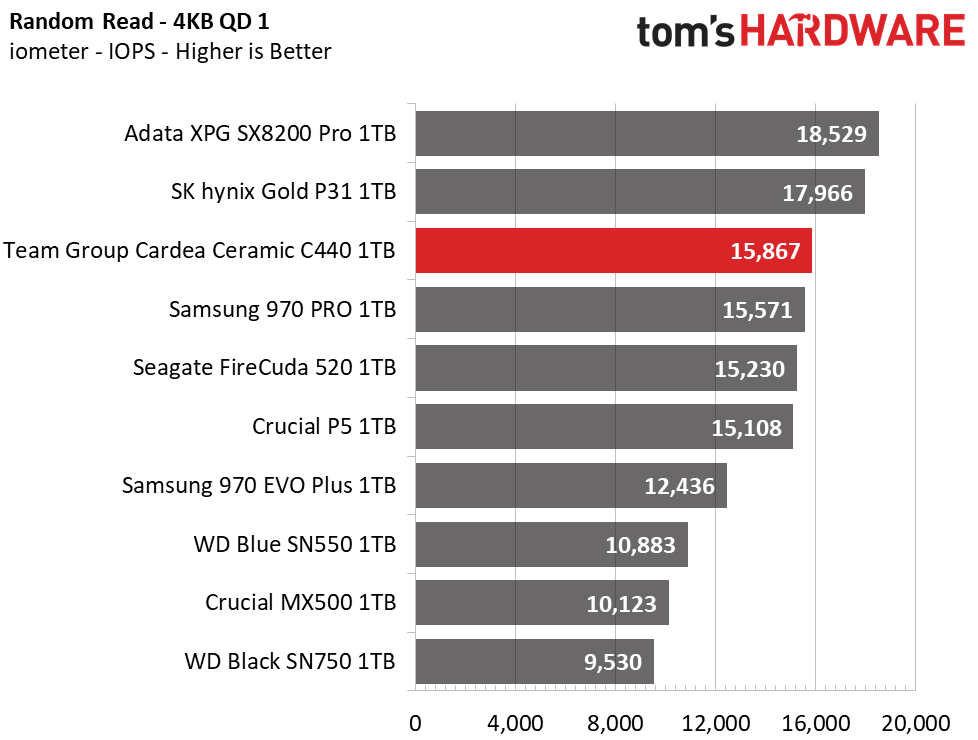
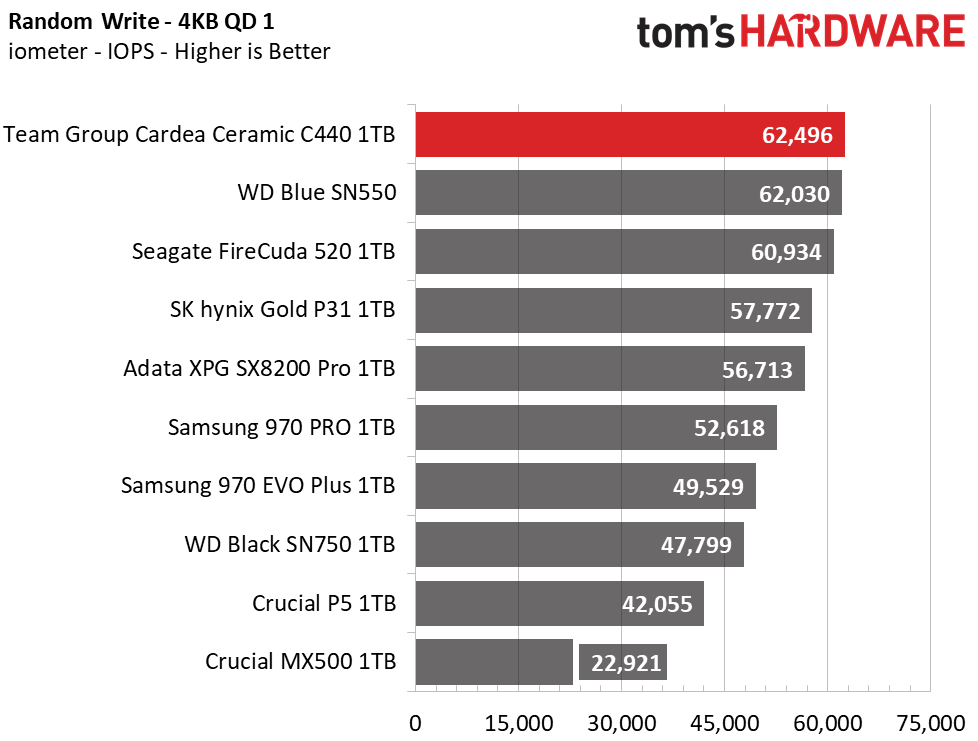
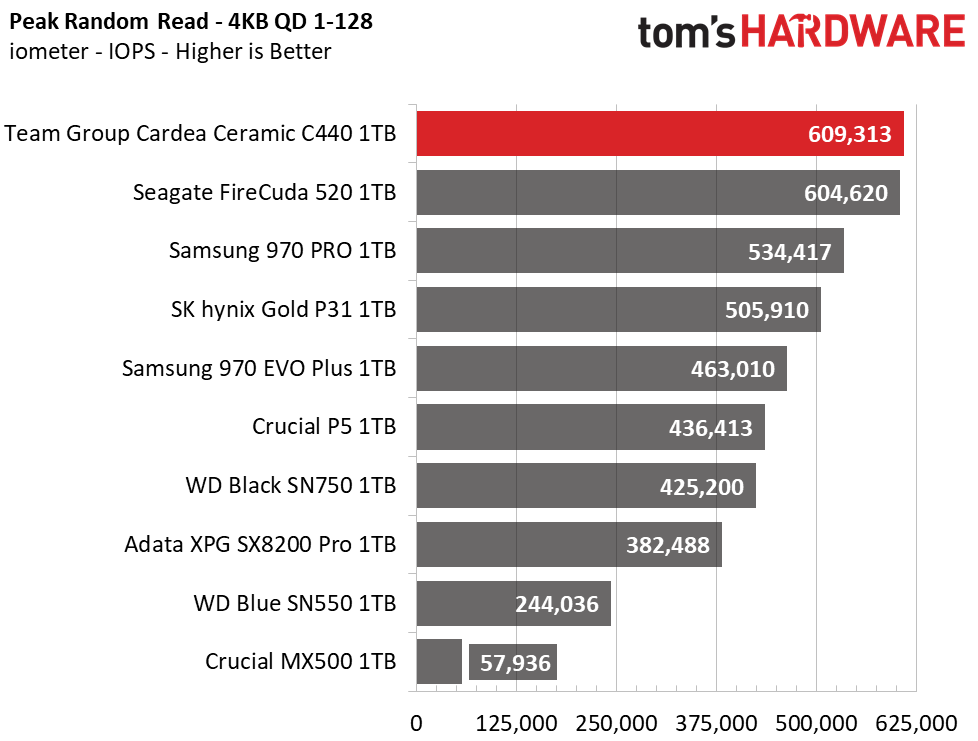
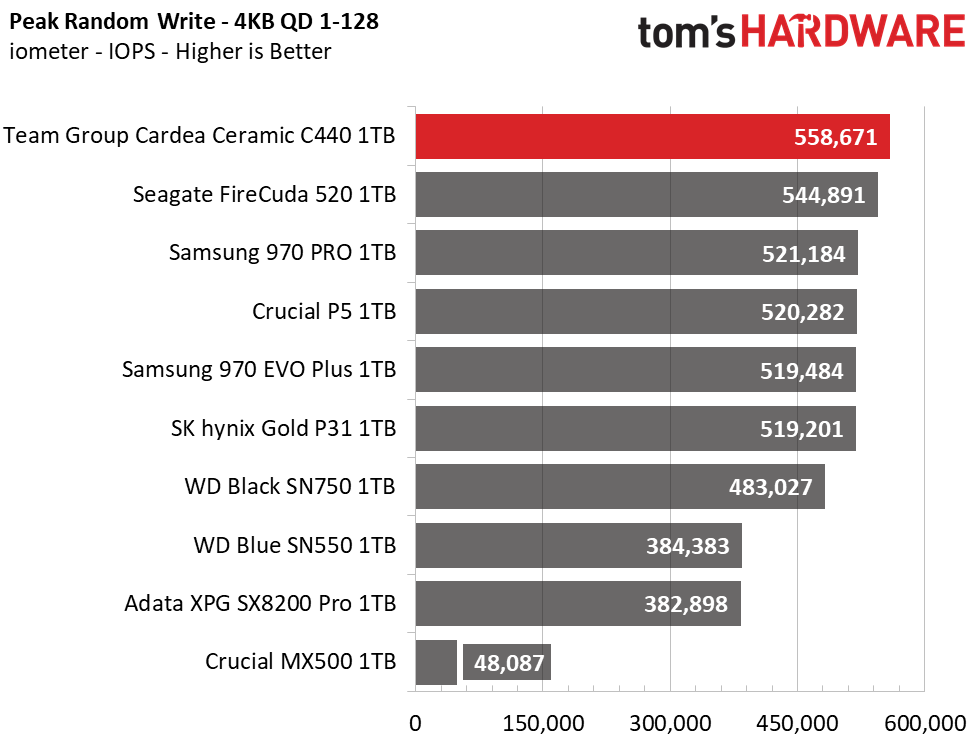
In ATTO, we tested Team Group’s T-Force Cardea Ceramic C440 at a QD of 1, representing most day-to-day file access at various block sizes. With the ability to deliver near 5/4 GBps read/write at a QD of 1, and 5/4.3 at a QD of 2, sequential performance does not disappoint. The C440 leaves the Gen3 SSDs in the dust. But, in terms of random performance, it is not quite the fastest SSD going. Both Adata’s XPG SX8200 Pro and SK hynix’s Gold P31 respond to random read requests a bit faster, which helps them most in the application tests.
Sustained Write Performance and Cache Recovery
Official write specifications are only part of the performance picture. Most SSDs implement a write cache, which is a fast area of (usually) pseudo-SLC programmed flash that absorbs incoming data. Sustained write speeds can suffer tremendously once the workload spills outside of the cache and into the "native" TLC or QLC flash. We use iometer to hammer the SSD with sequential writes for 15 minutes to measure both the size of the write cache and performance after the cache is saturated. We also monitor cache recovery via multiple idle rounds.
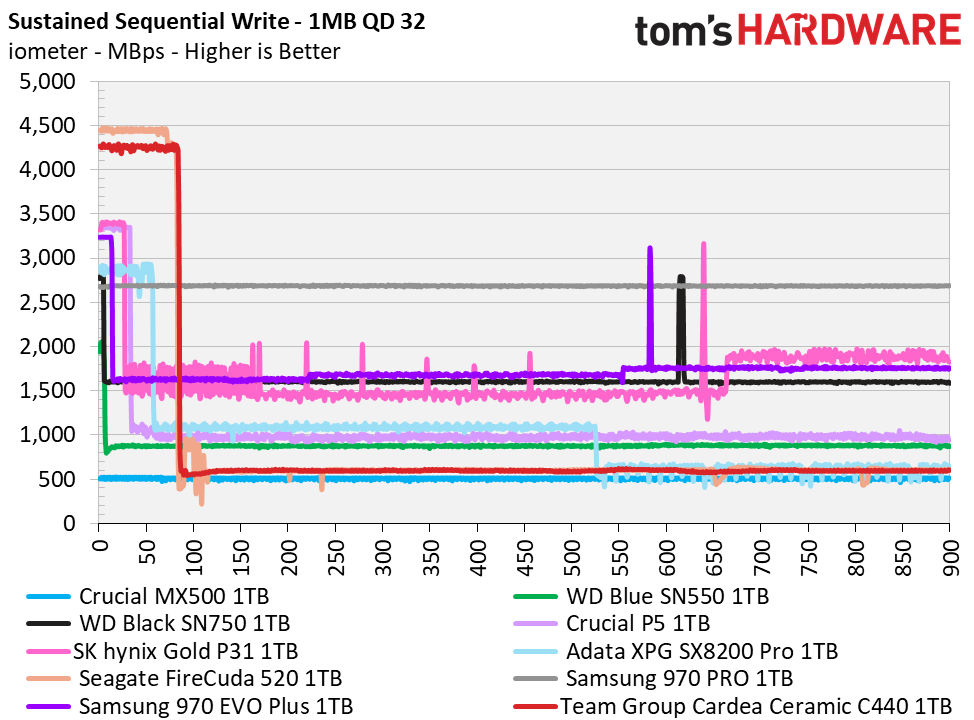
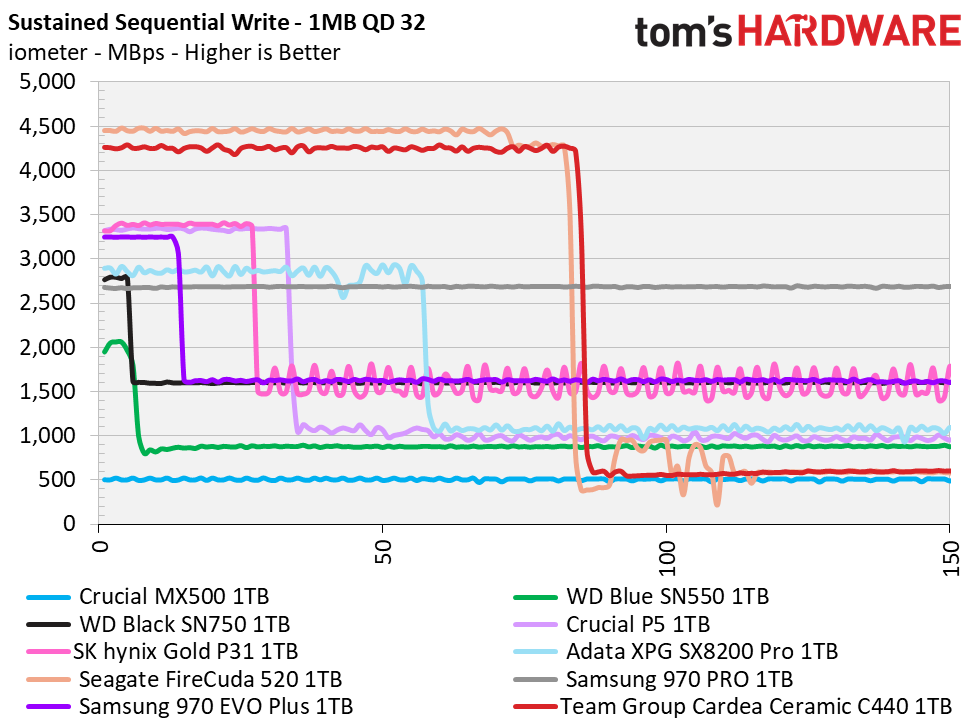
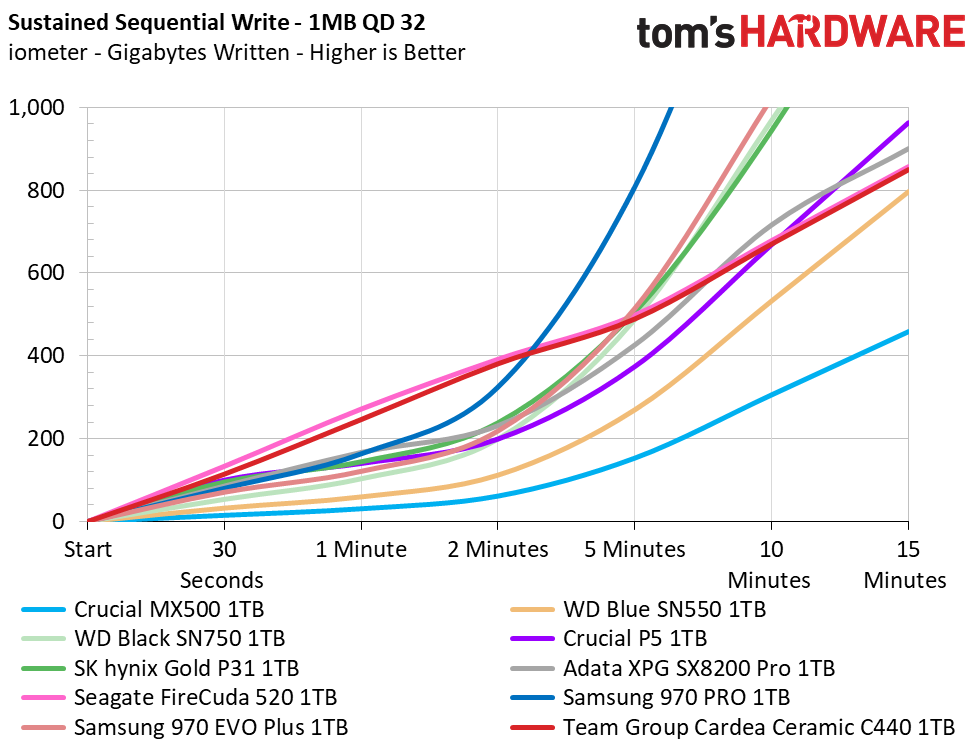
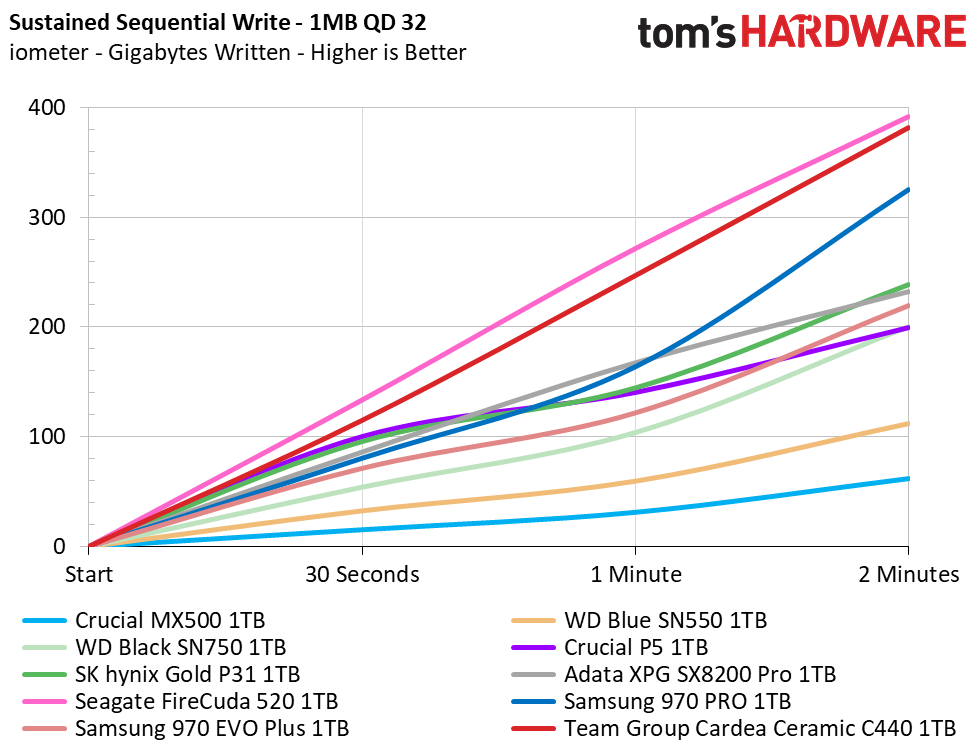
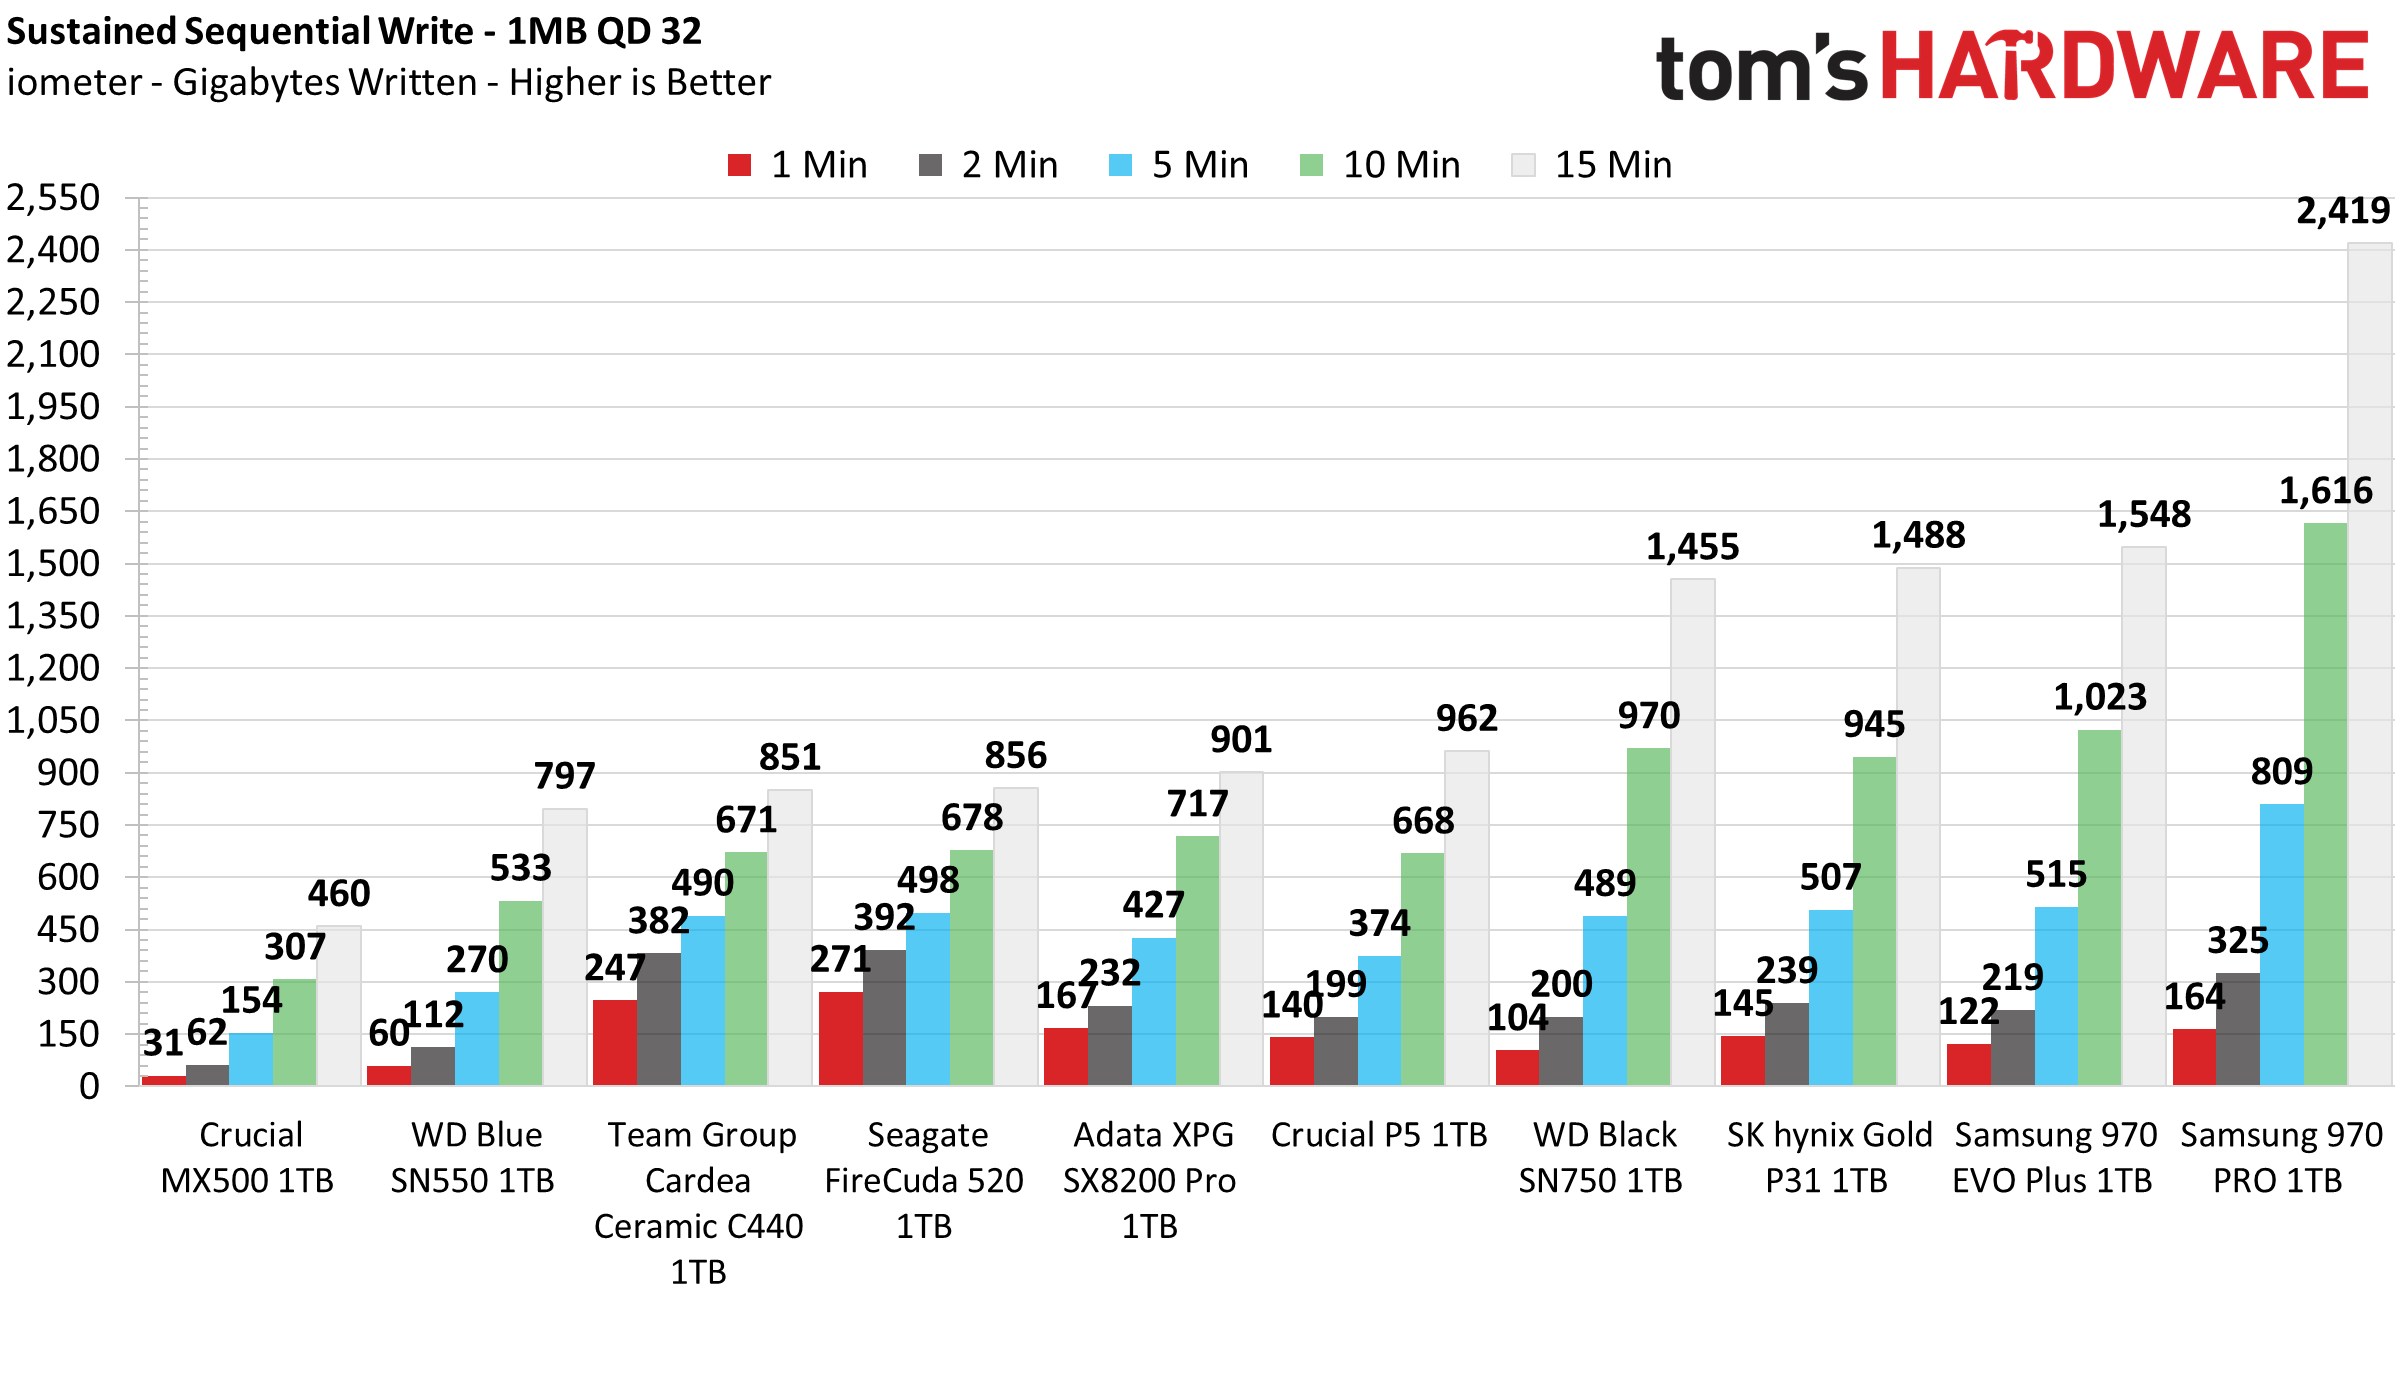
Armed with a standard-issue Phison E16 controller, Team Group’s T-Force Cardea Ceramic C440 can write one-third of its capacity before degrading in performance. In this test, we measured the SSD to write 360GB of data at a rate of 4.25 GBps before it degraded to an average of 600 MBps while the remainder of the drive filled. When the test was completed and we let the SSD idle, its SLC cache recovered very quickly at a rate of roughly 16GB per 30 seconds.
Power Consumption and Temperature
We use the Quarch HD Programmable Power Module to gain a deeper understanding of power characteristics. Idle power consumption is an important aspect to consider, especially if you're looking for a laptop upgrade. Some SSDs can consume watts of power at idle while better-suited ones sip just milliwatts. Average workload power consumption and max consumption are two other aspects of power consumption, but performance-per-watt is more important. A drive might consume more power during any given workload, but accomplishing a task faster allows the drive to drop into an idle state faster, which ultimately saves power.
We also monitor the temperature of the drive via the S.M.A.R.T. data and an IR thermometer to see when (or if) thermal throttling kicks in and how it impacts performance. Bear in mind that results will vary based on the workload and ambient air temperature.
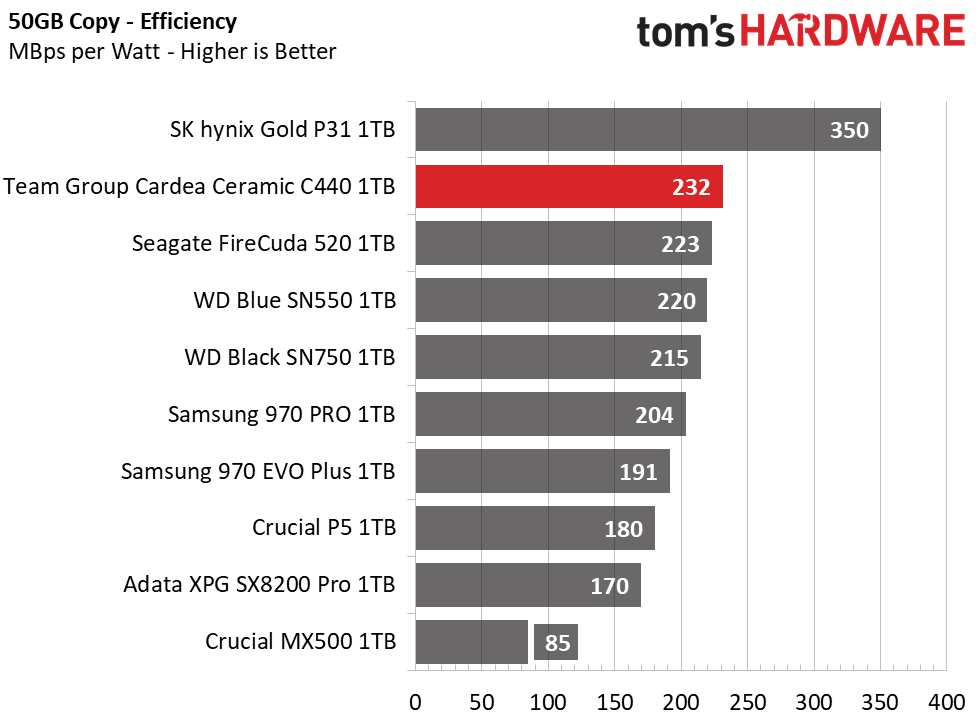
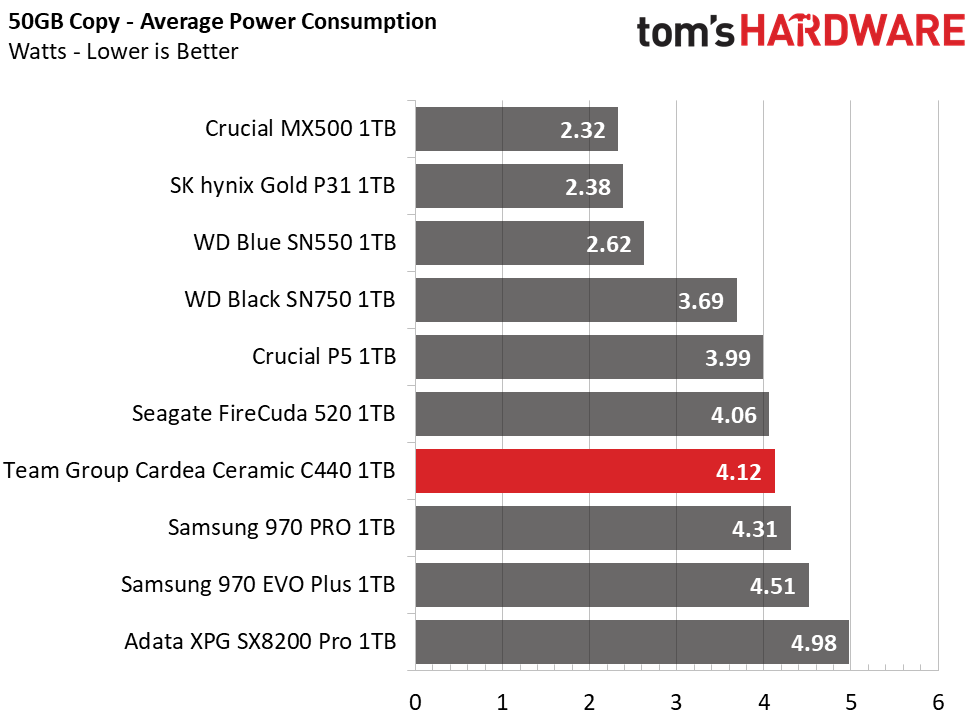
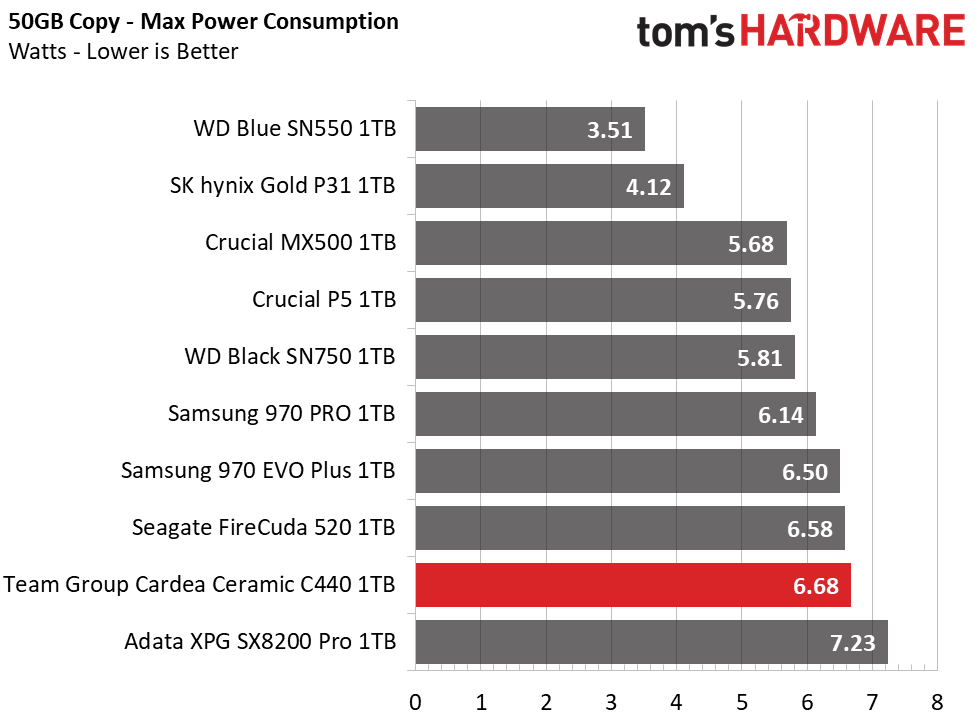
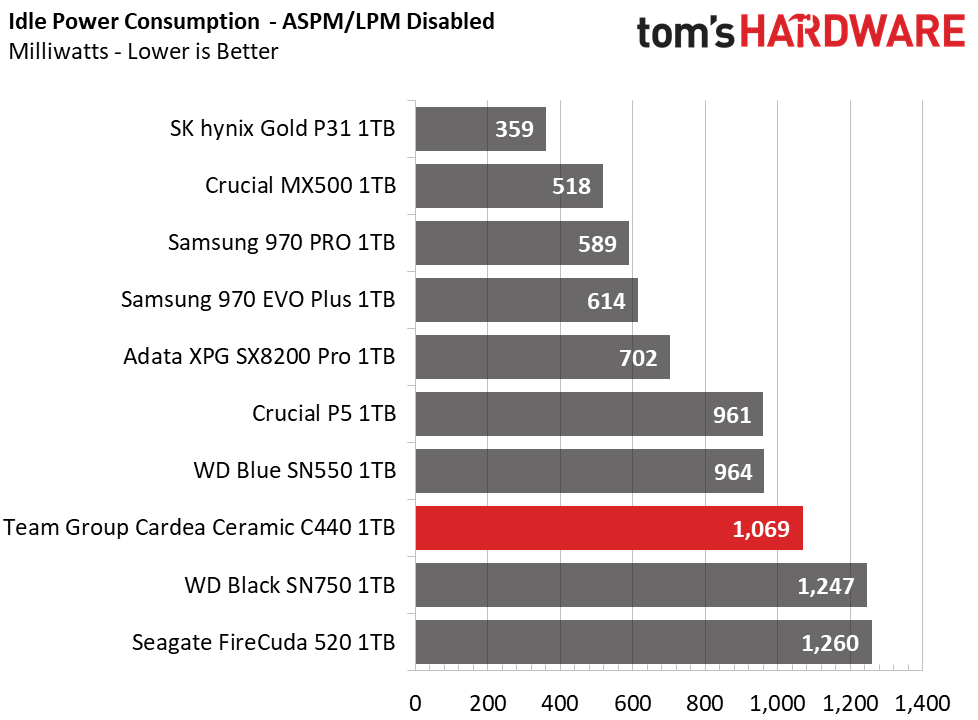
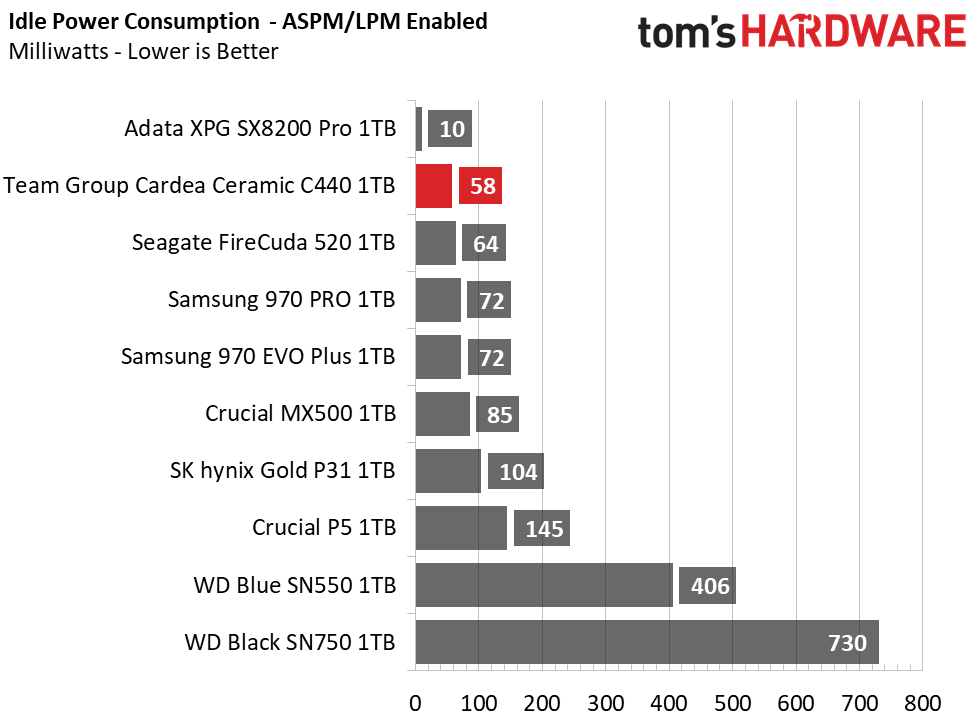
Not only is Team Group’s T-Force Cardea Ceramic C440 fast, but with well-managed average and peak power draw as well as low average and idle power consumption results, the C440 is fairly efficient too. Even under load, it achieves second place in our efficiency test, falling behind the freakishly efficient SK hynix Gold P31.
With the ceramic heat spreader cooling it, no thermal throttling occurred. We measured acceptable thermal performance even when hitting the Team Group T-Force Cardea Ceramic C440 with over 600GB of reads and writes. We measured peak temperatures of 77-80 degrees Celsius on the controller with an IR thermometer in a room with static air being at 24 degrees Celsius.
MORE: Best SSDs
MORE: How We Test HDDs And SSDs
MORE: All SSD Content

Sean is a Contributing Editor at Tom’s Hardware US, covering storage hardware.
-
alithegreat Hello,Reply
That certainly won’t matter to everyone, but you’ll need to look elsewhere for a black PCB.
I think it shouldn't be a minus in that case. I for one never cared about RGB or colors, they sit inside a computer case which nobody stares while i am using my pc. I can't even see it if i wanted to , while using my pc.. I guess it's like showing off with your car these days, anyway.
So maybe aesthetic concerns should be highlighted in a different way? Maybe a blue :D color text? So people know it's highly subjective rather than data based.
Thanks, -
seanwebster Reply
Hi,alithegreat said:Hello,
I think it shouldn't be a minus in that case. I for one never cared about RGB or colors, they sit inside a computer case which nobody stares while i am using my pc. I can't even see it if i wanted to , while using my pc.. I guess it's like showing off with your car these days, anyway.
So maybe aesthetic concerns should be highlighted in a different way? Maybe a blue :D color text? So people know it's highly subjective rather than data based.
Thanks,
I disagree. While this point is subjective on the buyer, the thing is most M.2s, let alone high-end SSDs come with black PCBs. Even PSUs have black PCBs and they are well hidden. I would argue that it's not just a personal opinion, it's objective considering the state of the market at this point. Considering an M.2 like this will have to do without the mobo heatsink, the blue sticks out like a sore thumb for anyone who cares about tying together the looks of their build. Many enthusiasts tend to buy cases with glass panels/windows to see the insides, which is why RGB has blown up.
It doesn't matter to those pinching pennies, sure, but if you're paying a premium for a Gen4 SSD already, why wouldn't you want a PCB that actually matches the rest of your system? The company's own entry-level models even sport black PCBs. For a high-end option to not feature it, there is no excuse, it's a con for me. Also, most people I have spoken to about it agree that when it comes to actually making a purchase decision, they will more often than not opt for an SSD with a black PCB more than blue or green. Besides, the cost difference is under a dollar per piece from what I remember for DRAM. M.2s are even smaller, so the cost difference is minimal, especially, once again, for an already high-end built SSD with a heat spreader tacked on.
It has been in part my consistent complaining about non-black PCBs for years since SSDs first released that has pushed manufacturers to implement black PCBs in the first place. ;) -
Red_Viper_Martell If you're looking to compare this Cardera SSD to Samsung's 980 Pro (like I was), the Team Group Ceramic C440 1TB is included in the benchmark tables in the article for the 980 Pro itself. Not really sure why Sean wouldn't have the 980 Pro here. From a brief scan, the 980 Pro wins in most categories, except price.Reply
Edited to note: This article reports a peak controler temp of 80℃ v.s. 85℃ on the 980 Pro. I would guess that the thermal conductivity of the thermal pad is a limiting factor. -
seanwebster Reply
This review was submitted before the Samsung embargo.Red_Viper_Martell said:If you're looking to compare this Cardera SSD to Samsung's 980 Pro (like I was), the Team Group Ceramic C440 1TB is included in the benchmark tables in the article for the 980 Pro itself. Not really sure why Sean wouldn't have the 980 Pro here. From a brief scan, the 980 Pro wins in most categories, except price.
Edited to note: This article reports a peak controler temp of 80℃ v.s. 85℃ on the 980 Pro. I would guess that the thermal conductivity of the thermal pad is a limiting factor.
