Corsair CS850M 850W Power Supply Review
Why you can trust Tom's Hardware
Cross-Load Tests And Infrared Images
To generate the following charts, we set our loaders to Auto mode through our custom-made software before trying over a thousand possible load combinations with the +12V, 5V and 3.3V rails. The load regulation deviations in each of the charts below were calculated by taking the nominal values of the rails (12V, 5V and 3.3V) as point zero.
Our cross-load tests are described in detail here.
Load Regulation Charts
We found tight load regulation on the +12V rail, especially for a PSU that doesn’t address the enthusiast crowd.
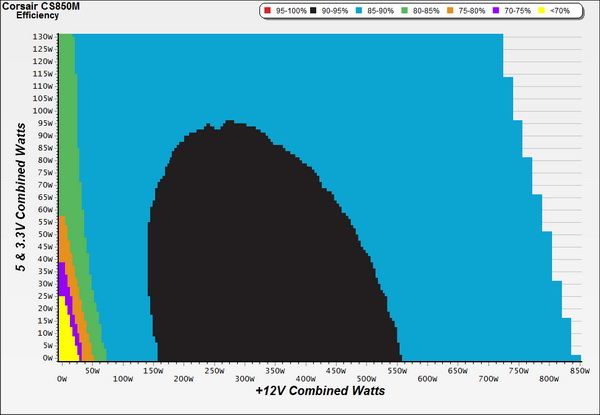
Efficiency Chart
Efficiency throughout most of the unit’s operating range is constantly above 85 percent, and there is a pretty large region with efficiency that exceeds 90 percent.
Ripple Charts
Ripple on the +12V rail spikes to the 40–60mV region only when the PSU is pushed close to its limits. Of course, we'd prefer if it stayed below 40mV, but we can’t expect too much from this platform since it doesn’t use any Japanese capacitors on the secondary side. Ripple on the minor rails is controlled well, even at high loads. On the 5VSB rail, ripple suppression is excellent.
Infrared Images
We took some photos of the PSU during the end of the cross-load tests with our modified FLIR E4 camera, which delivers 320x240 IR resolution (76,800 pixels).
Get Tom's Hardware's best news and in-depth reviews, straight to your inbox.
Current page: Cross-Load Tests And Infrared Images
Prev Page Efficiency, Temperatures And Noise Next Page Transient Response Tests
Aris Mpitziopoulos is a contributing editor at Tom's Hardware, covering PSUs.
