Trend analysis
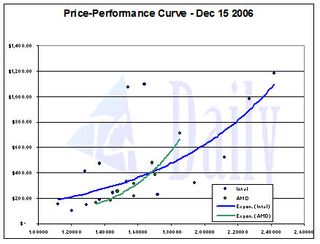
Because of the overall calm in prices, there is not a whole lot to say about the price/performance graphs this time around. One thing to note is that the correlation for both Intel and AMD slid down a bit this week. AMD's correlation fell 1.85% from last week's amazing 0.942 to 0.925, and Intel's went from 0.650 to 0.638, a 1.84% drop.

Click image to enlarge
After dissecting Intel into the Core 2 and Pentium groups, there is virtually no visible different over last week's chart, and the correlation values for the two separate groups is almost exactly the same as well. All in all, the main points this week were AMD's continuing price falls and a couple significant price records for Intel. Business as usual.

Click image to enlarge
After a rough time for AMD earlier this year, which had forced the company into dramatic price cuts to position itself right between Intel's outgoing Netburst architecture processors and the newer Core 2 Duos, it is quite fascinating to see how much both AMD and Intel are in fact able to control e-tail and retail prices and put a complete chaos in to order within less than six months. Considering the fluctuation and complexity of the market as well as the fact that the Pentium D 800/900 will be leaving soon, the processors are remarkably well aligned and are all about where would you expect them to be. From that perspective, there are very few processors that could be considered bad buys at this time.
For those who are interested in our graphical coverage of processor pricing, we have compiled the data for each processor individually. If you are interested in a particular processor, these charts provide you with an idea how the price of a CPU has bahved in the recent past and if you are buying at a low or high point. Head over to the next page for part one, which lists graphs for AMD processors. Intel processors are listed on the following page.
Stay on the Cutting Edge
Join the experts who read Tom's Hardware for the inside track on enthusiast PC tech news — and have for over 25 years. We'll send breaking news and in-depth reviews of CPUs, GPUs, AI, maker hardware and more straight to your inbox.
Most Popular

