SBM 5: Price/Performance
Value Analysis
Our high-performance build beat up the other two systems pretty badly, but the big surprise came from those few benchmarks where the low-cost system beat our mid-priced build. How will things look in the balance?
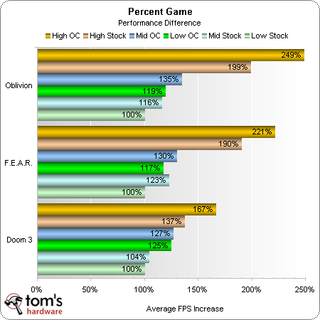
These might be "multi-purpose" machines, but each has over a quarter of its purchase price invested in its graphics system. With so large a portion of the build cost dedicated to 3D performance, let's first consider the average frame rates for each of the games tested.

A huge150% spread separates the fastest and slowest configurations in Oblivion, with a combined average performance difference of 112%. This could spell big trouble for the mid-priced and high-performance configurations in the value comparison, since each step up represents a significantly larger increase in price.

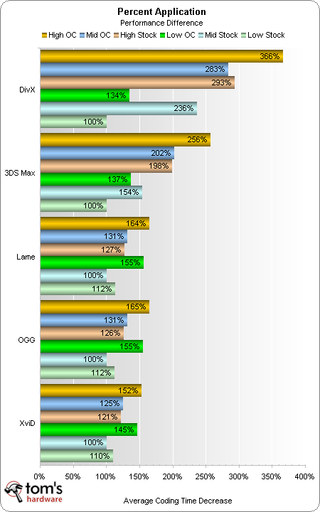
DivX sets the high mark in performance differentiation with a 266% distribution, while XviD finds a mere 52% difference between the best and worst performers. Value looks even worse for the high-cost system with the average difference narrowing to 107%.

Sandra's single component tests might not represent any actual programs, but these were sure to put the best possible light on the high-end system's fast CPU and RAM. PC Mark's hard drive test was equally sure to favor the high-performance RAID 0 array. 3D Mark 2005 might be a better indicator of actual system performance, but one benchmark that makes little sense is SPECviewperf. We've previously expressed our concern that nVidia's new unified graphics driver (ForceWare 162.18) doesn't seem to play well with the professional OpenGL applications benchmark, but we were hoping that all three systems would be equally affected by the new results.
Stay on the Cutting Edge
Join the experts who read Tom's Hardware for the inside track on enthusiast PC tech news — and have for over 25 years. We'll send breaking news and in-depth reviews of CPUs, GPUs, AI, maker hardware and more straight to your inbox.
Most Popular


