




Intel has something interesting going on with its new Binary Optimization Tool. Otherwise known as iBOT, it’s a translation layer along the lines of Microsoft Prism or Apple Rosetta. However, instead of translating instructions from one ISA (instruction set architecture) to another, it’s optimizing x86 applications to run more efficiently on Intel CPUs. As Intel puts it, it translates “other x86” to “Intel x86.”
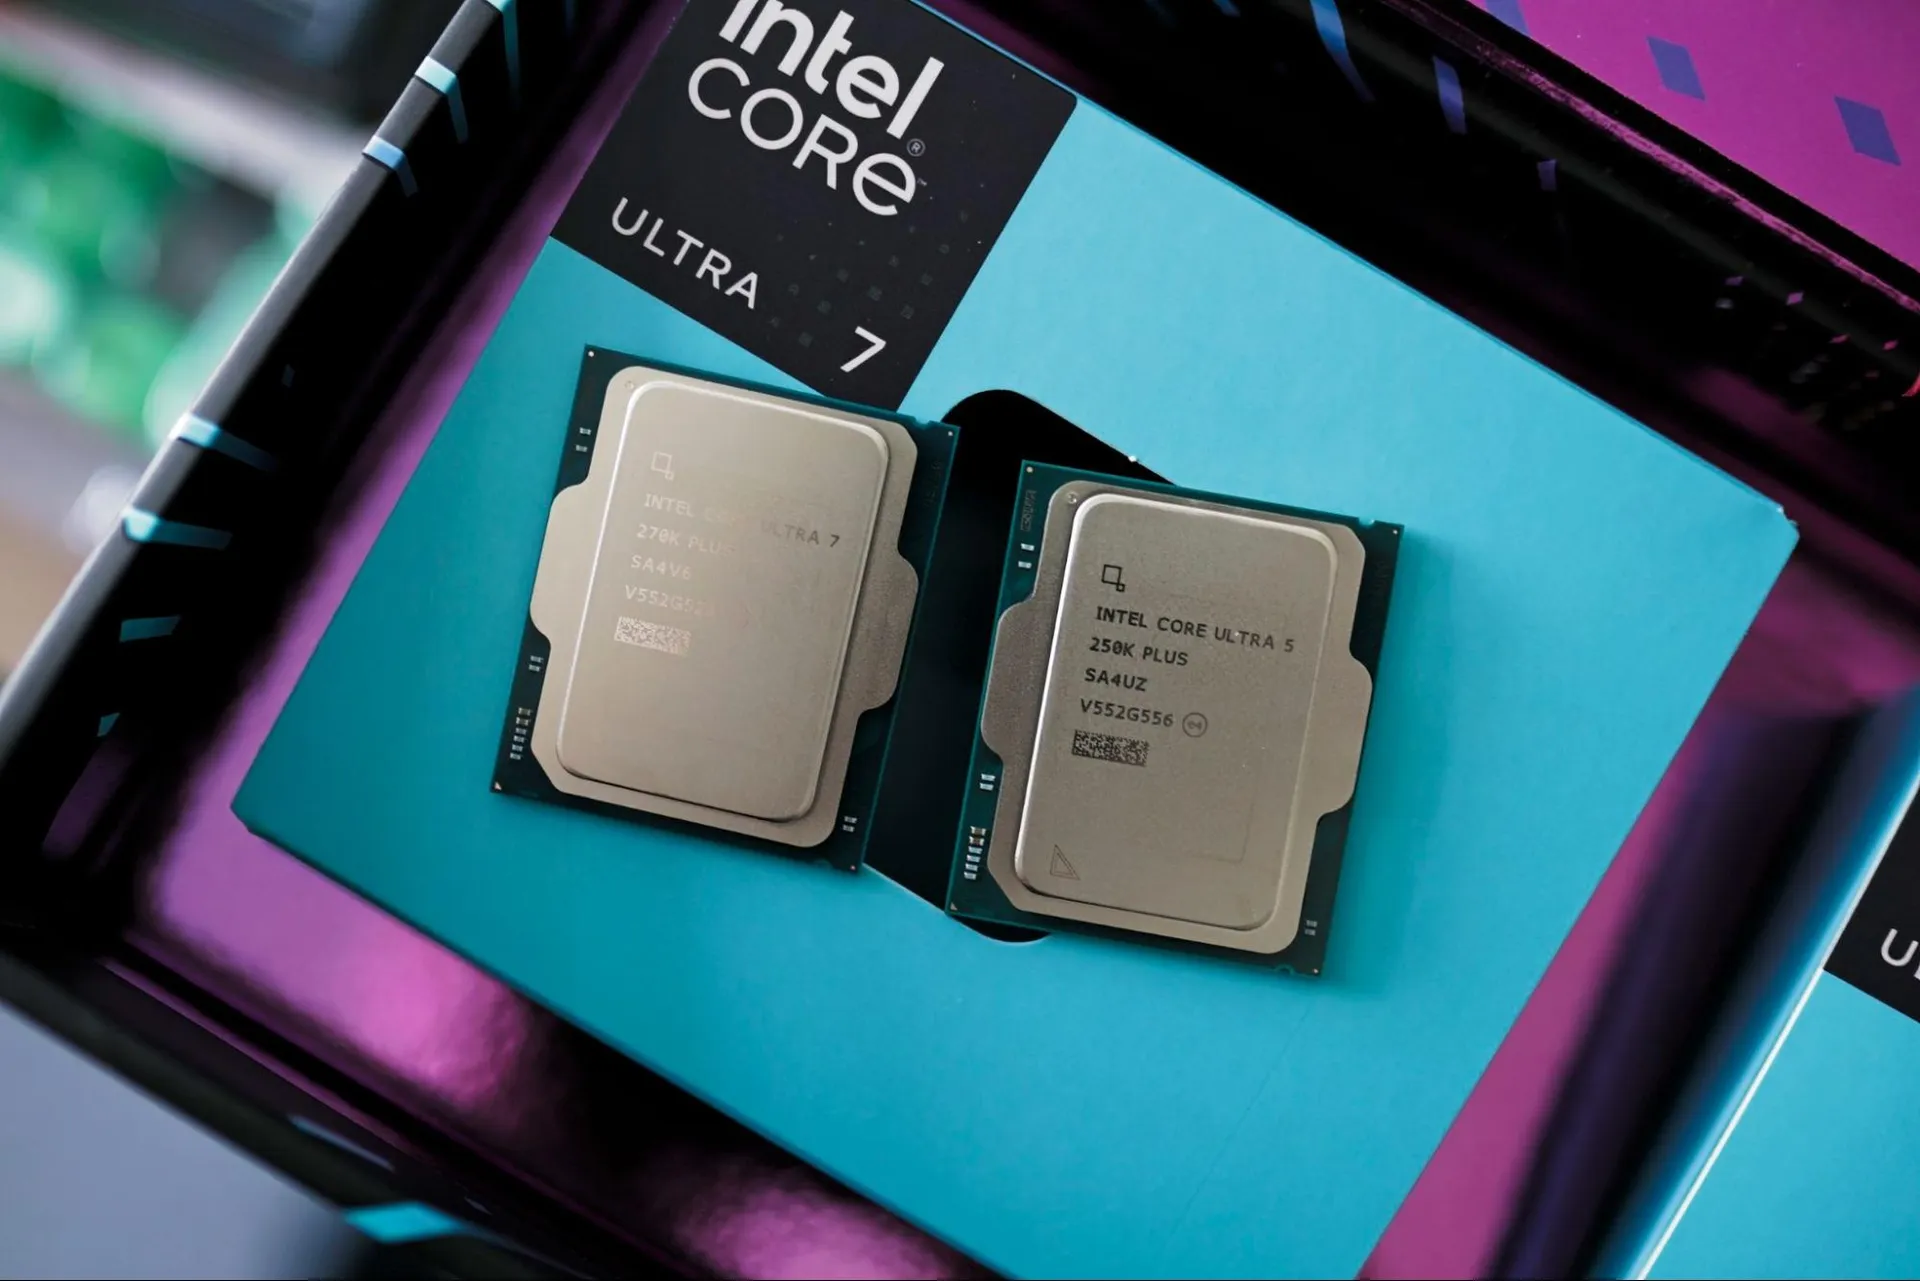
It’s one of the marquee features on Intel’s new Core Ultra 200S Plus chips, the Core Ultra 7 270K Plus and Core Ultra 5 250K Plus. Although both show performance improvements strictly through silicon, at least part of their gaming boost comes courtesy of iBOT. It’s only enabled in 12 games right now, but Intel says iBOT is part of its long-term roadmap and that it’ll be a feature in Intel chips on desktop and mobile going forward. I wanted to see just how much of a boost iBOT represented, so I tested the feature in 10 of the 12 games it’s currently supported in, and I sat down with Intel’s Robert Hallock to better understand how the feature works and what it can offer.
Strictly looking at performance, iBOT represents about an 8% boost in average frame rates across both the Core Ultra 7 270K Plus and Core Ultra 5 250K Plus. That’s a boost we’ve seen before with Intel’s Application Optimization, or APO, in the past. The difference here is that the leads are much more consistent, and they peak as high as 18% in Shadow of the Tomb Raider with the 270K Plus.

Data is only part of the story here, however. We’re dealing with a small pool of samples, after all, and the benefits of a feature like iBOT won’t be clear until we have a supported games list in the dozens, at least. The other part of the story is how iBOT works. It’s unique, unlike anything we’ve seen from Intel or AMD in the past, and it could hold promise if Intel sticks with it. It won’t universally improve CPU performance, but it’s a lever available through software that Intel can pull to effectively increase IPC.
That’s what we’re going to showcase here: both the performance of iBOT, and an overview of how it works, so it’s clear why the feature is so interesting. Hopefully, we’ll also dispel some of the misconceptions about iBOT. Intel has a history of promising performance improvements through software that have never really turned into much, so it makes sense that iBOT has been handled with skepticism up to this point.
Before getting into the details about how iBOT works and its potential applications, let’s get on with the benchmarks.
Intel Binary Optimization Tool benchmarks
We tested iBOT in 10 of the 12 games it’s currently supported in, as well as looked at it in Geekbench 6 (more on that in a bit). Intel says we should see an 8% uplift on average, and sure enough, I saw just about that big of a jump across both the Core Ultra 7 270K Plus and Core Ultra 5 250K Plus when looking at a geomean of my results. Some games scale much higher, while in others, I didn’t see any difference at all.
The test bench we used is identical to the one we use in our CPU reviews. That means the RTX 5090 FE is at the helm to remove any potential GPU bottlenecks. We’re evaluating CPU performance here. To that end, we also tested at 1080p with a mixture of Ultra and High settings and without any upscaling or frame generation assistance. I also exclusively tested iBOT. The feature is built on top of APO — more on that later — and I left APO on across both runs. It should, as long as you have your drivers installed, work without any manual intervention.


On average, the Core Ultra 5 250K Plus saw an 8.3% improvement with iBOT across the test suite, while the Core Ultra 7 270K Plus saw a 7.5% improvement; we can call it roughly 8% when bringing together both chips. The individual results are what’s interesting here, and specifically how they change between the 270K Plus and 250K Plus.
For the 250K Plus, most games saw between a 7% and 10% jump, with the best performer being Remnant 2 with a 10.9% improvement. Weighing the average down is Cyberpunk 2077, which improved by a meager 1.8% with iBOT on. Taking Cyberpunk out of the mix, the average jumps up to over 9%. I suspect Cyberpunk 2077 was included as part of Intel’s initial games list not because it sees big performance gains with iBOT, but rather because it’s ubiquitous among the PC benchmarking community.
Regardless, the results are consistent here. That 8% uplift isn’t the result of one or two rogue games where iBOT really shines; the feature is showing improvements across the full suite of games.
Things are more variable with the Core Ultra 7 270K Plus, for better and worse. On the plus side, I saw massive improvements in Shadow of the Tomb Raider and Hogwarts Legacy, with the former jumping by 18% with iBOT enabled and the latter climbing by over 12%. On the other hand, Final Fantasy XIV saw just a 5% improvement while the 250K Plus showed a 9% jump. In Hitman 3, the 270K Plus saw almost no benefit with iBOT enabled, while the 250K Plus showed an improvement of close to 6%. Similarly, in Wonderlands, the 270K Plus saw just a 0.5% boost from iBOT.
Otherwise, the results are consistent between the two CPUs — Cyberpunk 2077, Far Cry 6, Assassin’s Creed Mirage, Remnant 2, and Borderlands 3 all showed similar improvements across both chips with iBOT enabled.


Outside of average frame rates and 1% lows, I also charted clocks, temps, power, and efficiency, as I normally would in a CPU review. There’s not much to talk about here, though. With iBOT on, I recorded slightly higher power and temperatures, and better efficiency, but the margins are thin. We’re looking at an extra watt or two, at most, which is likely a consequence of some threads not idling due to inefficiencies.
I’m more interested in the differences between the Core Ultra 5 250K Plus and Core Ultra 7 270K Plus. As time goes on, Intel says it’ll be able to optimize older applications for newer architectures just as easily as optimizing newer applications for older architectures. It’s hard to believe there will be one universal profile for all of them. We’re already seeing some large discrepancies between two CPUs that are fairly similar. I have to imagine that will become exaggerated after iBOT has a few new microarchitectures under its belt.
It’s not clear now how Intel will handle those differences. Maybe if one or two chips see enough of a boost, the profile will be available to everyone, even if it doesn’t amount to an increase on some chips. Maybe, down the line, we’ll see individual profiles for different chips. It’s hard to say now, but it stands to reason that some CPUs and some architectures will benefit more in certain applications and not others.
Understanding the Binary Optimization Tool and its potential
iBOT is new, and because of that, it’s easy to misunderstand what the feature is doing. First, we need to start with Dynamic Tuning Technology (DTT) and Application Optimization (APO) because iBOT follows in that lineage, but in a very different way. For DTT, it’s system-level optimization, particularly concerning power. It adjusts power needs based on system conditions like thermal headroom (or lack thereof). APO is an application-level optimization layer. It’s concerned with combating overthreading, where an app spawns a thread it doesn’t actually need, and scheduling the right workloads on the right threads. iBOT is a binary-level optimization, which is different from an application-level optimization.

After a developer finishes writing their source code, it’s sent through a compiler to translate the source into binary. The compiler targets a certain ISA, so a binary for x86 won’t work on an ARM platform or vice versa. Once the compilation is done, developers can then start optimizing their code. They test performance, go back to source, recompile, and continue in that loop until they have a binary that’s optimized for their target platform.
In the case of x86, that’s a broad platform. There are hundreds of x86 CPUs in different configurations, so optimizing for one particular platform might come at the detriment of another. Developers also might be accustomed to a particular toolchain that leaves some performance on the table for more recent CPU architectures. iBOT aims to reduce those inefficiencies without rewriting the source code. It wants to create a binary optimized for Intel’s specific architecture without going back to the developer, optimizing, and recompiling a new binary. That requires two things.

The first is a way to see what’s happening while code is executing on the CPU on a very low level. That’s Hardware-based Profile Guided Optimization, or HWPGO. Inside Arrow Lake Refresh CPUs, and Intel CPUs moving forward, there are hardware performance counters that can catch things like cache misses, branch mispredictions, spinlocks, and hardware interrupts. Intel says it has a proprietary toolchain for monitoring these metrics, which it, understandably, doesn’t want to divulge in greater detail.
The second is a translation layer. If certain instructions are causing inefficiencies, Intel needs to rework those instructions to avoid the inefficiency it caused. You could fix those issues by going back to source code, but Intel would then have to court the developer, convince them to spend time and money optimizing for its specific architecture, and then release a new binary that’s optimized for one specific architecture and not another. That’s going to be a hard sell, especially considering AMD's continued rise in market share. So, Intel needs to optimize on the backend, using a production binary and translating the instructions in real-time at runtime. That’s what iBOT is doing. Then, Intel bundles up those optimizations as a profile, ships it out, and you’re on your way.

We can take a cache miss as an example. The core needs some data in cache that’s not there, and the core needs to stall for some number of cycles while that data is fetched, effectively lowering IPC. “Did the cache miss happen because that data wasn’t tagged with priority, and it just got evicted? OK, that is a place where binary optimization could certainly help,” Intel’s Robert Hallock says. “We could just tag it and say, ‘hey, stay local, don’t evict me.’ Pretty powerful capability.”
There are some performance benefits in a small number of games, but iBOT has far greater potential once you understand how it works. It is a lever, through software, to improve IPC. Every time there’s a cache miss, a branch misprediction, a spinlock, or anything else that goes awry when executing instructions, IPC goes down slightly. Every time iBOT is able to get the correct data, choose the right branch, and avoid “busy waiting” where a thread is active but not doing anything, IPC goes up. These are marginal differences on a micro level, but add them up, and you could come up with a decent improvement in performance overall.
Intel is applying iBOT to games, but it can work with any application. As a proof of concept, it has a profile for Geekbench. Geekbench is a benchmark, pure and simple. It runs some real-world workloads, but it’s trying to get a comprehensive view of performance in a test pass of about five minutes. It’s not a comprehensive view of real-world performance. For Intel, however, Geekbench is low-hanging fruit to showcase what iBOT could do in applications.


With iBOT, there’s about a 3% jump in multithreaded performance and about a 5% jump in single-threaded performance. Again, this doesn’t translate to any application right now, but it shows that iBOT has legs outside of games. That’s particularly true in lightly-threaded workloads. With the margins of single-threaded applications, a 5% jump is substantial.
“All we’re saying is like, look what we can do with non-gaming stuff using this standard set of modules,” Hallock told me. “I want to be super clear that if I had binary optimization working on an actual Clang compiler, that might be a different performance result than the number you see in Geekbench because it’s a different workload… but we hope that we can at least paint the picture that there is a lot of opportunity out here for stuff that is beyond gaming.”
The initial results from iBOT are solid. We’re not seeing lineup-breaking performance differences, and it’s only supported in an established list of games that are popular among the benchmarking community. If you’re upgrading your CPU and want to play the recently-released Crimson Desert, iBOT does nothing for you, and it may never if Intel can’t find optimizations using its toolchain.
Still, I’m approaching iBOT with skeptical optimism because it seems to have a lot of potential, especially when it comes to optimizing older architectures for newer applications or vice versa. It’s bridging the gap between software and hardware in an interesting way that has a lot of positive implications. The main question is if Intel will stick with it, and if there are really enough optimizations to find as time goes on.

Follow Tom's Hardware on Google News, or add us as a preferred source, to get our latest news, analysis, & reviews in your feeds.