Toshiba Satellite p105-S9330 Performance Slideshow
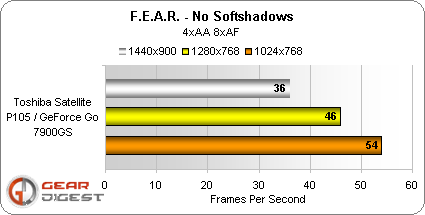
With AA and AF on performance degrades noticeably. The frame rates are still decent for regular game play though not as good as those for higher end gaming notebooks like the Killer Executioner or Widow PC Sting 517D.
With AA and AF on performance degrades noticeably. The frame rates are still decent for regular game play though not as good as those for higher end gaming notebooks like the Killer Executioner or Widow PC Sting 517D.
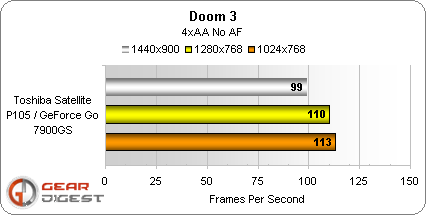
On the CPU intensive Doom 3, this Satellite does not disappoint. At least not at 1024x768.
On the CPU intensive Doom 3, this Satellite does not disappoint. At least not at 1024x768.
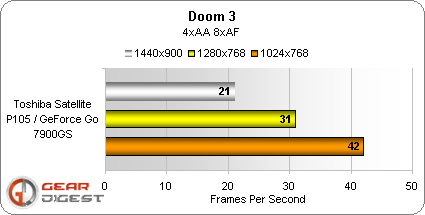
At the 4xAA/8xAF setting the frame rate decays very noticeably, which is to be expected.
At the 4xAA/8xAF setting the frame rate decays very noticeably, which is to be expected.
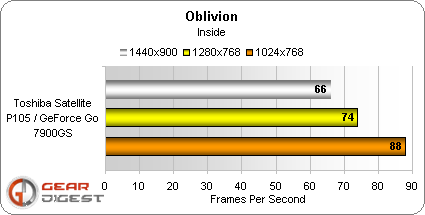
Oblivion is a game that just eats up CPU and graphics card cycles with an insatiable appetite. Running inside the game delivers pretty good frames per second rates, but take it outside and let's see what happens in the next slide.
Oblivion is a game that just eats up CPU and graphics card cycles with an insatiable appetite. Running inside the game delivers pretty good frames per second rates, but take it outside and let’s see what happens in the next slide.
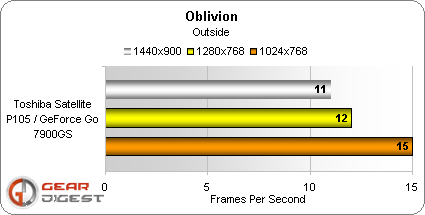
Ouch! At a resolution of 1024x768 the frame rate of only 15fps promises choppy seas in Elder Scrolls land.
Ouch ! At a resolution of 1024x768 the frame rate of only 15fps promises choppy seas in Elder Scrolls land.
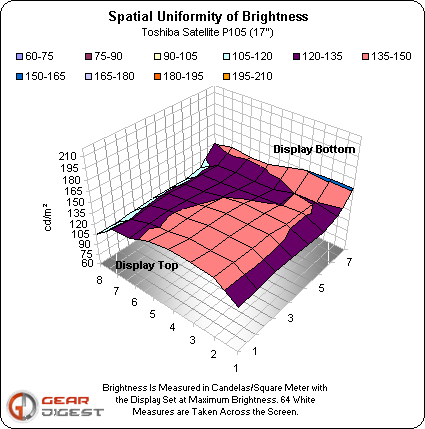
The Toshiba Satellite p105-S9330's display as tested has a display mean brightness of 132 candelas per square meter (cd/m^2) which is satisfactory. The display's minimum brightness is 104 cd/m^2 and the maximum is 152 cd/m^2 for a brightness range of 48 c
The Toshiba Satellite p105-S9330’s display as tested has a display mean brightness of 132 candelas per square meter (cd/m^2) which is satisfactory. The display’s minimum brightness is 104 cd/m^2 and the maximum is 152 cd/m^2 for a brightness range of 48 c
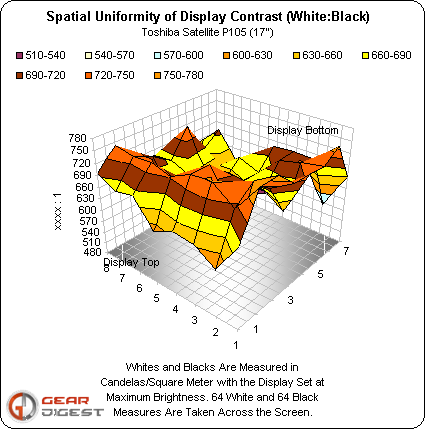
Mean contrast is solid at 676 cd/meter^2. Minimum contrast is 506 cd/meter^2; the maximum is 794 cd/meter^2 for a range of 288 cd/meter^2. Contrast is raggedly distributed as the dramatic hills and valleys in the chart show.
Mean contrast is solid at 676 cd/meter^2. Minimum contrast is 506 cd/meter^2 ; the maximum is 794 cd/meter^2 for a range of 288 cd/meter^2. Contrast is raggedly distributed as the dramatic hills and valleys in the chart show.
Get Tom's Hardware's best news and in-depth reviews, straight to your inbox.
Tom's Hardware is the leading destination for hardcore computer enthusiasts. We cover everything from processors to 3D printers, single-board computers, SSDs and high-end gaming rigs, empowering readers to make the most of the tech they love, keep up on the latest developments and buy the right gear. Our staff has more than 100 years of combined experience covering news, solving tech problems and reviewing components and systems.
