Asus TUF X470-Plus Gaming Review: Attractive Value
Why you can trust Tom's Hardware
Test Configuration & Benchmark Results
Comparison Products
Test System Configuration
| Sound | Integrated HD Audio |
| Network | Integrated Gigabit Networking |
| Software | |
| OS | Windows 10 64-bit |
| Graphics | Crimson 16.10.1 WHQL |
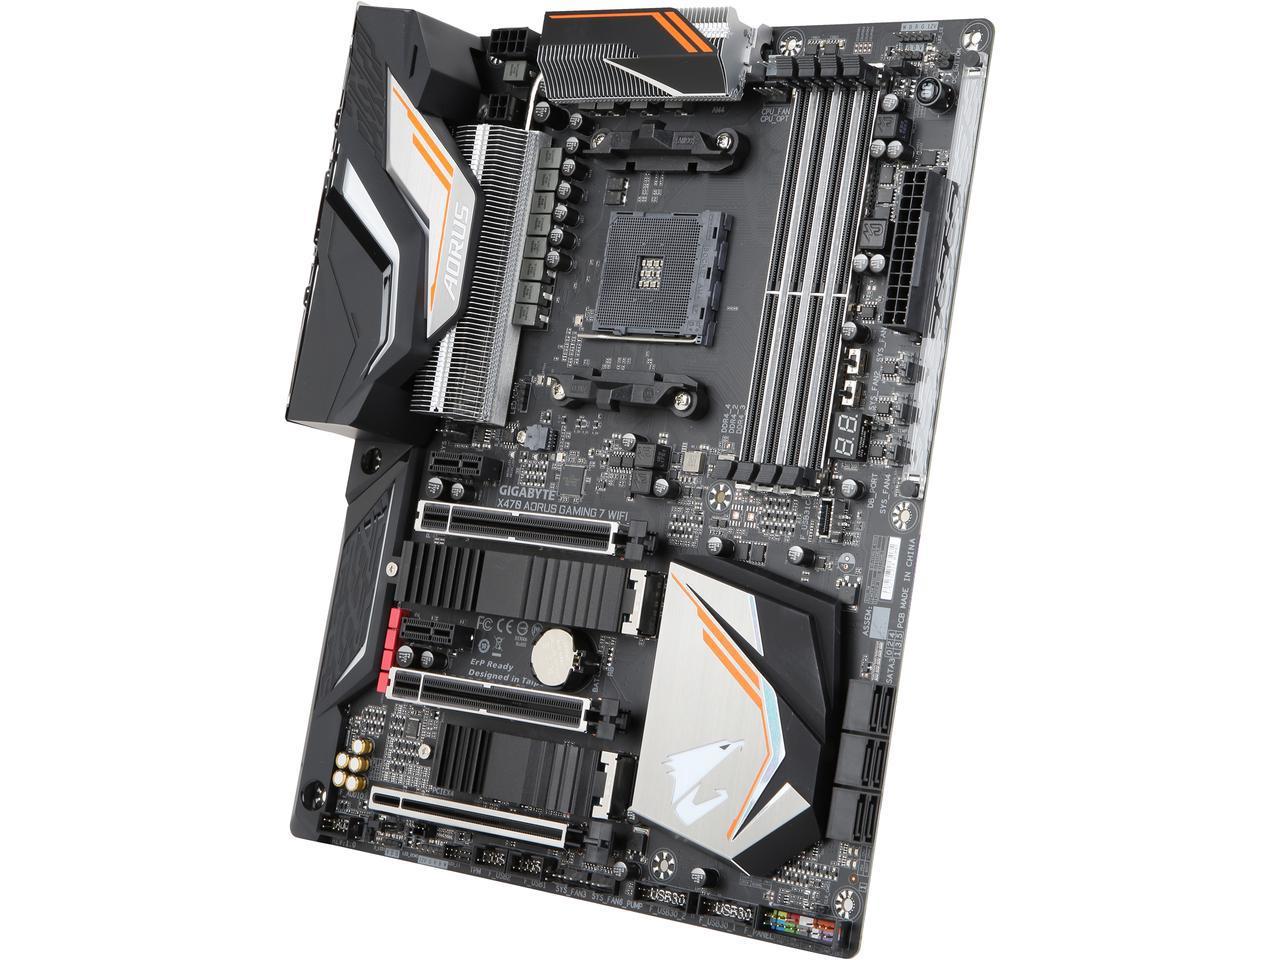
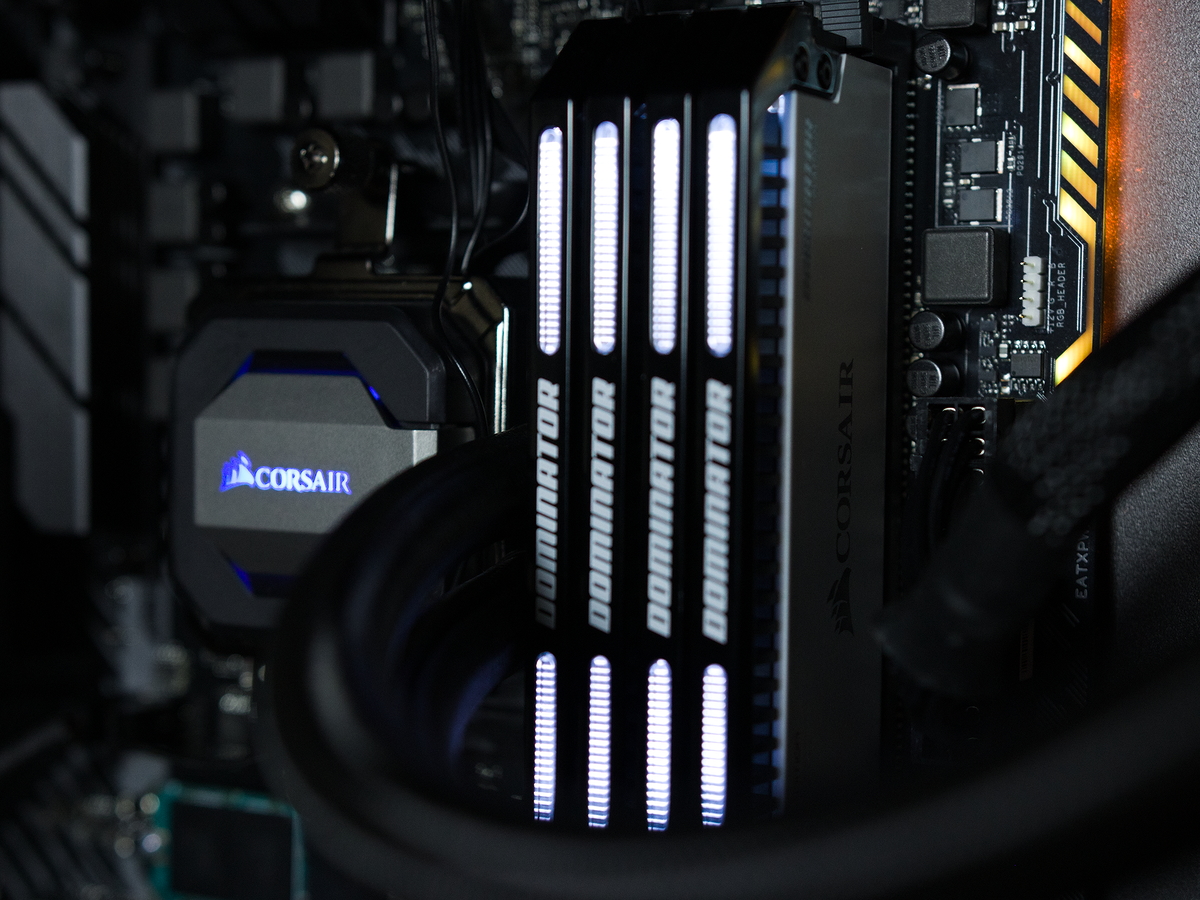
Since the initial X470 launch (including the excellent Gigabyte X470 Aorus Gaming 7), we’ve upgraded our memory configuration with a four-piece set of Corsair Dominator Platinum DDR4-3466 of the company's limited edition High Contrast SKU. The aesthetic is attractive, and we hope to hit higher memory speeds in our overclocking section on subsequent reviews.
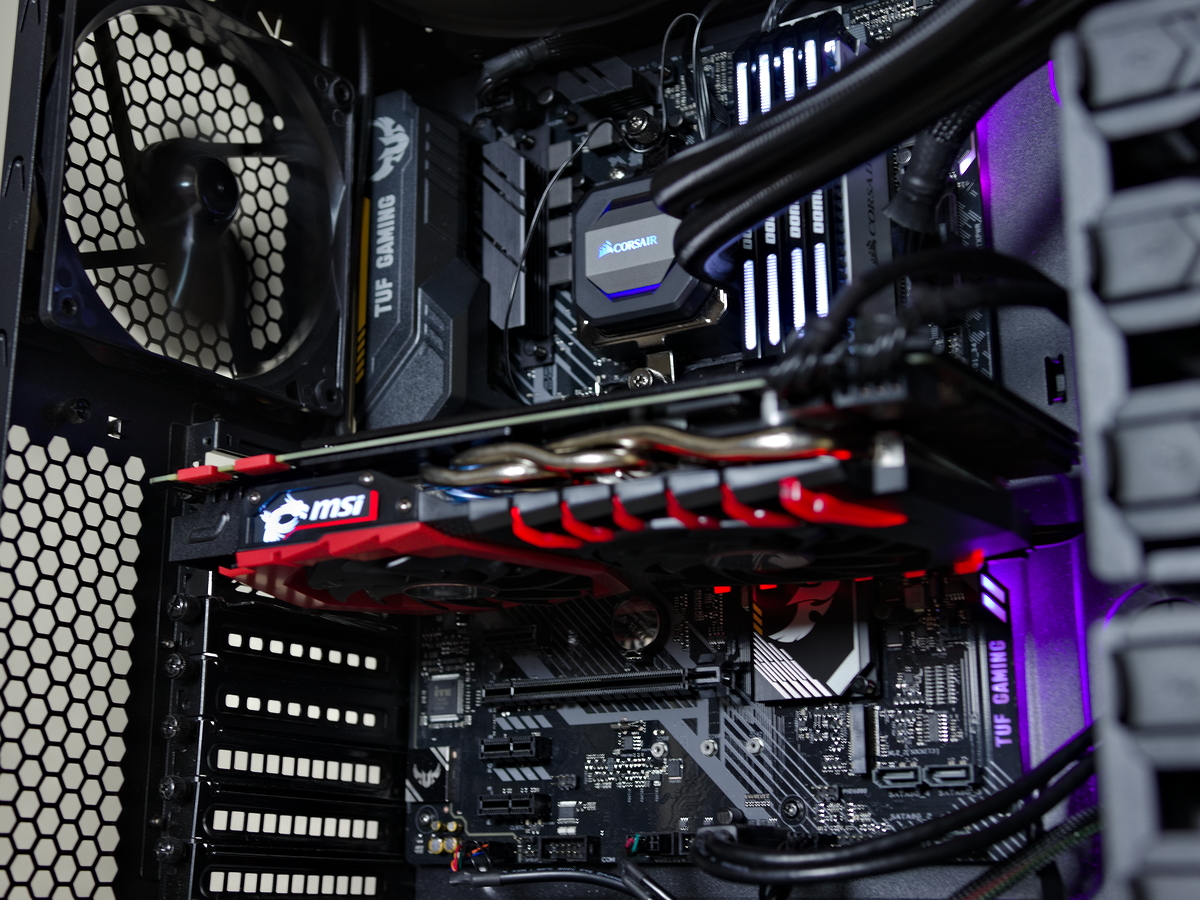
We were sampled a Ryzen 7 2700X box sample from AMD for use with our test bench, which is cooled by the Corsair H110i 240mm AIO cooler. With the updated processor, it's time to upgrade our GPU from our trusty GTX 970 to a respectable MSI GTX 1080. Our test monitor is a 4k LG variant that enables us to test FHD, WQHD, and UHD for all our gaming benchmarks.
We still employ the Toshiba RD400 256GB M.2 NVMe drive for storage, and various hard drives for Steam Libraries and miscellaneous software.
Benchmark Suite
| Benchmark Settings | |
| Synthetic Benchmarks & Settings | |
| PCMark 8 | Version 2.7.613Home, Creative, Work, Storage, Applications (Adobe & Microsoft) |
| SiSoftware Sandra | Version 2016.03.22.21CPU Arithmetic, Multimedia, Cryptography, Memory Bandwidth |
| DiskSPD | 4k Random Read, 4k Random Write128k Sequential Read, 128k Sequential Write |
| Cinebench R15 | Build RC83328DEMOOpenGL Benchmark |
| CompuBench | Version 1.5.8Face Detection, Optical Flow, Ocean Surface, Ray Tracing |
| 3D Tests & Settings | |
| 3DMark 13 | Version 4.47.597.0Test Set 1: Skydiver, 1920x1080, Default PresetTest Set 2: Firestrike, 1920x1080, Default PresetTest Set 3: Firestrike Extreme, 2560x1440 Default Preset |
| Application Tests & Settings | |
| LAME MP3 | Version 3.98.3Mixed 271MB WAV to mp3: Command: -b 160 --nores (160 Kb/s) |
| HandBrake CLI | Version: 0.9.9Sintel Open Movie Project: 4.19 GB 4k mkv to x265 mp4 |
| Blender | Version 2.68aBMW 27 CPU Render Benchmark, BMW 27 GPU Render Benchmark |
| 7-Zip | Version 16.02THG-Workload (7.6 GB) to .7z, command line switches "a -t7z -r -m0=LZMA2 -mx=9" |
| Adobe After Effects CC | Release 2015.3.0, Version 13.8.0.144PCMark driven routine |
| Adobe Photoshop CC | Release 2015.5.0. 20160603.r.88 x64PCMark driven routine (light and heavy) |
| Adobe InDesign CC | Release 2015.4, Build 11.4.0.90 x64PCMark driven routine |
| Adobe Illustrator | Release 2015.3.0, Version 20.0.0 (64-bit)PCMark driven routine |
| Game Tests & Settings | |
| Ashes of Singularity | Version 1.31.21360High Preset - 1920x1080, Mid Shadow Quality, 1x MSAACrazy Preset - 1920x1090, High Shadow Quality, 2x MSAAHigh Preset - 4k ~3460x1920, Mid Shadow Quality, 1x MSAACrazy Preset - 4k ~3460x1920, High Shadow Quality, 2x MSAA |
| F1 2015 | 2015 Season, Abu Dhabi Track, Rain1920x1080 - UltraHigh Preset, 16x AF4k ~3460x1920 - UltraHigh Preset, 16x AF |
| Metro Last Light Redux | Version 3.00 x64High Quality, 1920x1080, High TesselationVery High Quality, 1920x1080, Very High TesselationHigh Quality, 4k ~3460x1920, High TesselationVery High Quality, 4k ~3460x1920, Very High Tesselation |
| The Talos Principle | Version 2672521920x1080 - Medium Preset, High Quality, High Tesselation, 4x AF1920x1080 - Ultra Preset, VeryHigh Quality, VeryHigh Tesselation, 16x AF4k ~3460x1920 - Medium Preset, High Quality, High Tesselation, 4x AF4k ~3460x1920 - Ultra Preset, VeryHigh Quality, VeryHigh Tesselation, 16x AF |
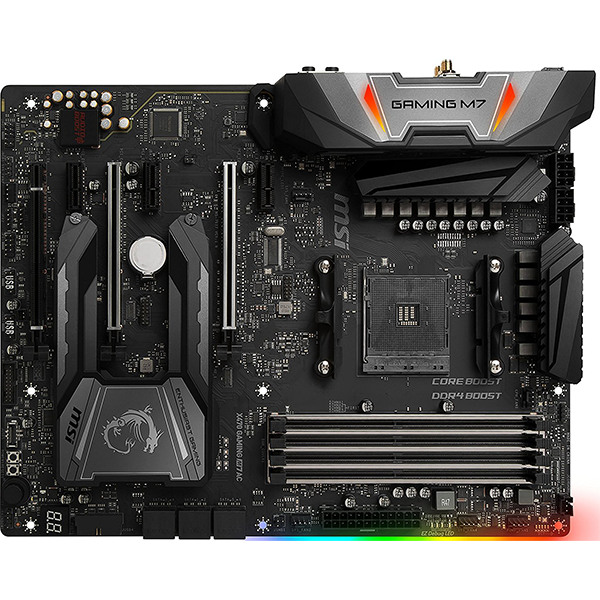
For our purposes today, we'll include our launch X470 data (which included our older test bench running a 1700X and GTX 970) just to give some perspective. Also, we're going to include results for the MSI X470 Gaming M7 AC which we're also in the processor of reviewing, to give us a complete set of X470 data for analysis today.
Also note: We are only comparing the three X470 boards against themselves for any value or performance wins here. But we do add the testing data for the 1700X into the mix to show what an older system looks like stacked up against a more modern machine. With that said, let’s look at some charts.
Test Results: Synthetics and Applications
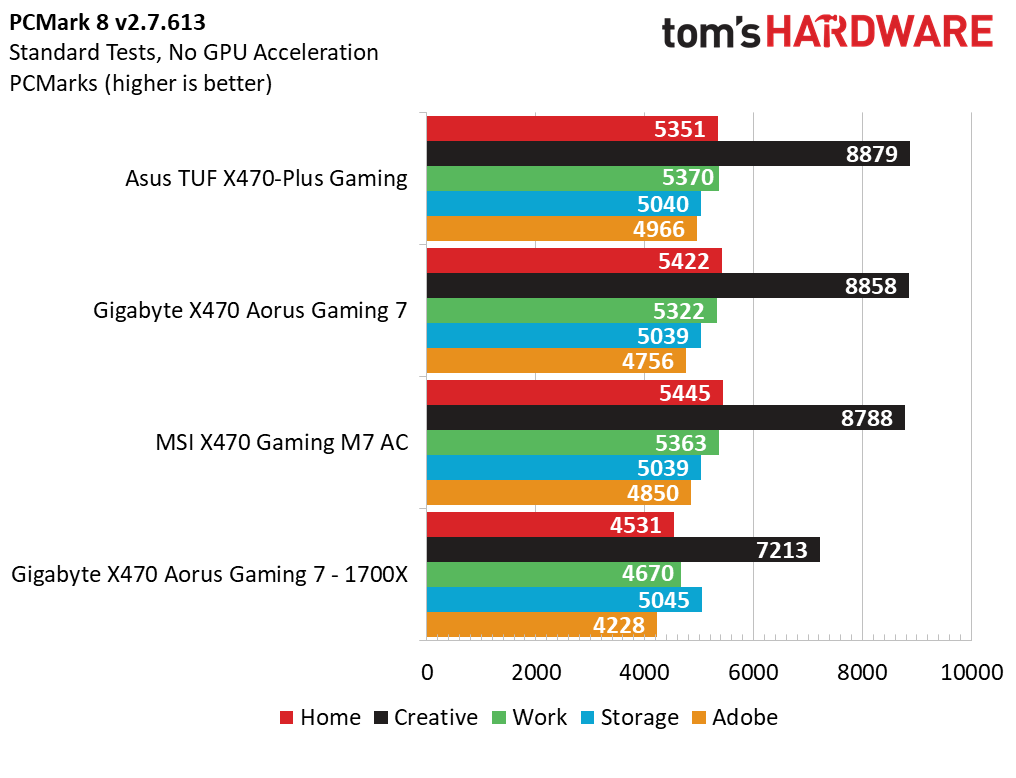
This batch of synthetics starts out with PCMark 8, and it may be the least-exciting data we’ve seen to date. Comparing all the 2700X data, we see on average only 1 percentage point separating the Gigabyte from the TUF, with the largest deltas seen in the Adobe benchmark. Comparing against 2017’s test bench, we see a much-more-substantial 9% increase in performance in all workloads except the storage suite.
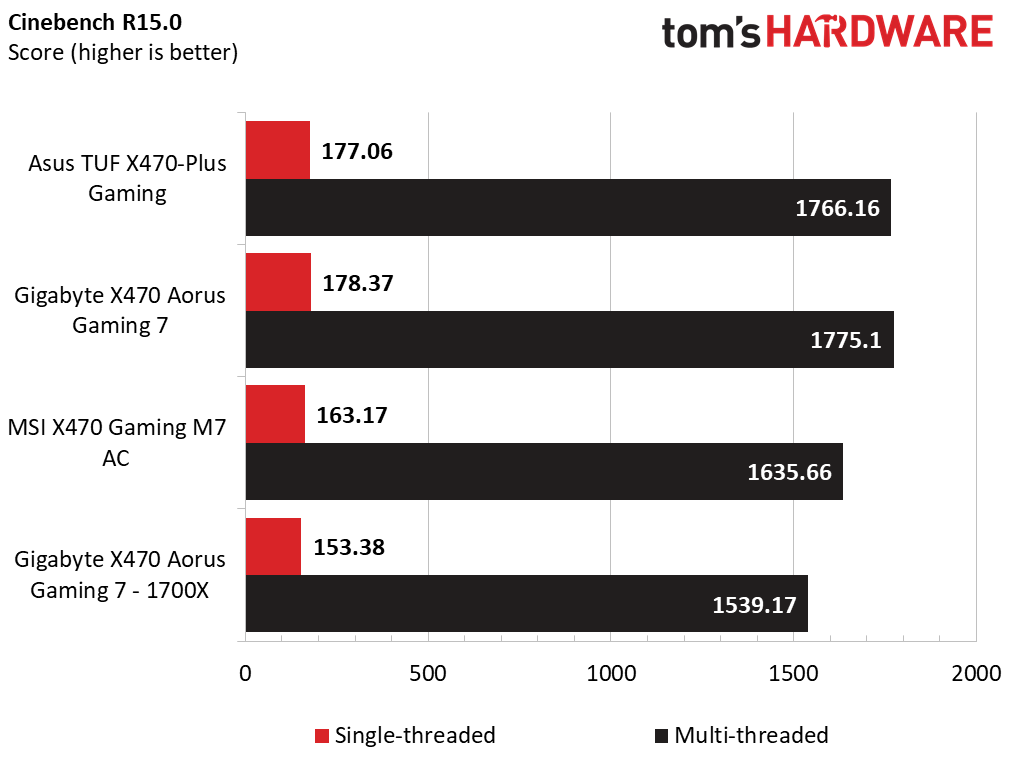
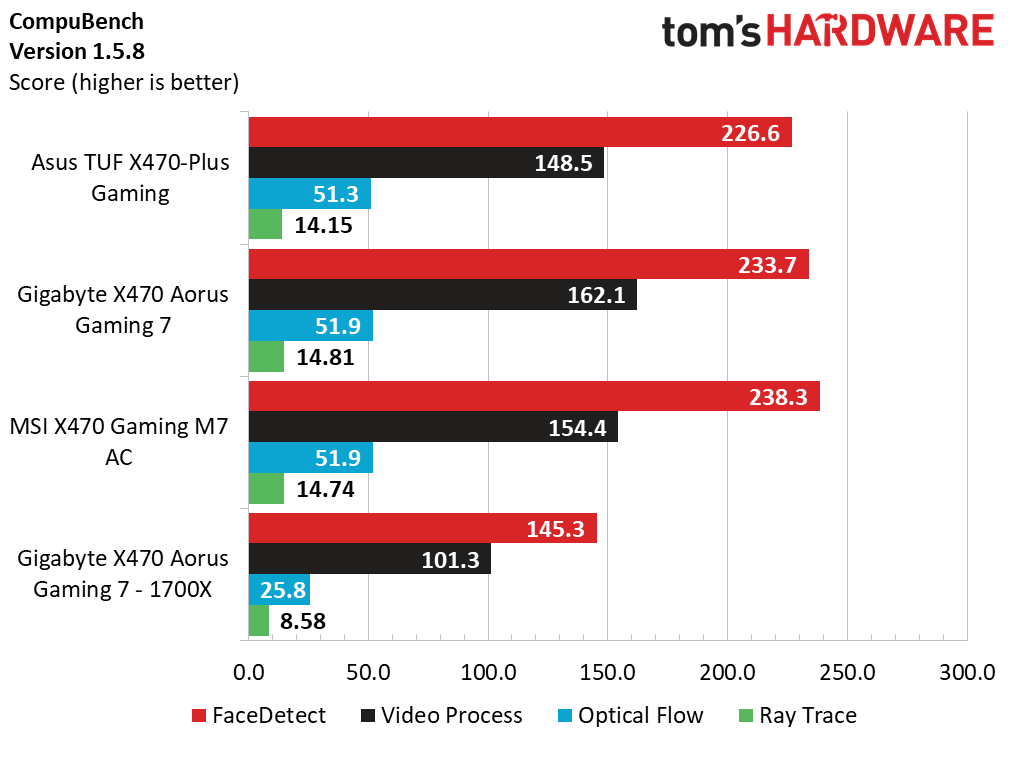
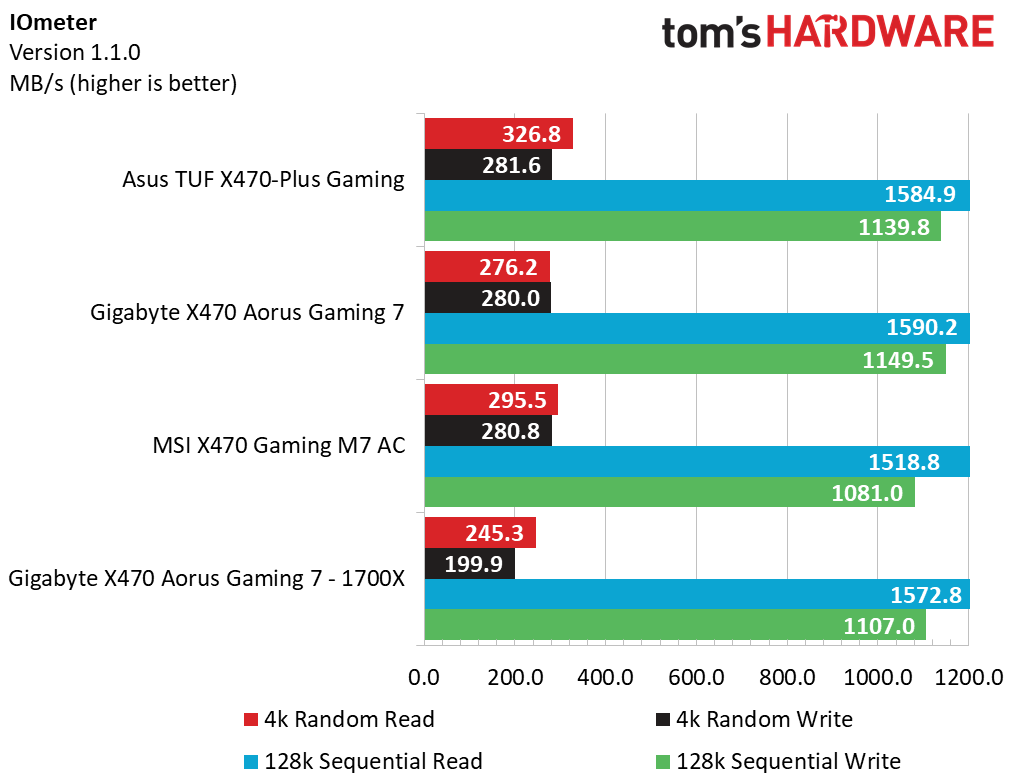
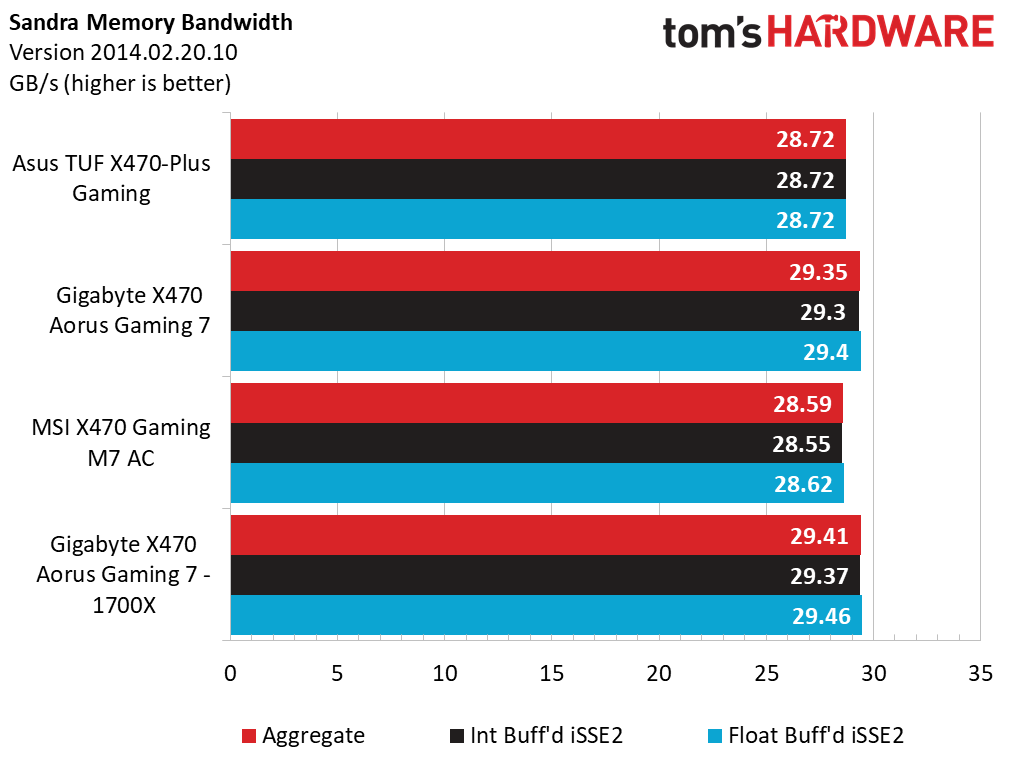
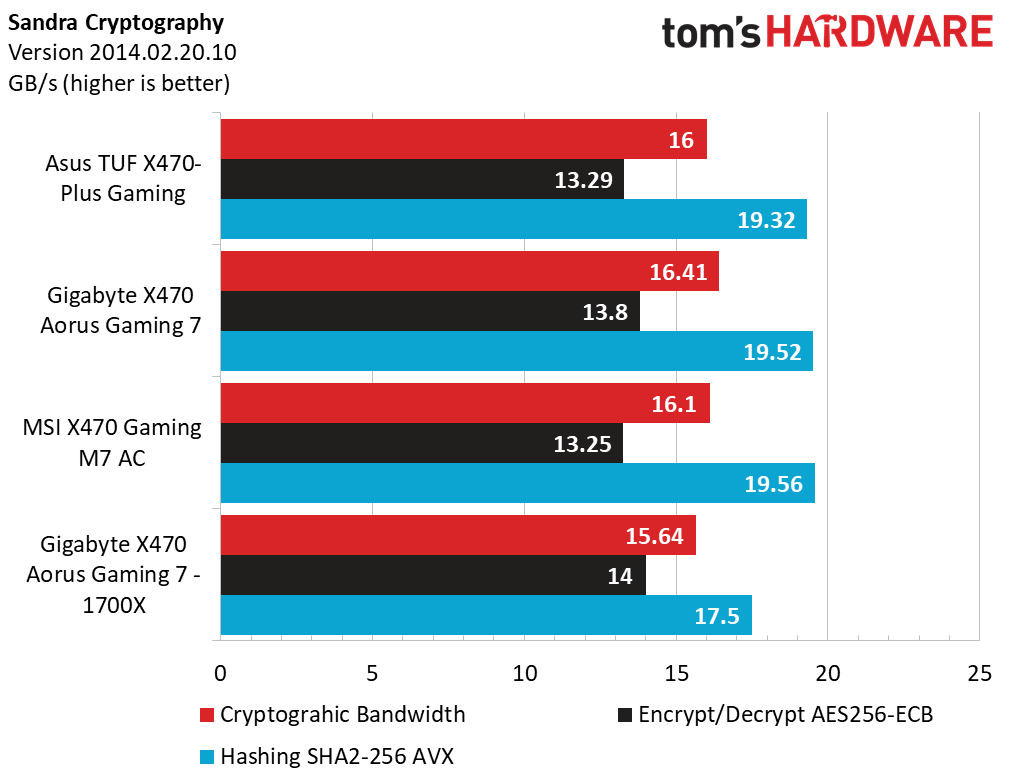
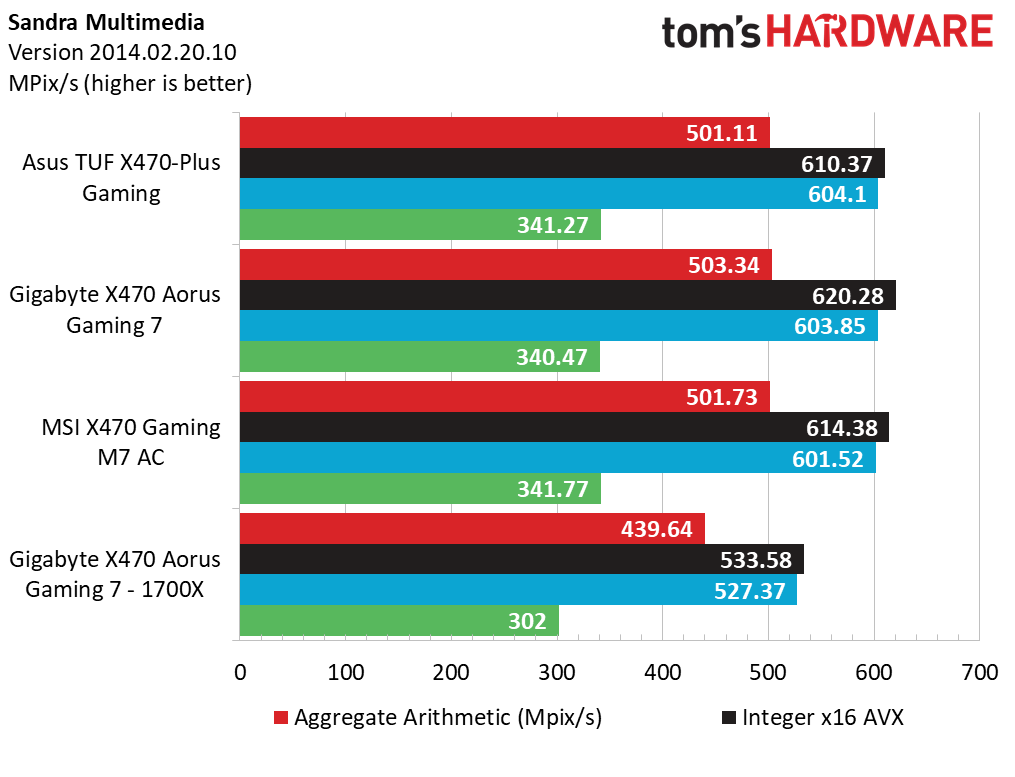
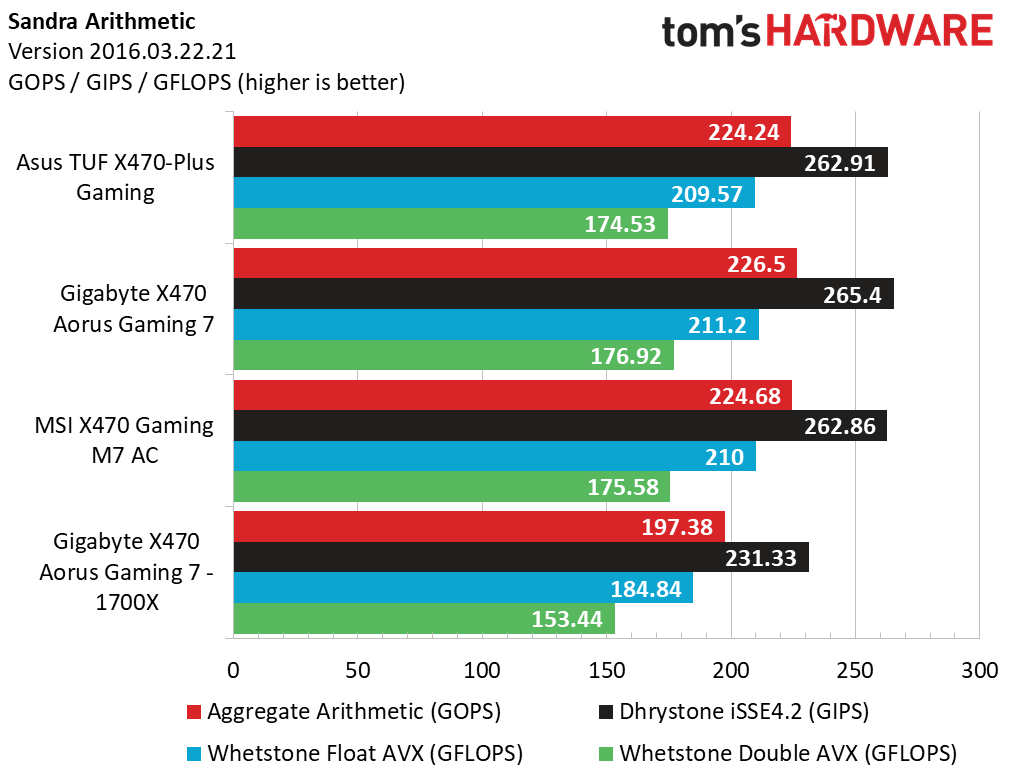
With Sandra, we see similar tight margins across all samples, but this time the Gigabyte X470 Aorus Gaming 7 comes out ahead in all but the memory suite. The Asus stumbles across the finish line in Sandra, but excels in the IOmeter test. We see some very odd results with our Cinebench run, where the MSI sample takes a pretty drastic hit in performance of roughly 8 percent compared to the Asus and Gigabyte samples. MSI does stand up to the challenge though, showing strong results with Compubench. But the Asus TUF X470-Plus Gaming takes another last place finish among the GTX 1080 systems.
Get Tom's Hardware's best news and in-depth reviews, straight to your inbox.
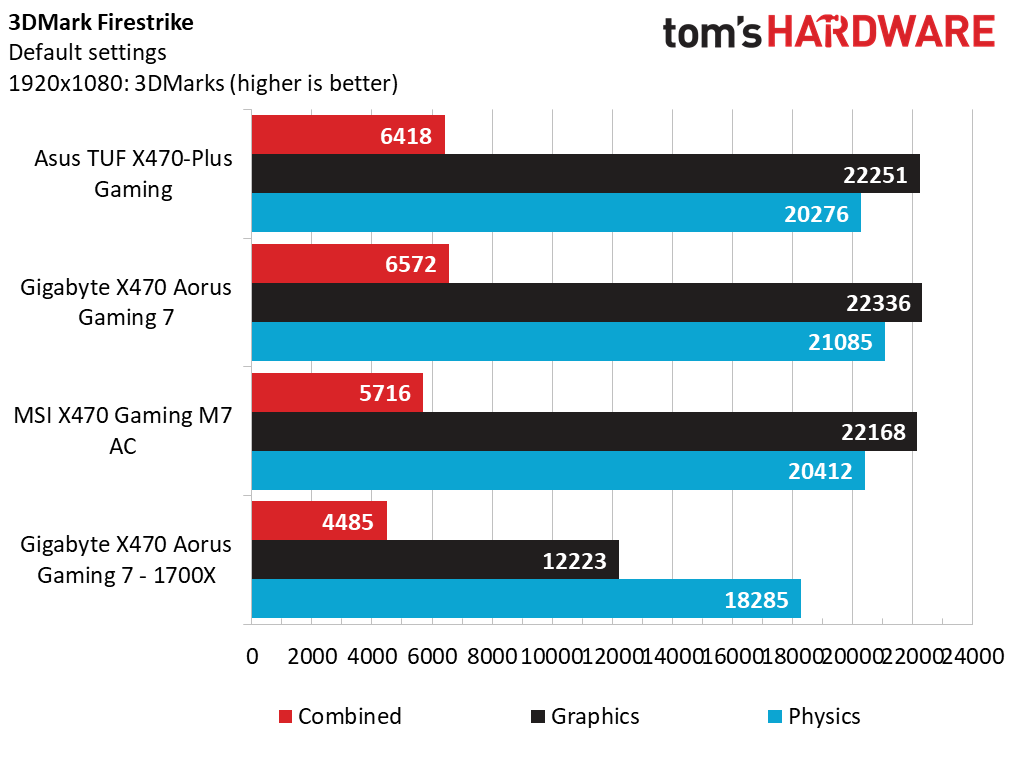
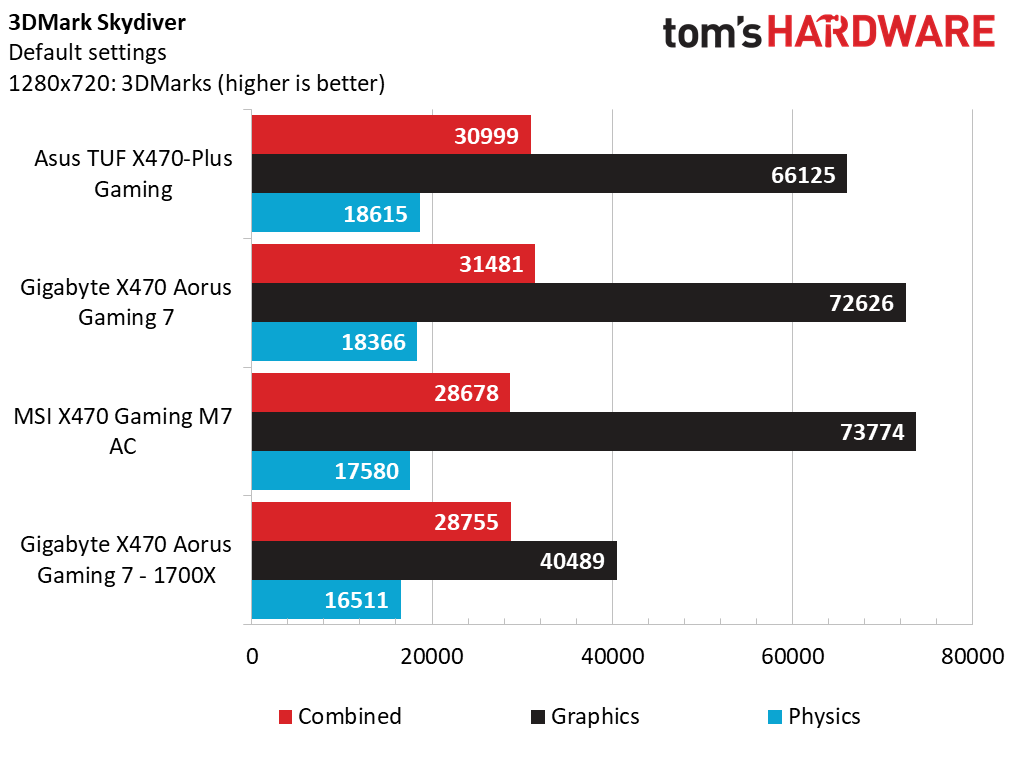
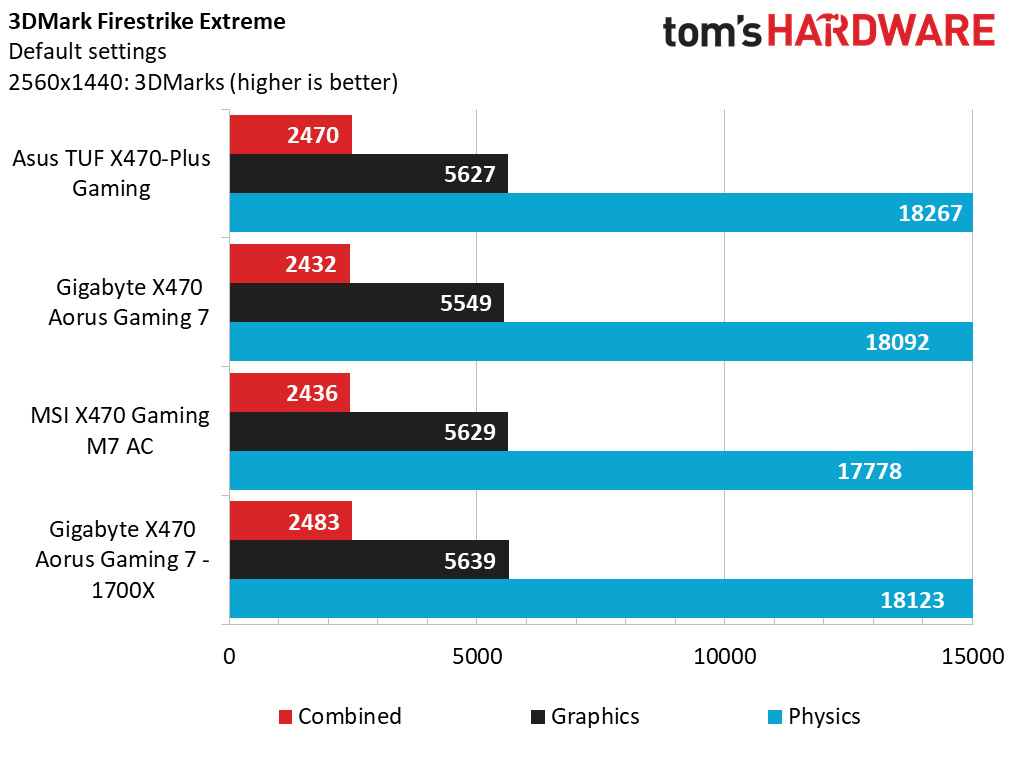
Our gaming synthetics consist of 3DMark’s Skydiver, Firestrike, and Firestrike Extreme, which are all pretty light for this system. The TUF takes second place in Skydiver and Firestrike, but it appears that not even the updated processor or graphics card can help lift our 1440p results of Firestrike Extreme. It's interesting to note that the Asus TUF X470-Plus Gaming takes a hit with Graphics in Skydiver. The physics score helps lift the Combined metric up, showing a pretty good balance for the platform as a whole.
In application tests, the Asus and Gigabyte samples fare well with Handbrake, besting the MSI by nearly four minutes and rendering the Sintel 4k video. The TUF Alliance board shows promising results with the Adobe suite, with the MSI sample starting to pick up steam. Asus continues to take the top spot with the Productivity apps and File Compression shows a 7 second win before the trailing competitor.
With Synthetic performance like this, the Asus TUF X470-Plus Gaming is off to a good start in our test bench. With any luck, the trend will continue in its intended environment: real-world gaming.
MORE: Best Motherboards
MORE: How To Choose A Motherboard
MORE: All Motherboard Content
Current page: Test Configuration & Benchmark Results
Prev Page UEFI: Asus' Ace in the Alliance Next Page Test Results: Games, Performance & Power-
Soda-88 So you're telling me that a motherboard with far more inefficient VRM due to lack of phases (31W higher consumption than Gaming 7 in Prime/Furmark) is a good overclocking board? Have you measured the VRM temperatures at all?Reply
This motherboard is a ticking timebomb if you plan on running 8 core CPU at high utilization.
Another thing regarding this motherboard in particular is that it shares the same VRM design with $75 ASUS motherboards (with addition of better capacitors, which in no way redeems the inadequacy of VRM in general).
Prime X470 Pro VRM is quite significantly better (it's the same VRM as on Strix SKUs) and it comes at nearly the same price.
For more info watch this:
https://www.youtube.com/watch?v=pq0MLtjFS1A -
Calculatron I'm not sure how I feel about the TUF brand being re-purposed like this. I'm sure that it made sense to ASUS to use an existing, and popular, type of branding to cover a market segment. The marketing and accounting departments probably thought it was a win, and no doubt profits will reflect that. Let us hope that, in the future, there is room to create a class of no-nonsense overclocking boards.Reply -
TheTerk Reply
I don't know if you're trolling me, but I clearly state this in the overclocking section....21177573 said:So you're telling me that a motherboard with far more inefficient VRM due to lack of phases (31W higher consumption than Gaming 7 in Prime/Furmark) is a good overclocking board? Have you measured the VRM temperatures at all?
This motherboard is a ticking timebomb if you plan on running 8 core CPU at high utilization.
Another thing regarding this motherboard in particular is that it shares the same VRM design with $75 ASUS motherboards (with addition of better capacitors, which in no way redeems the inadequacy of VRM in general).
Prime X470 Pro VRM is quite significantly better (it's the same VRM as on Strix SKUs) and it comes at nearly the same price.
For more info watch this:
https://www.youtube.com/watch?v=pq0MLtjFS1A
At these settings our Vreg heatsinks were starting to reach 131 C, so you'll want to pick a board with higher phase counts and bigger heatsinks for prolonged overclocks.
-
Anheanz I purchased this mobo from my local Microcenter and it was DOA. It was promptly replaced with a Gigabyte x470 gaming 5Reply -
jpe1701 It seems like the vrms on the AMD boards are worse than Intel. At least the mid range and down anyways. I have the x370 taichi and the quality is fantastic though, the only thing lacking is the new agesa code bios update hasn't been released yet. All the other Asrock am4 motherboards have it.Reply
