Why you can trust Tom's Hardware
Protection Features
Check out our PSUs 101 article to learn more about PSU protection features.
| OCP (Cold @ 26°C) | 12V: 63.4A (138.43%), 11.921V 5V: 36A (180%), 5.106V 3.3V: 39A (156%), 3.321V 5VSB: 4.8A (160%), 5.030V |
| OCP (Hot @ 37°C) | 12V: 63A (137.55%), 11.948V 5V: 36A (180%), 5.119V 3.3V: 39A (156%), 3.322V 5VSB: 4.8A (160%), 5.028V |
| OPP (Cold @ 26°C) | 732.52W (133.19%) |
| OPP (Hot @ 37°C) | 660.41W (120.07%) |
| OTP | ✓ (110°C @ 12V Heat Sink) |
| SCP | 12V to Earth: ✓ 5V to Earth: ✓ 3.3V to Earth: ✓ 5VSB to Earth: ✓ -12V to Earth: ✓ |
| PWR_OK | Accurate but lower than 16ms |
| NLO | ✓ |
| SIP | Surge: MOV Inrush: NTC Thermistor |
The OCP triggering points are set high on all rails, especially the minor ones. Great Wall ignored setting up the minor rails properly. Who needs so many amps on them? On the contrary, the over power protection is set correctly.
DC Power Sequencing
According to Intel’s most recent Power Supply Design Guide (revision 1.4), the +12V and 5V outputs must be equal to or greater than the 3.3V rail at all times. Unfortunately, Intel doesn't mention why it is so important to always keep the 3.3V rail's voltage lower than the levels of the other two outputs.
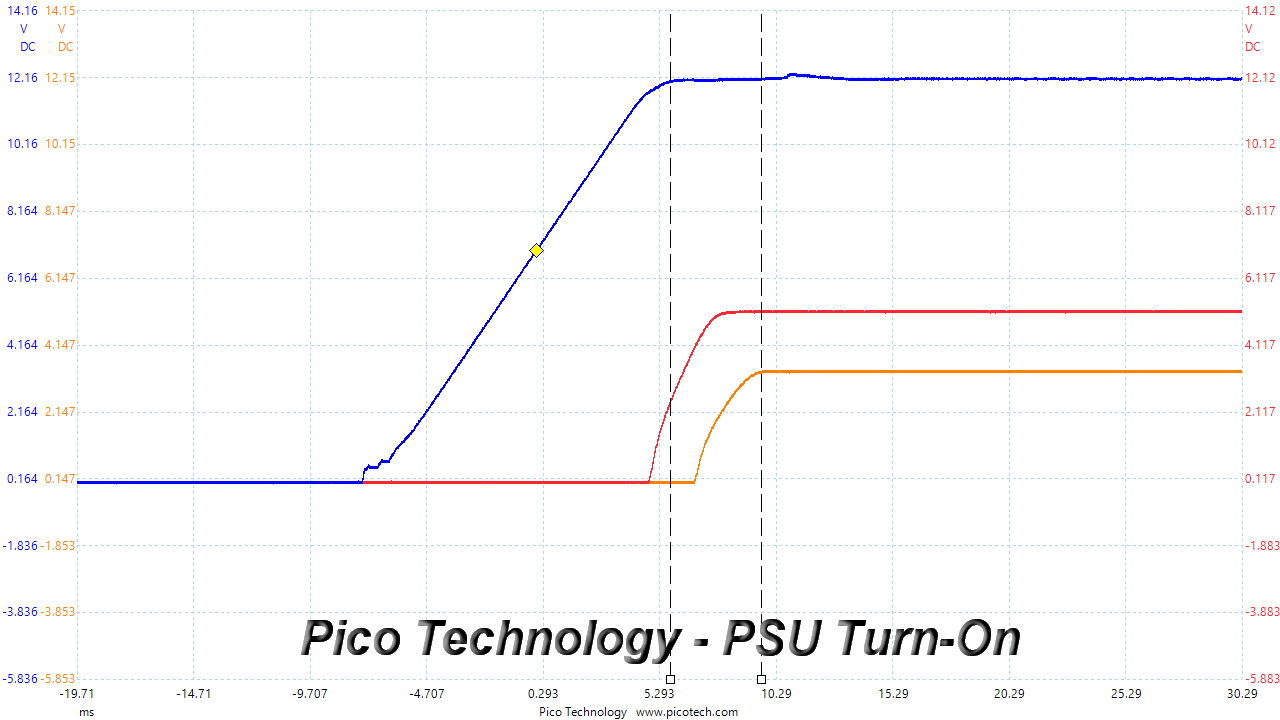
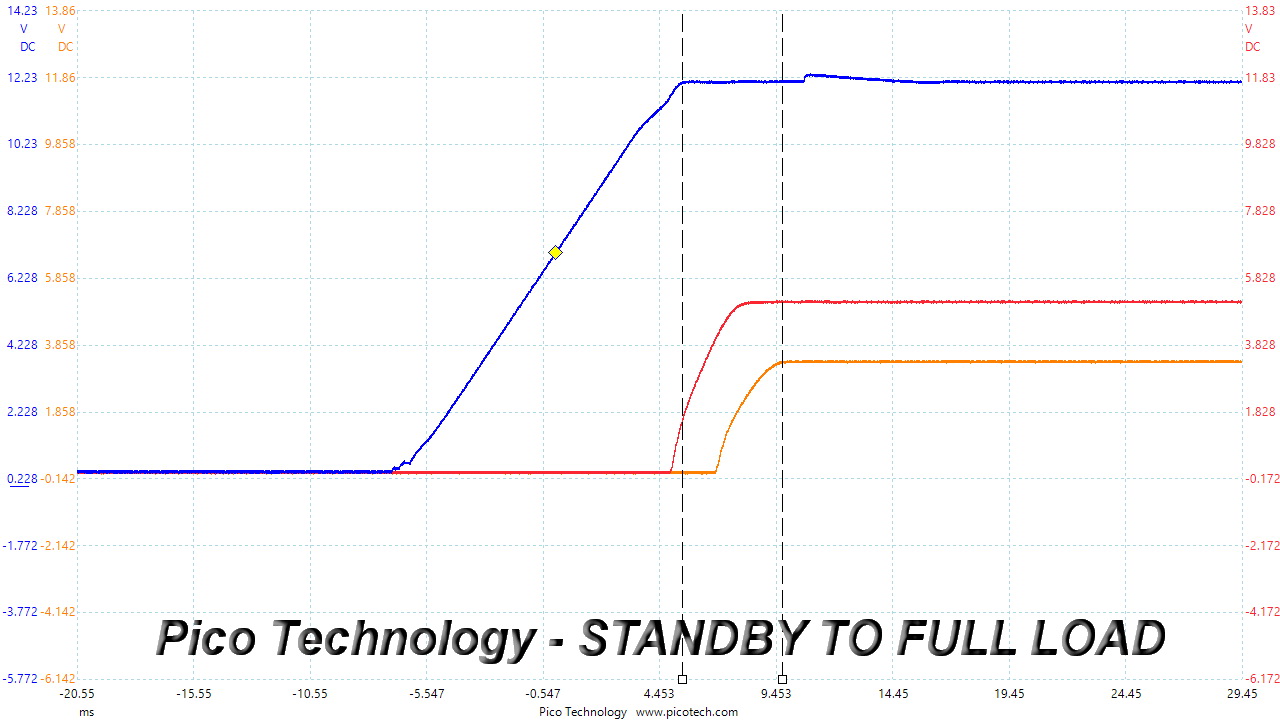
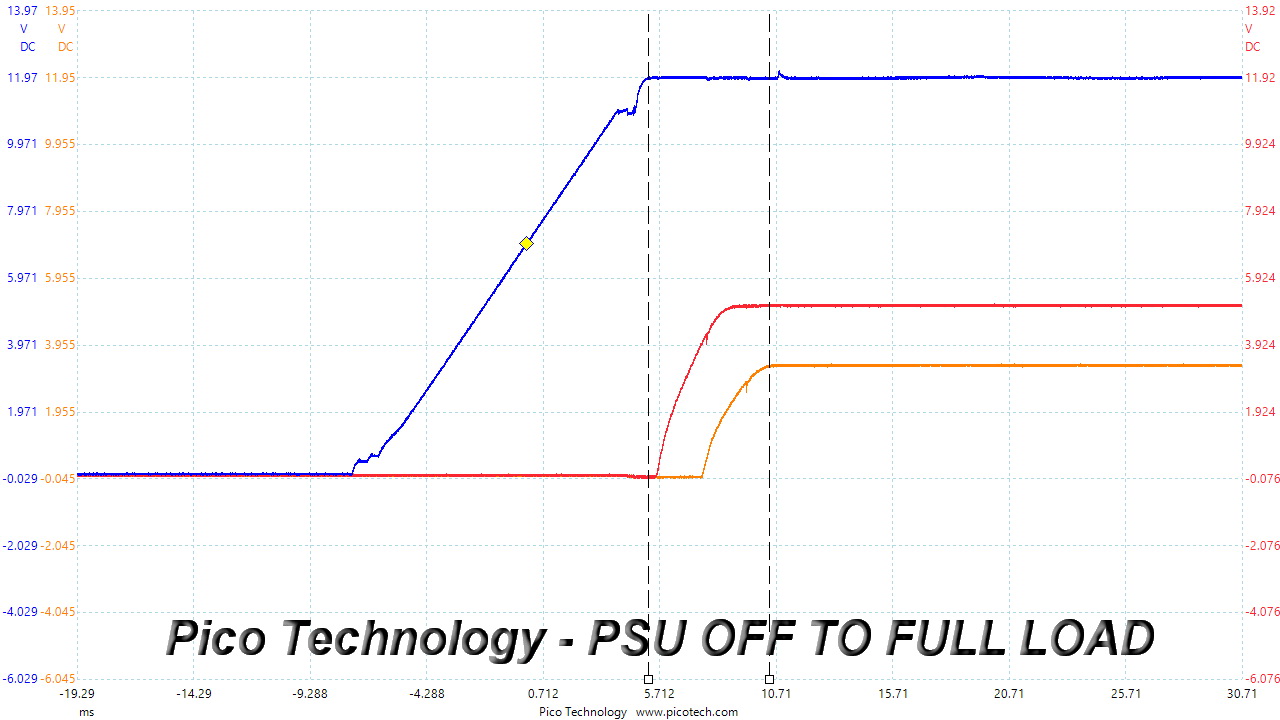
No problems here since the 3.3V rail is always lower than the other two.
Cross Load Tests
To generate the following charts, we set our loaders to auto mode through custom-made software before trying more than 25,000 possible load combinations with the +12V, 5V, and 3.3V rails. The deviations in each of the charts below are calculated by taking the nominal values of the rails (12V, 5V, and 3.3V) as point zero. The ambient temperature during testing was between 30 to 32 degrees Celsius (86 to 89.6 degrees Fahrenheit).
Load Regulation Charts
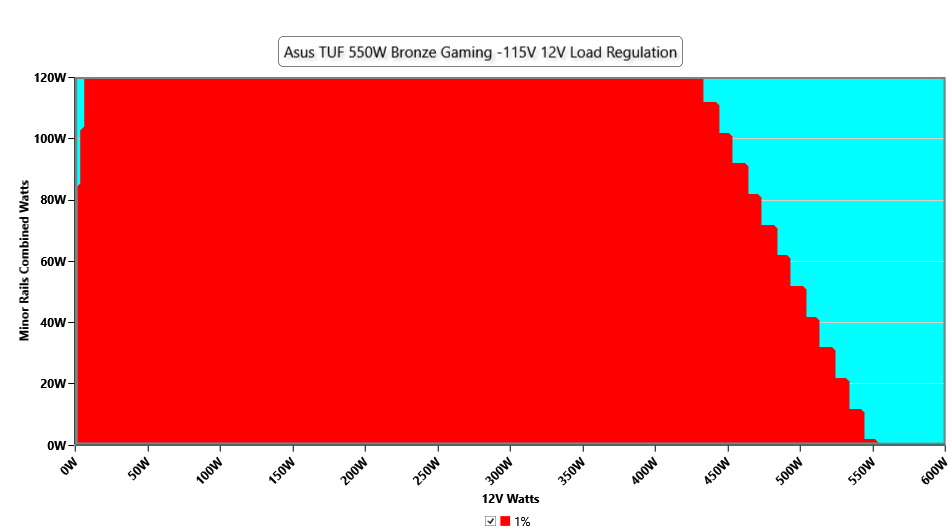
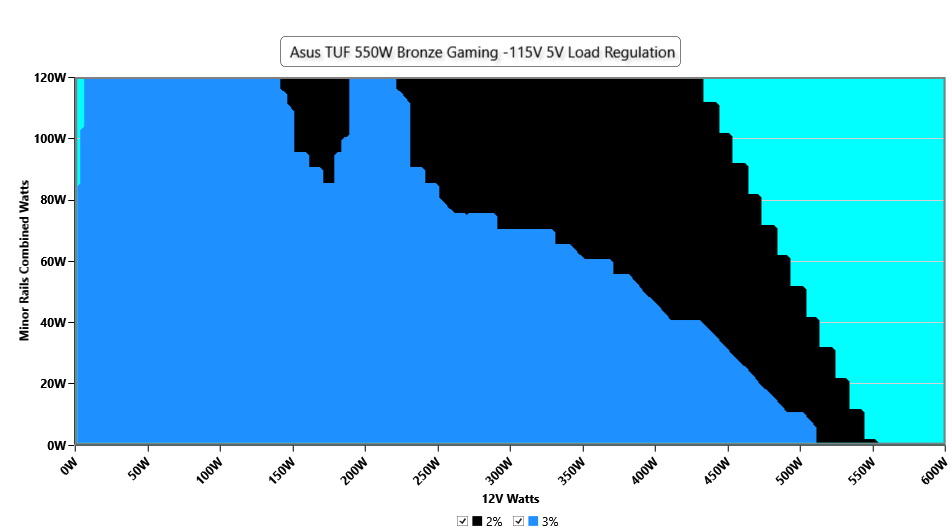
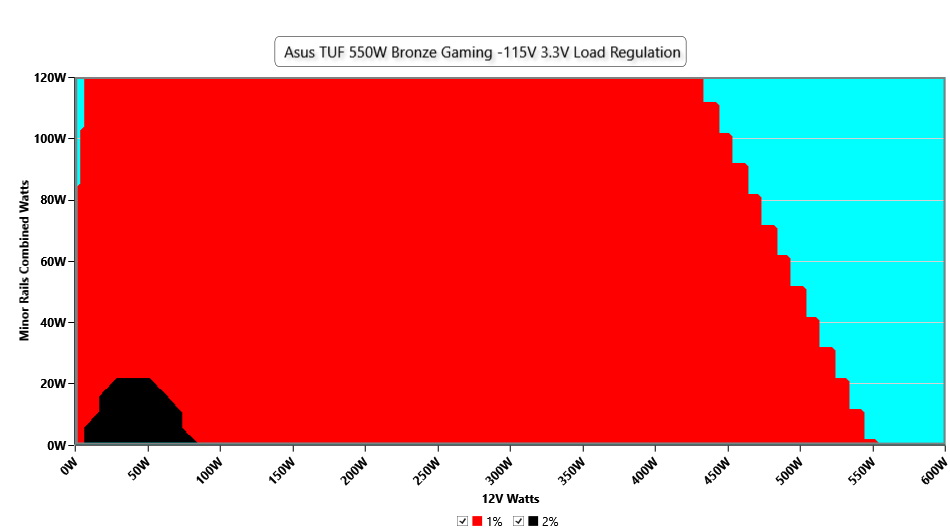
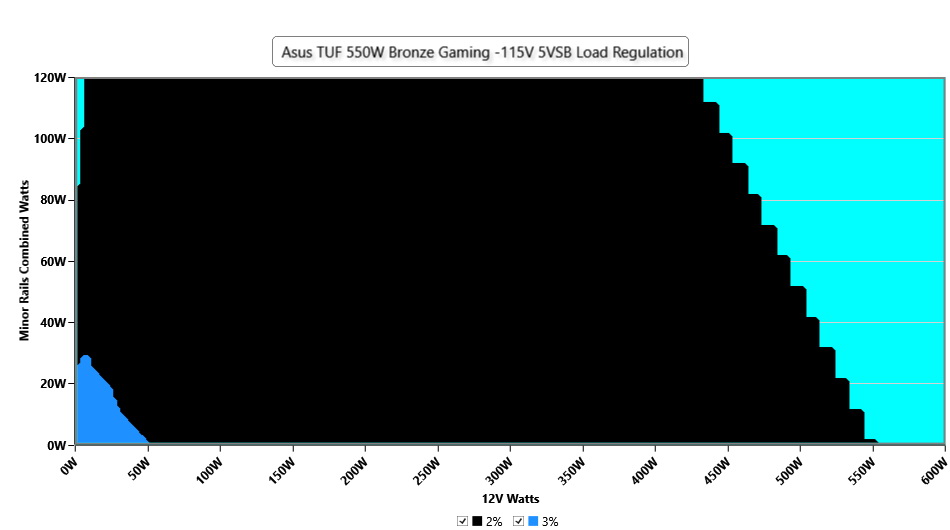
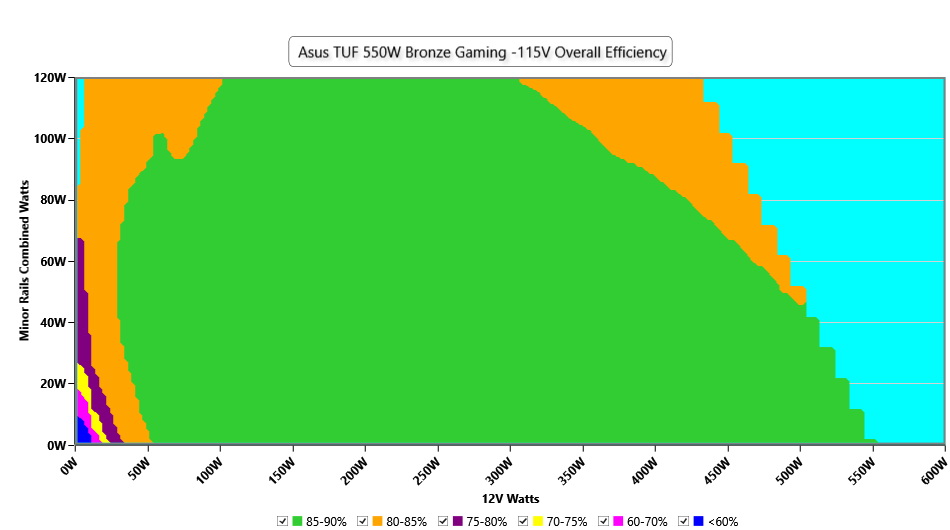
Efficiency Graph
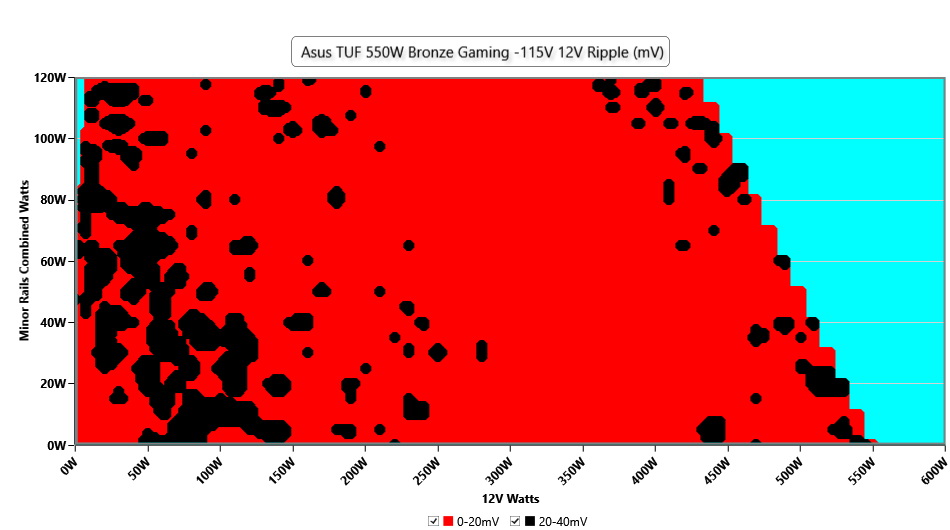
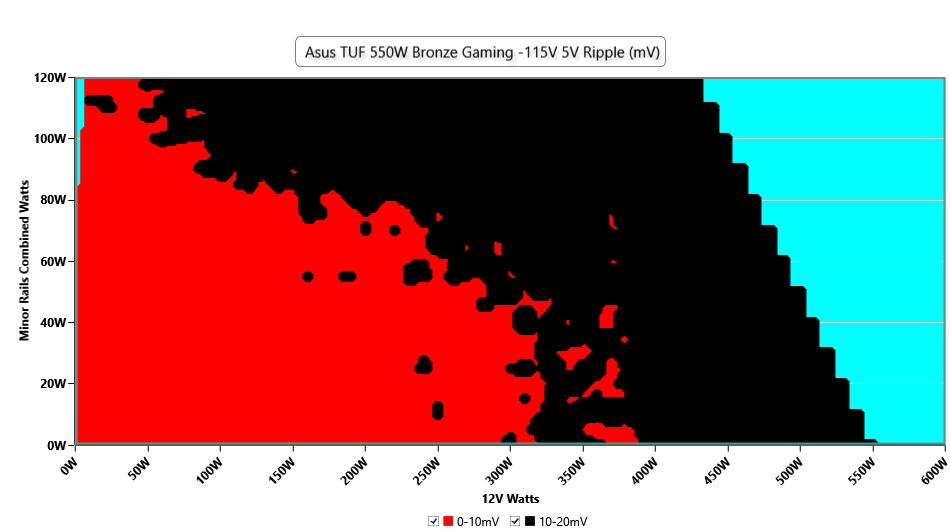
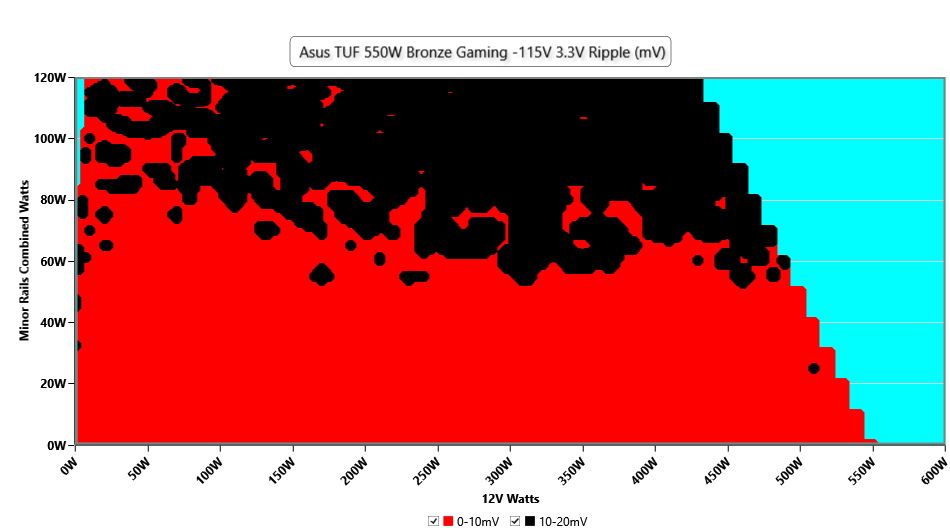
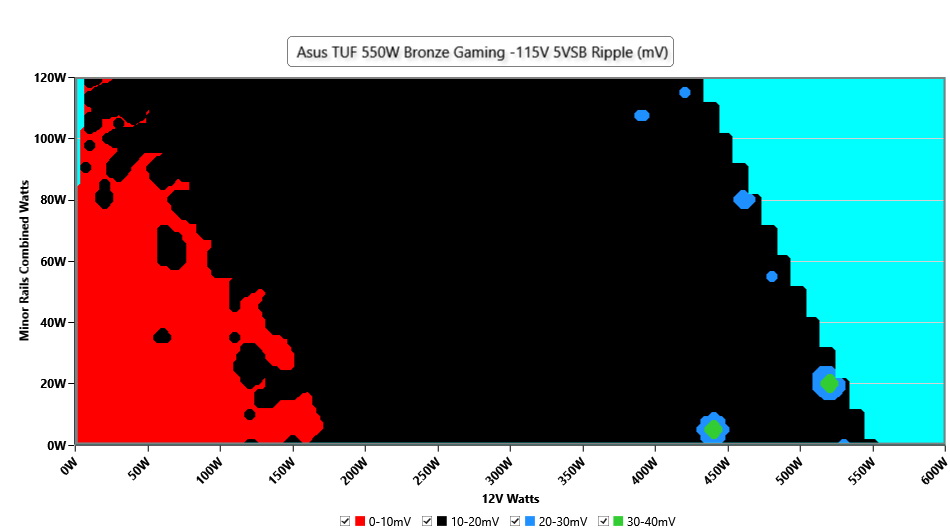
Ripple Graphs
The lower the power supply's ripple, the more stable the system will be and less stress will also be applied to its components.
Infrared Images
We apply a half-load for 10 minutes with the PSU's top cover and cooling fan removed before taking photos with a modified Fluke Ti480 PRO camera able to deliver an IR resolution of 640x480 (307,200 pixels).
Get Tom's Hardware's best news and in-depth reviews, straight to your inbox.
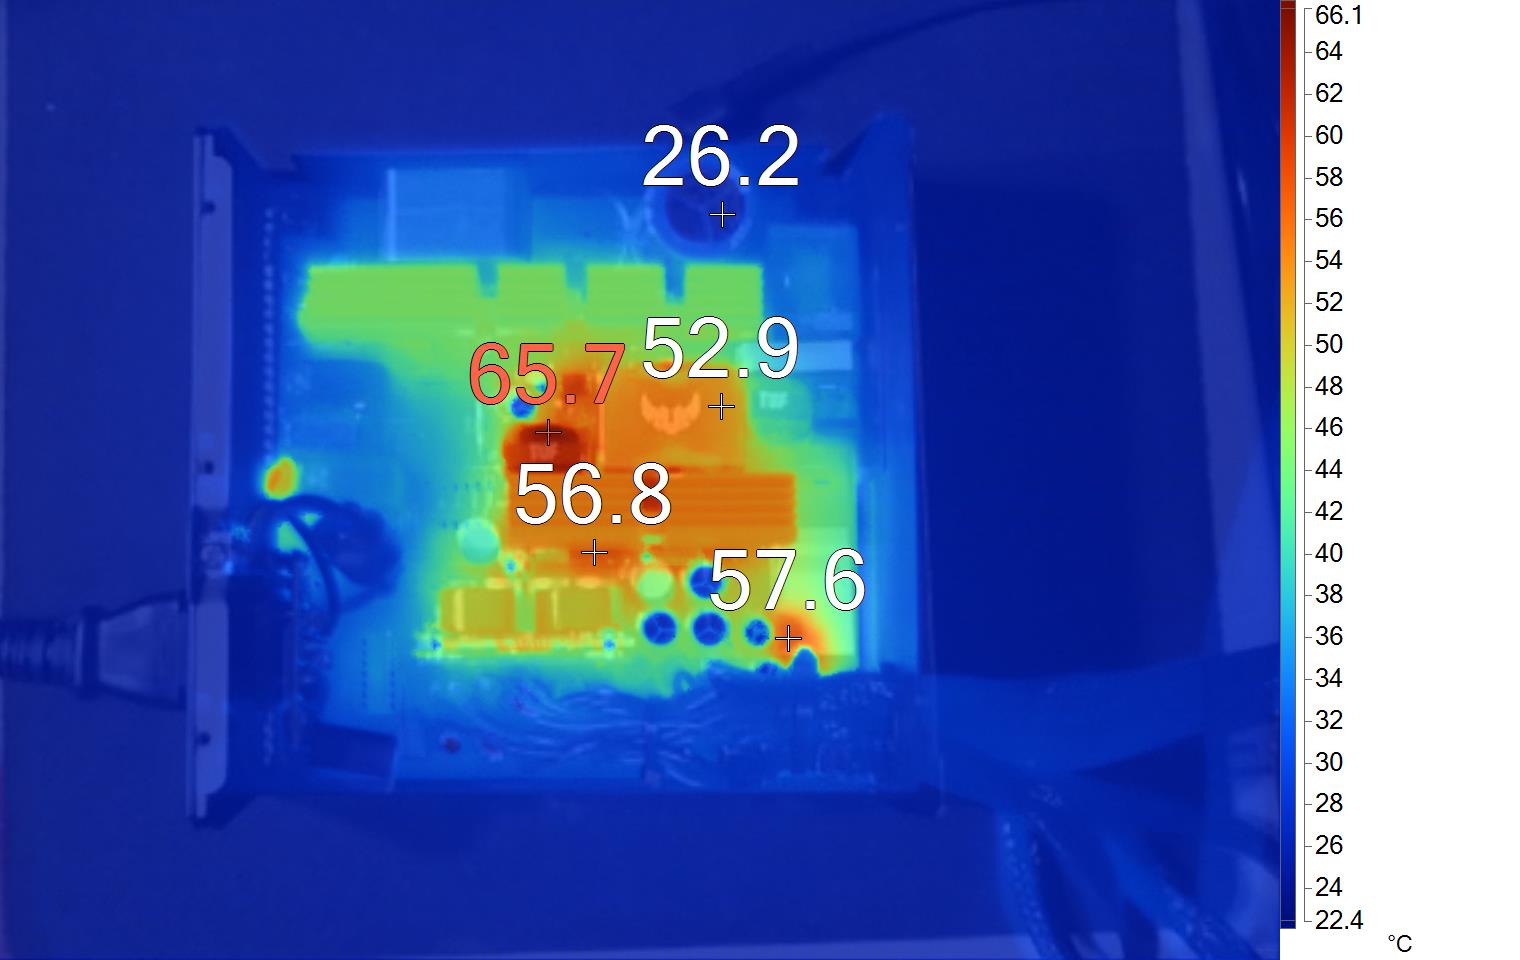
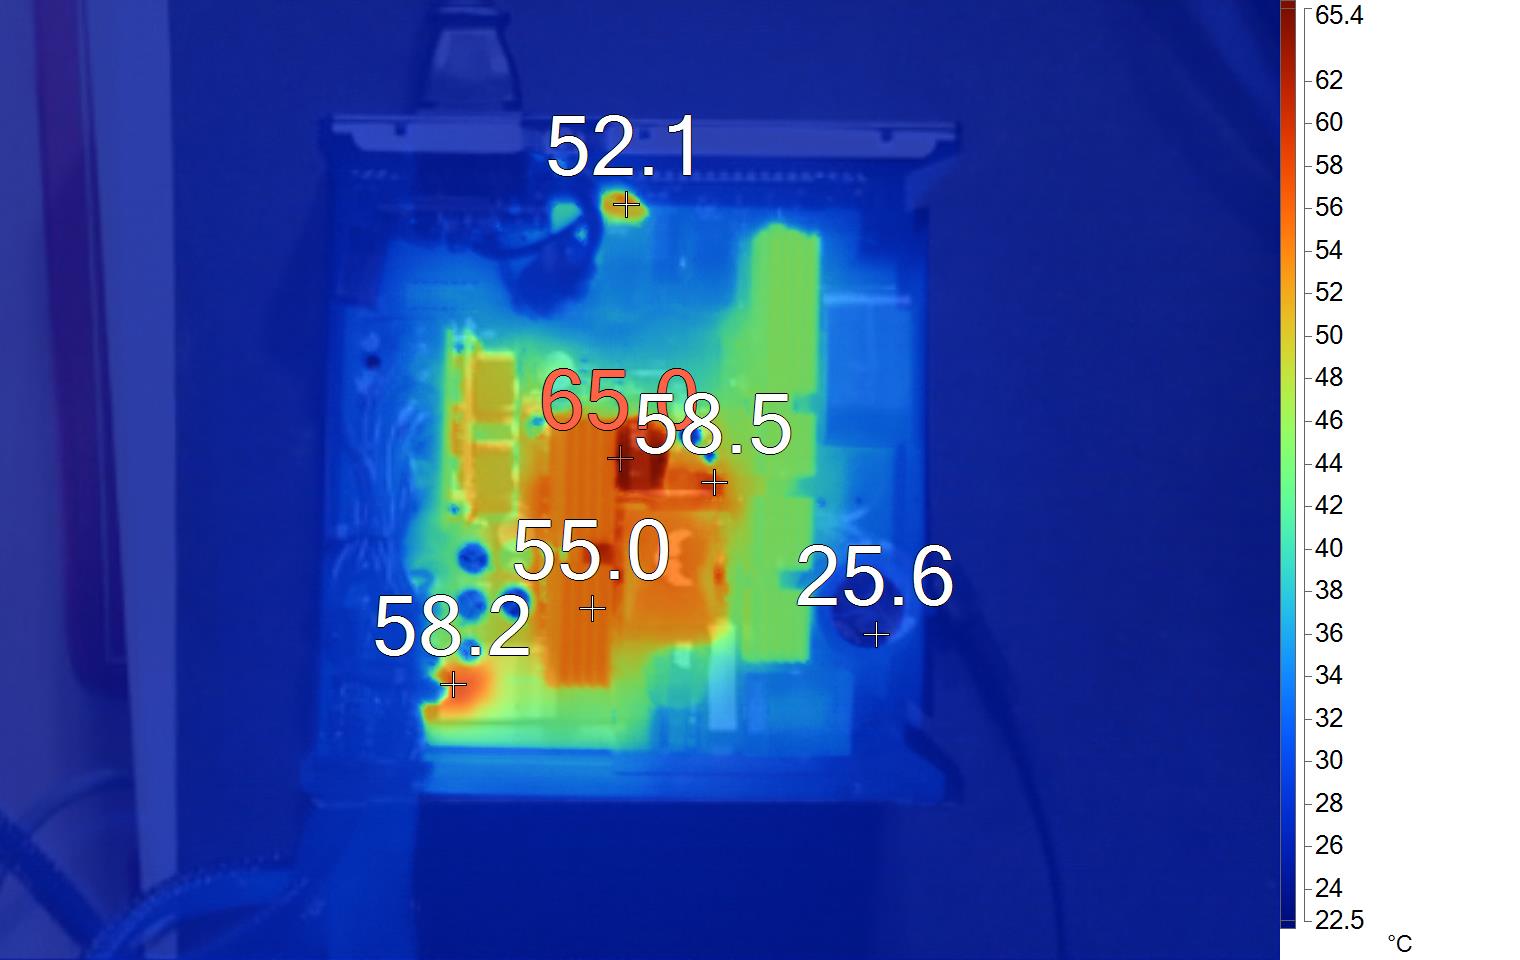
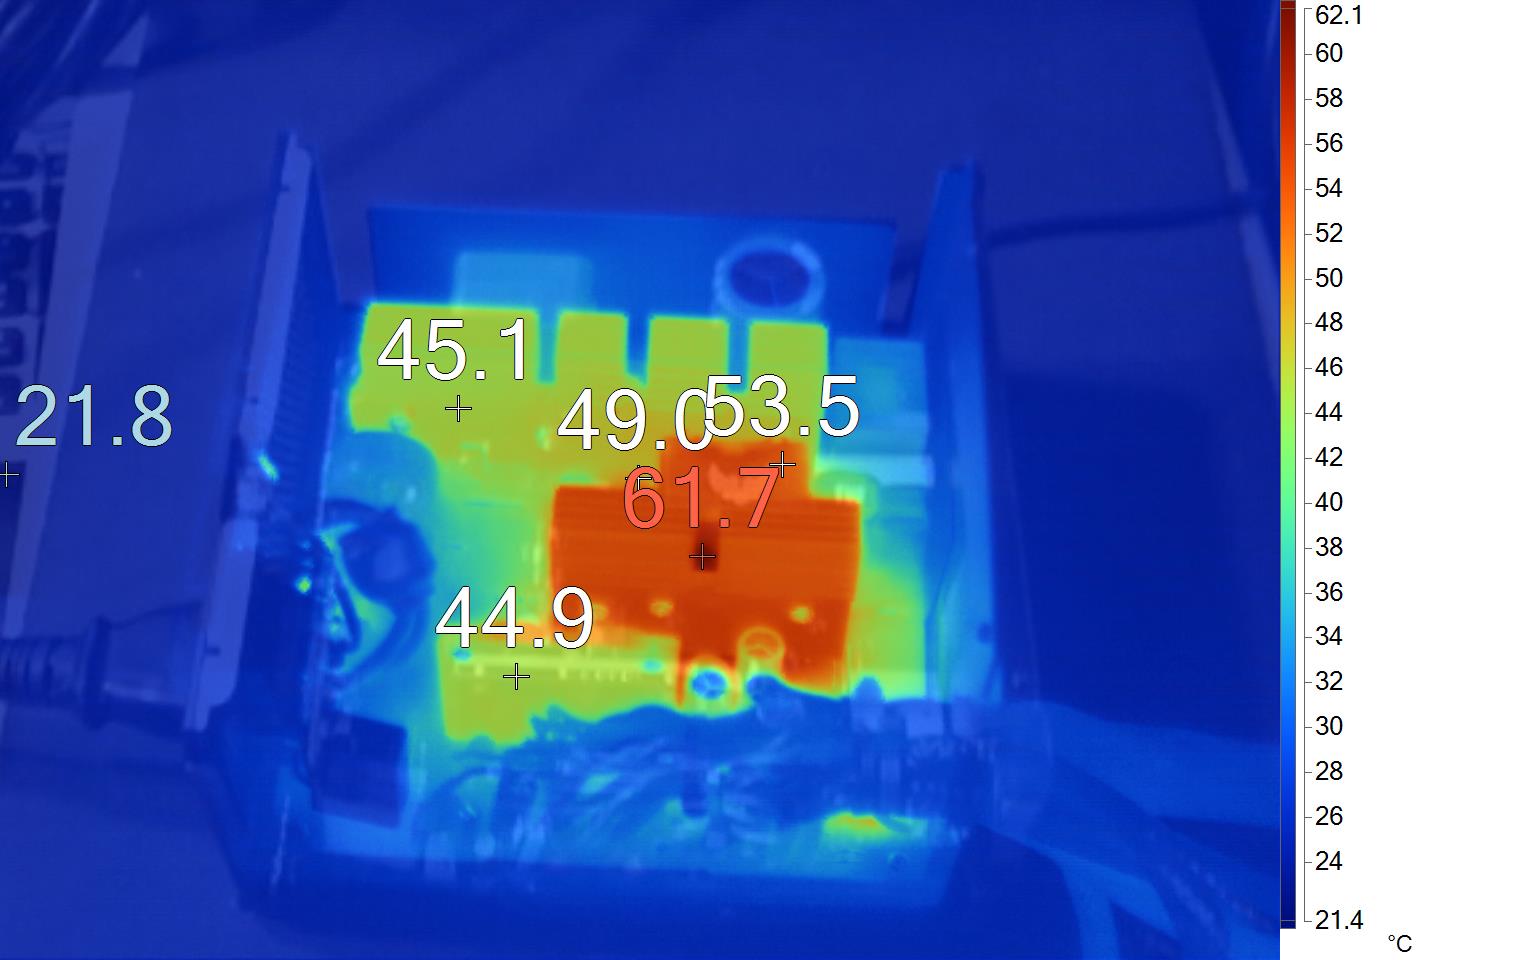
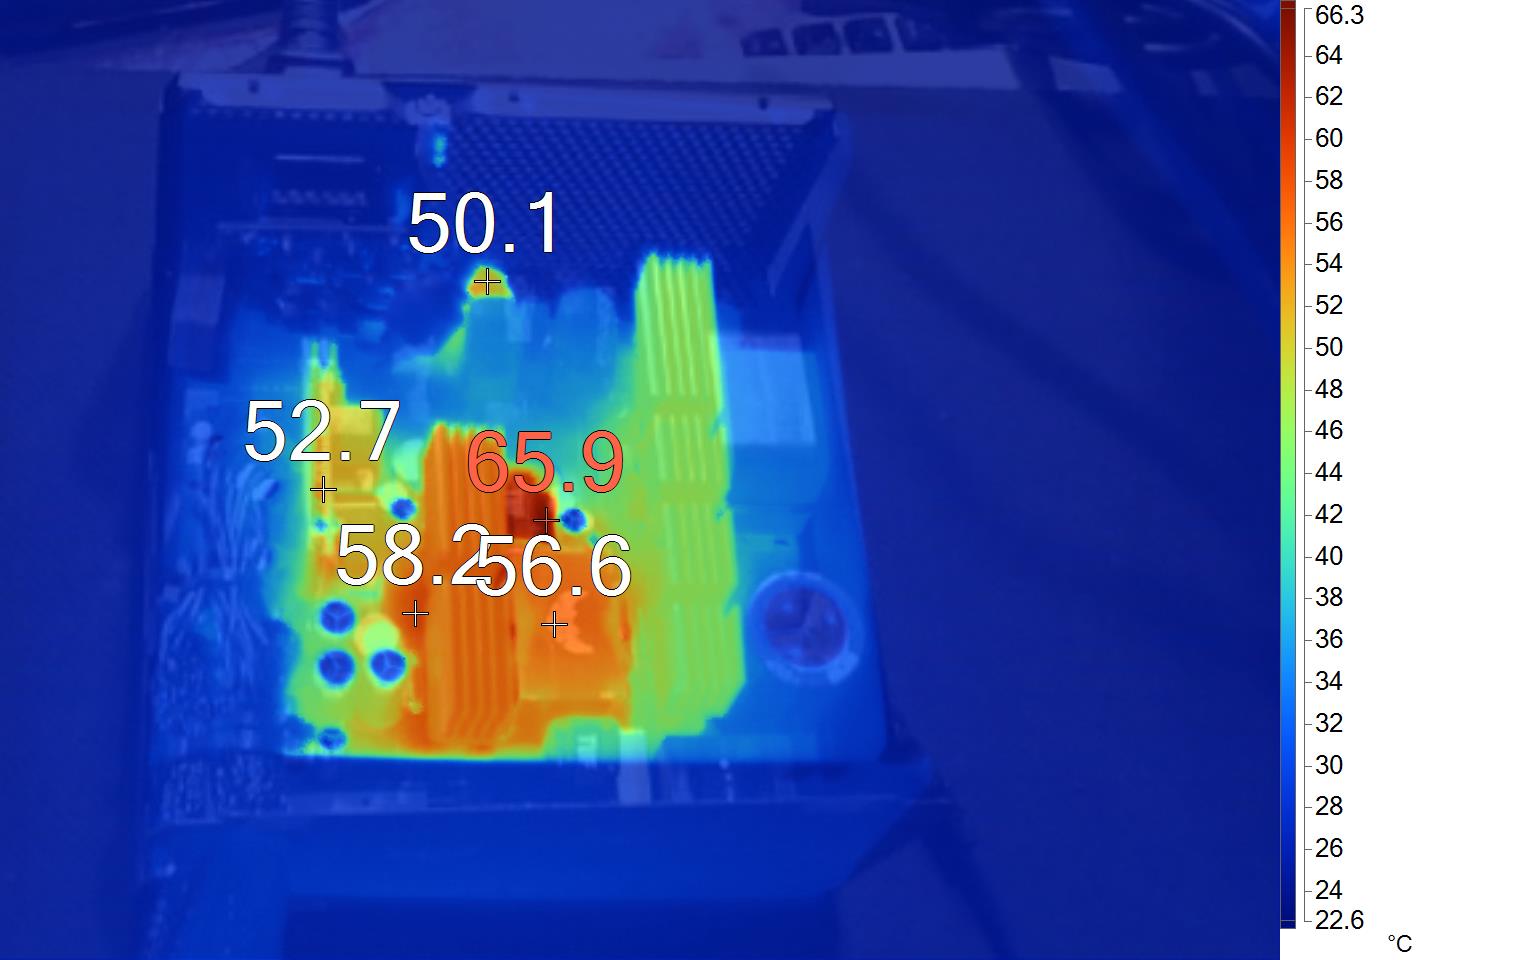
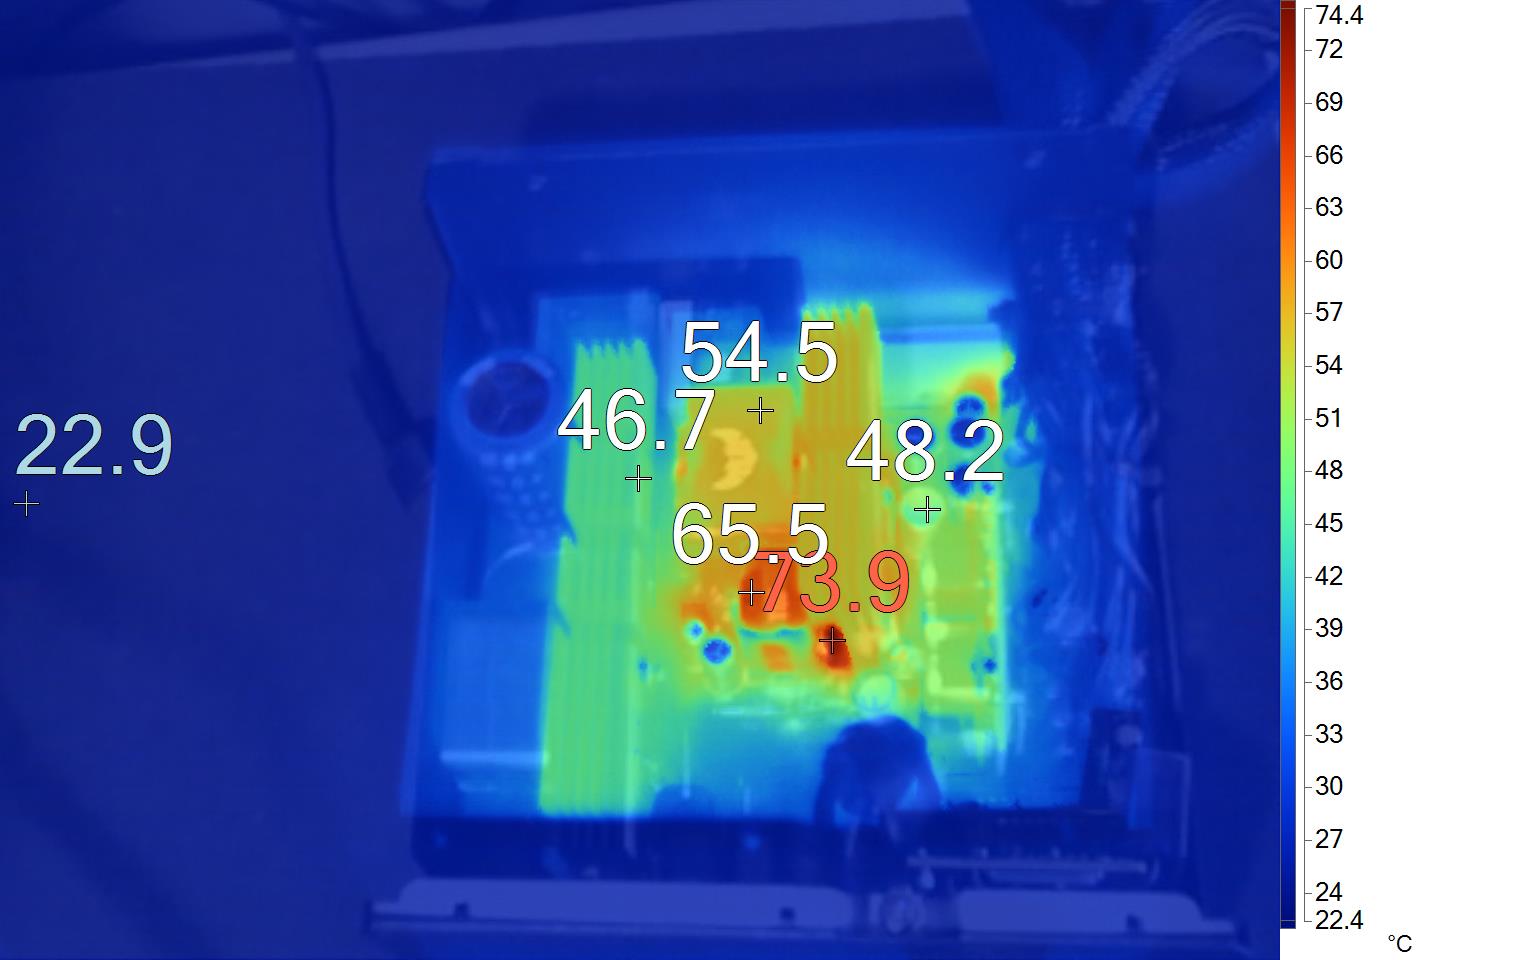
We didn't notice any high temperature spots inside the PSU, during this test session.
MORE: Best Power Supplies
MORE: How We Test Power Supplies
MORE: All Power Supply Content
Current page: Protection Features, DC Power Sequencing, Cross-Load Tests and Infrared Images
Prev Page Load Regulation, Hold-Up Time, Inrush & Leakage Current, Efficiency and Noise Next Page Transient Response Tests, Timing Tests, Ripple Measurements and EMC Pre-Compliance Testing
Aris Mpitziopoulos is a contributing editor at Tom's Hardware, covering PSUs.
-
Co BIY Is the large amount of concern about capacitor quality still valid ?Reply
Is there any evidence that Japanese caps are a lot better than Chinese brands in 2023 ? -
Soaptrail I know it has that Cybenetics Siler++ but still a bronze. I would only consider a Platinum or Titanium at this point.Reply -
digitalgriffin Highly disappointing on the quality of the caps. There was a time TUF branding meant higher quality components for longevity. Now it's just a sales tag with no meaning.Reply -
digitalgriffin ReplyCo BIY said:Is the large amount of concern about capacitor quality still valid ?
Is there any evidence that Japanese caps are a lot better than Chinese brands in 2023 ?
Yes. They are still made of paste. Paste, barrier, and sealing are NOT the same. Compare a RMx or Seasonic which come with 10 year warranties. They are 100% Japanese capacitors. Kind of says a lot.
