FSP Aurum PT 1000W Power Supply Review
FSP's Aurum PT series PSUs are 80 PLUS Platinum-certified and fully modular. Today we will take a look at the series' 1000W mid-level unit.
Why you can trust Tom's Hardware
Cross-Load Tests And Infrared Images
Our cross-load tests are described in detail here.
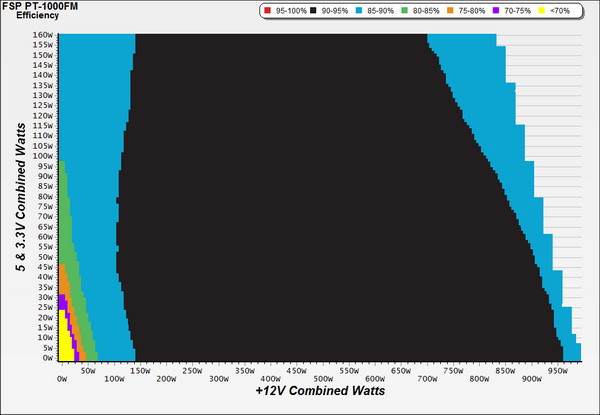
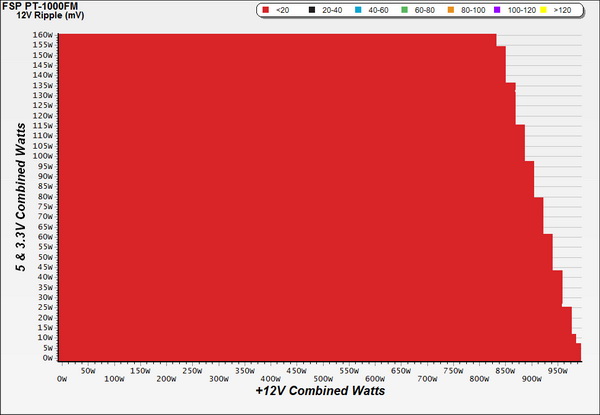
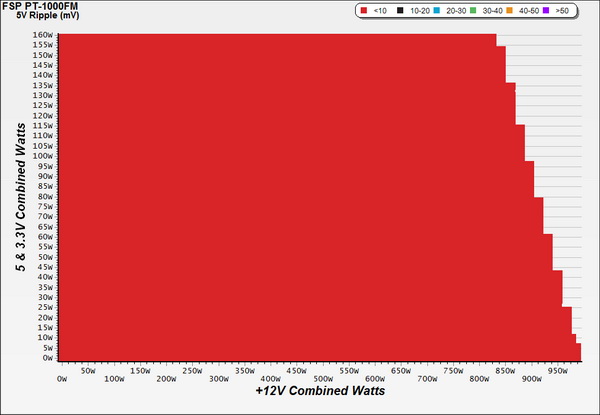
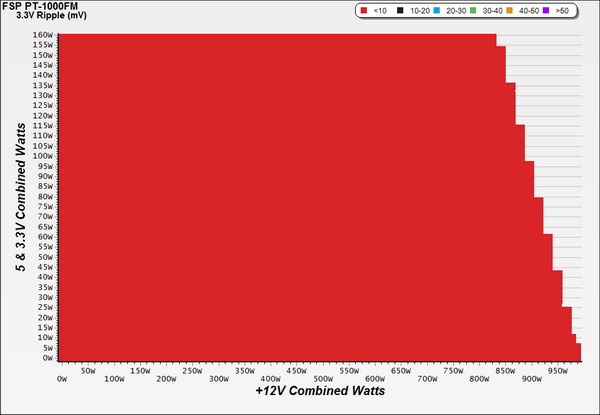
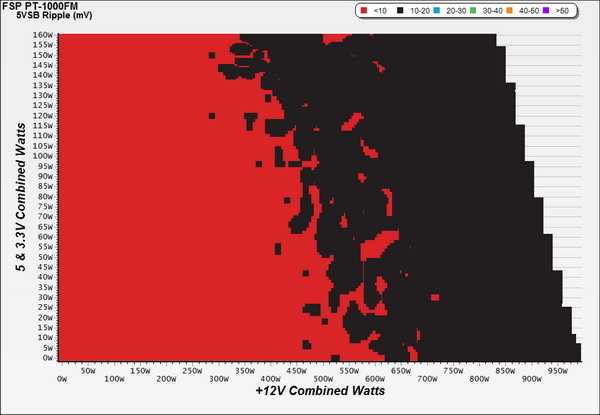
To generate the following charts, we set our loaders to auto mode through our custom-made software before trying more than 1000 possible load combinations with the +12V, 5V and 3.3V rails. The load regulation deviations in each of the charts below were calculated by taking the nominal values of the rails (12V, 5V and 3.3V) as point zero.
Load Regulation Charts
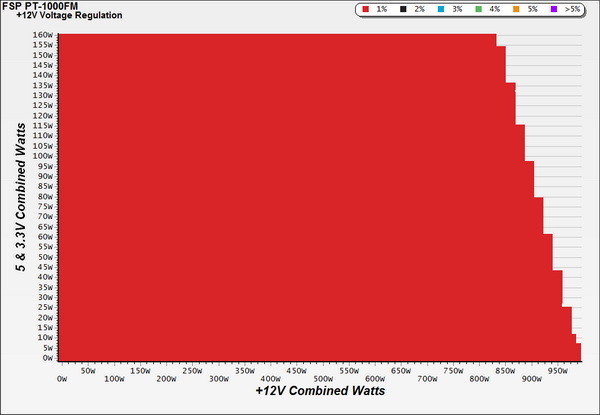
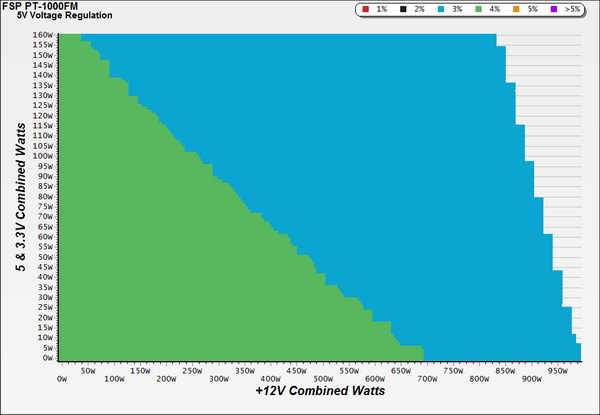
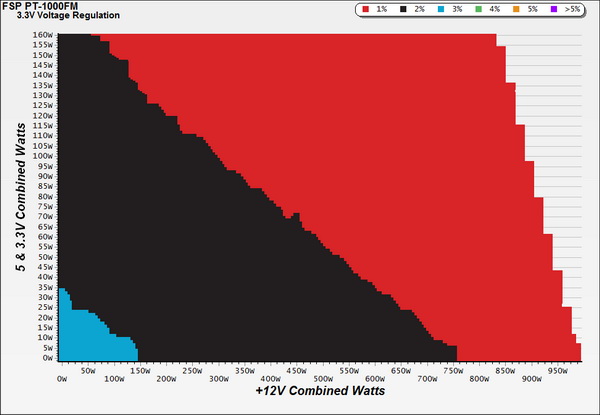
Efficiency Chart
Ripple Charts
Infrared Images
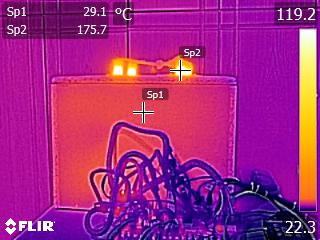
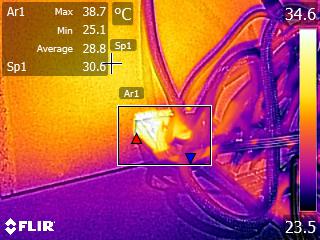
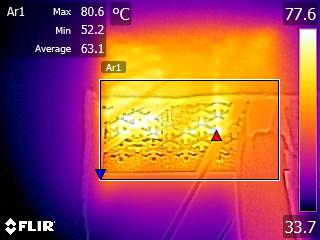
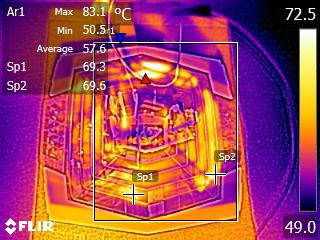
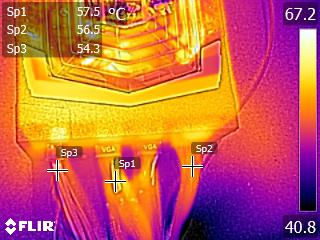
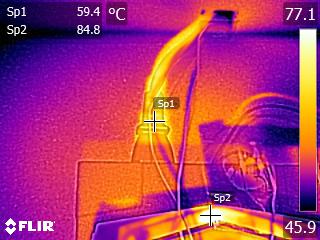
Toward the end of the cross-load tests, we took some photos of the PSU with our modified FLIR E4 camera that delivers 320x240 IR resolution (76,800 pixels).
Get Tom's Hardware's best news and in-depth reviews, straight to your inbox.
Current page: Cross-Load Tests And Infrared Images
Prev Page Efficiency, Temperatures And Noise Next Page Transient Response Tests
Aris Mpitziopoulos is a contributing editor at Tom's Hardware, covering PSUs.
-
Giannis Karagiannis Just ordered one! Very comprehensive review! It is a bit strange that thanks to your recent articles I can choose a power supply with much greater confidence than a CPU or VGA. Keep up the good work!Reply -
Vosgy ReplyJust ordered one! Very comprehensive review! It is a bit strange that thanks to your recent articles I can choose a power supply with much greater confidence than a CPU or VGA. Keep up the good work!
Man haven't seen anyone call them Video Graphics Accelerators in years, kudos to you good sir. -
Covaylent Nice work, Aris, as usual.Reply
Would you mind commenting on the infrared images? Some of those hotspots seem quite hot - am I just reading the images incorrectly? -
Aris_Mp Indeed some hotspots are very hot since I usually take this shots with the PSU operating at very high ambient temperatures. Some parts inside the PSU may operate at up to 100C under such conditions.Reply
