Intel quad-core QX6700 makes official debut in price/performance charts
Core 2 Duo QX6700 averages at $1167
When we started taking a look at processor price/performance last month, we already had access to the benchmark data of the QX6700, Intel's next-generation processor, even though it was more than a month away from release. So since then, we've been providing price/performance data in two series - one that takes the QX6700 and one that doesn't. Because we now know some solid price figures for the processor, and buying decisions will be made during this upcoming week for the QX6700, we have stopped looking at the data that excludes Intel's newest processor.
Click to enlarge
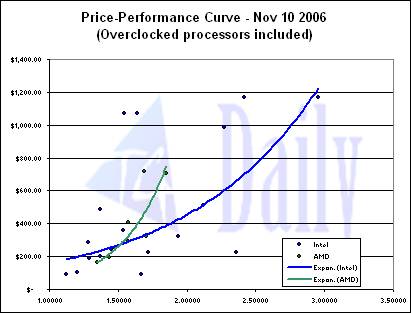
Even though AMD's price swings were somewhat erratic this week, it wasn't as defined as last week, when the company's price/performance correlation was one of the lowest we've seen. This week, it rebounded just a little bit, to 0.843, which means its correlation coefficient is still higher than Intel, virtually no matter which way it's calculated, but it is a cry from the 0.94's and 0.95's we saw in October. In fact, AMD's price/performance relationship has been in the low 0.8 territory for a couple weeks. It could just be nervous tension from the company and the reatilers as AMD gets ready for its new 4x4 platform, so we'll have to see what happens to the correlation after the dust settles from that, and especially after we get the necessary data to add it to these charts.
Because no big changes were seen in Intel's prices this week, its correlation values are pretty much constant with what we had last week, though they did actually drop a little bit with the decrease in average pre-order prices compared to our $1200 prediction. In this graph, weighing in overclocked processors, Intel's correlation is 0.608, which is around what we've seen before for this set of data.
Click to enlarge
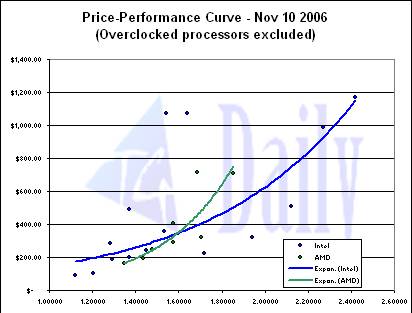
When the overclocked processor values are removed from the equation, Intel's correlation coefficient becomes 0.655, which once again, because of the minute changes in Intel's prices, is not much different from last week. What is visually obvious, from this graph more so than the previous one, is that the FX-60 is singlehandedly throwing off the correlation for AMD, much like the Extreme Editions do for Intel. If we were to remove the FX-60, AMD's correlation would rise to over 0.9. In terms of the trend line, like Intel, it did not change too much because the overall change for all AMD processors was not huge. This week, for AMD, it's all about individual points that changed.
Click to enlarge
Get Tom's Hardware's best news and in-depth reviews, straight to your inbox.
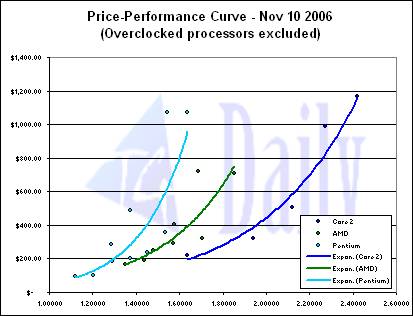
This graph gives us a better idea of what the addition of the QX6700 does for Intel's price/performance relationship. Last week, we took a look at data from Intel when the processors were split up into Core 2 Duo/Extreme and Pentium D products. This gives us a more visual representation of the segment where AMD has the overall advantage, more or less in the entry- to mid-level markets.
This week, we added the QX6700 to this graph, and the only thing that changed was the height of the Core 2 trend line. No big correlation shifts occured, meaning the QX6700 is price almost spot on with what it should be for the level of performance Intel is offering.
Tom's Hardware is the leading destination for hardcore computer enthusiasts. We cover everything from processors to 3D printers, single-board computers, SSDs and high-end gaming rigs, empowering readers to make the most of the tech they love, keep up on the latest developments and buy the right gear. Our staff has more than 100 years of combined experience covering news, solving tech problems and reviewing components and systems.


