Flash SSD Update: More Results, Answers
The Tests: Random, Sequential, DVD and Idle
Test 1: I/O Performance
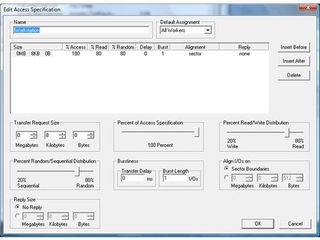
The first test run utilizes the IOMeter workstation profile to stress the drives with a benchmark profile that is based on 80% read, 20% write, 80% random and 20% sequential access. The profile is based on an 8-KB block size and it delivers an average result of I/O operations per second during a defined part of the duration of the benchmark.

Test 2: Streaming Reads
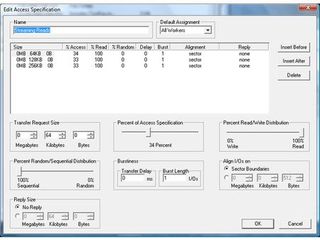
Our second run also utilizes IOMeter, but this time we use a profile that executes only sequential reads. We use an equal distribution of 64-KB, 128-KB and 256-KB blocks here. The result represents the average amount of I/O operations per second for the given sequential workload.

Test 3: DVD Video Playback
A lot of people requested we run a test that would put the drives under a controlled load, such as a data stream for DVD video. We used the VLC player and broke out the good old Terminator 2 VOB file we’ve used in the past. We determined average power by measuring from second 1,000 to second 2,000 of the VOB file.
Test 4: Drive Idle
Finally, we wanted to know the idle power of all drives, since many people criticized how the Hitachi drive had an idle power high enough to invalidate some of the test results. As a matter of fact, different hard drives have different mechanisms to save power. And the Hitachi drive we used even has a power-saving state that can be applied while streaming DVD data. You’ll find more information in the appropriate benchmark section.

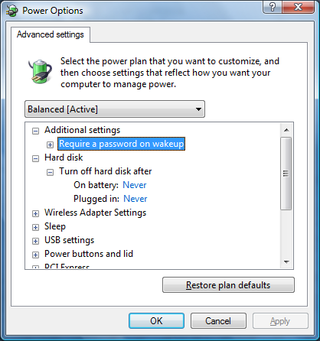
We switched off the drive power saving options in Windows Vista to determine the actual hard drive idle power.
Stay on the Cutting Edge
Join the experts who read Tom's Hardware for the inside track on enthusiast PC tech news — and have for over 25 years. We'll send breaking news and in-depth reviews of CPUs, GPUs, AI, maker hardware and more straight to your inbox.
Current page: The Tests: Random, Sequential, DVD and Idle
Prev Page New Test Procedure Next Page Flash SSDsMost Popular

