Why you can trust Tom's Hardware
Benchmark Results and Final Analysis
Our standard benchmarks and power tests are performed using the CPU’s stock frequencies (including any default boost/turbo) with all power-saving features enabled. We set optimized defaults in the BIOS and the memory by enabling the XMP profile. For this baseline testing, the Windows power scheme is set to Balanced (default) so the PC idles appropriately.
Synthetic Benchmarks
Synthetics offer a valuable method for evaluating a board's performance, as identical settings are expected to yield similar results. Turbo boost wattage and advanced memory timings are areas where motherboard manufacturers can still optimize for stability or performance, though, and these settings can impact specific testing.
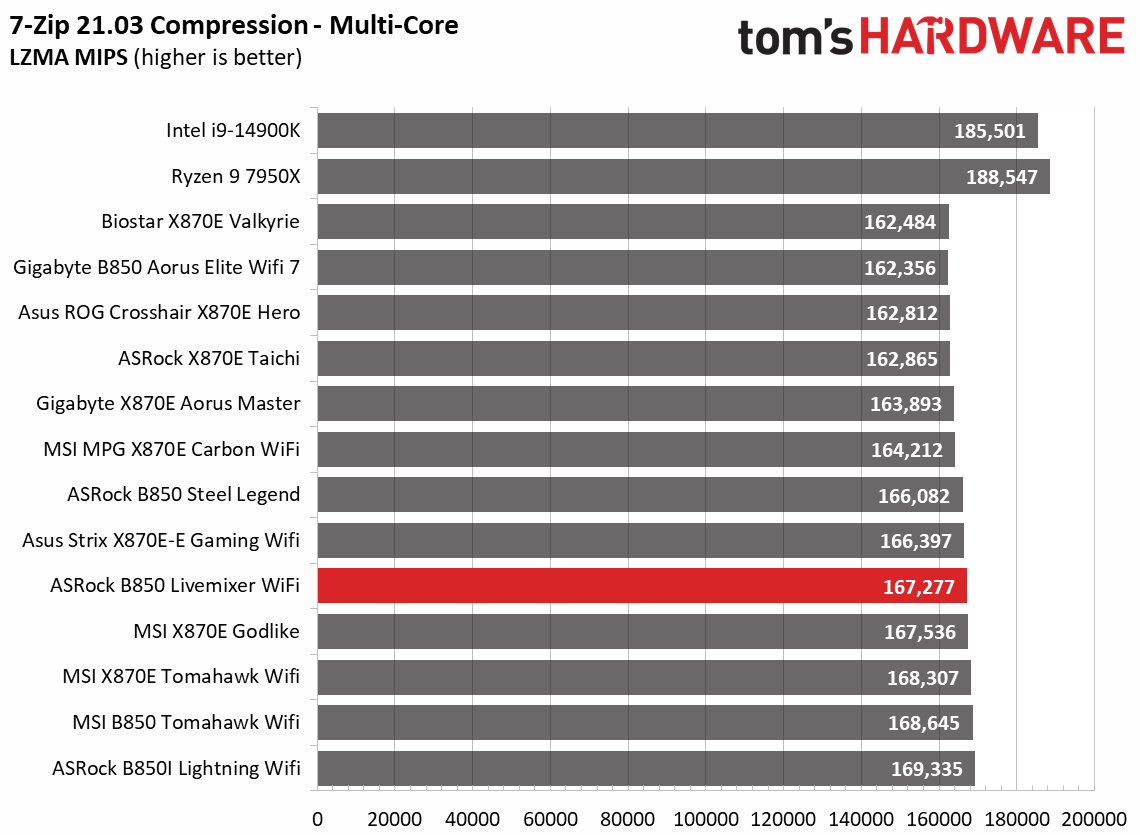
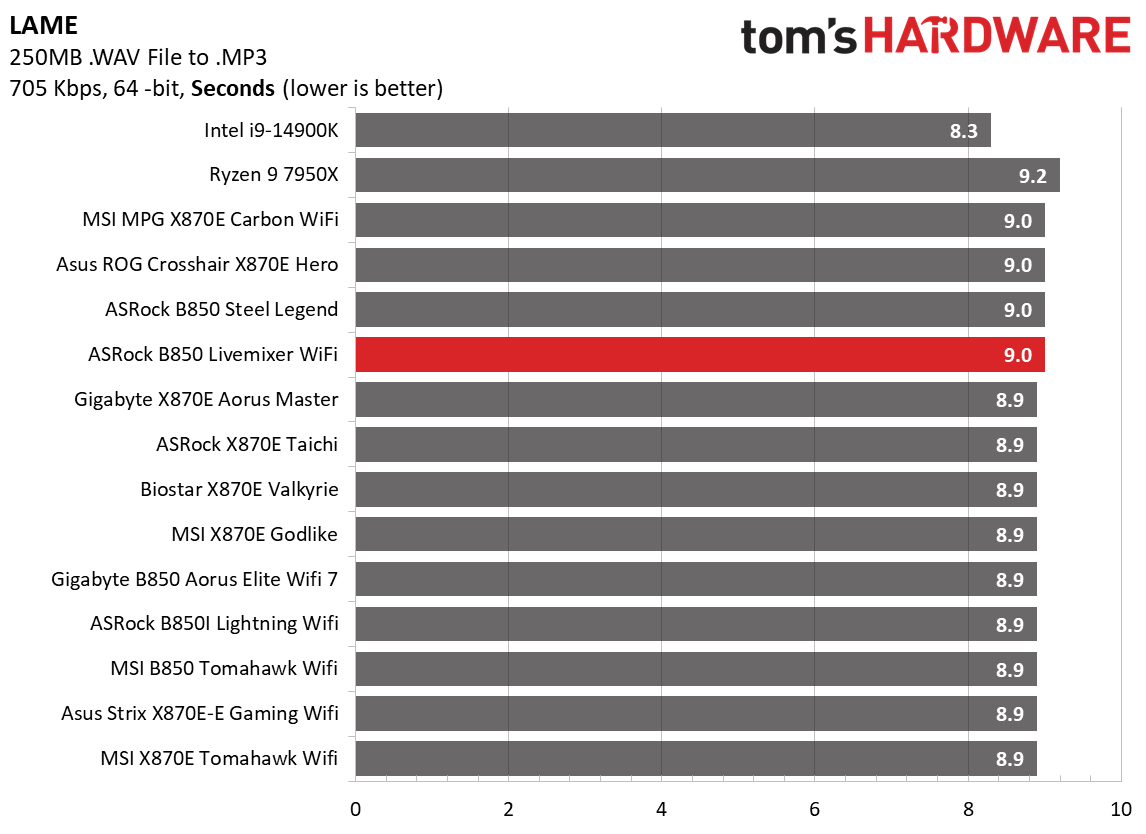
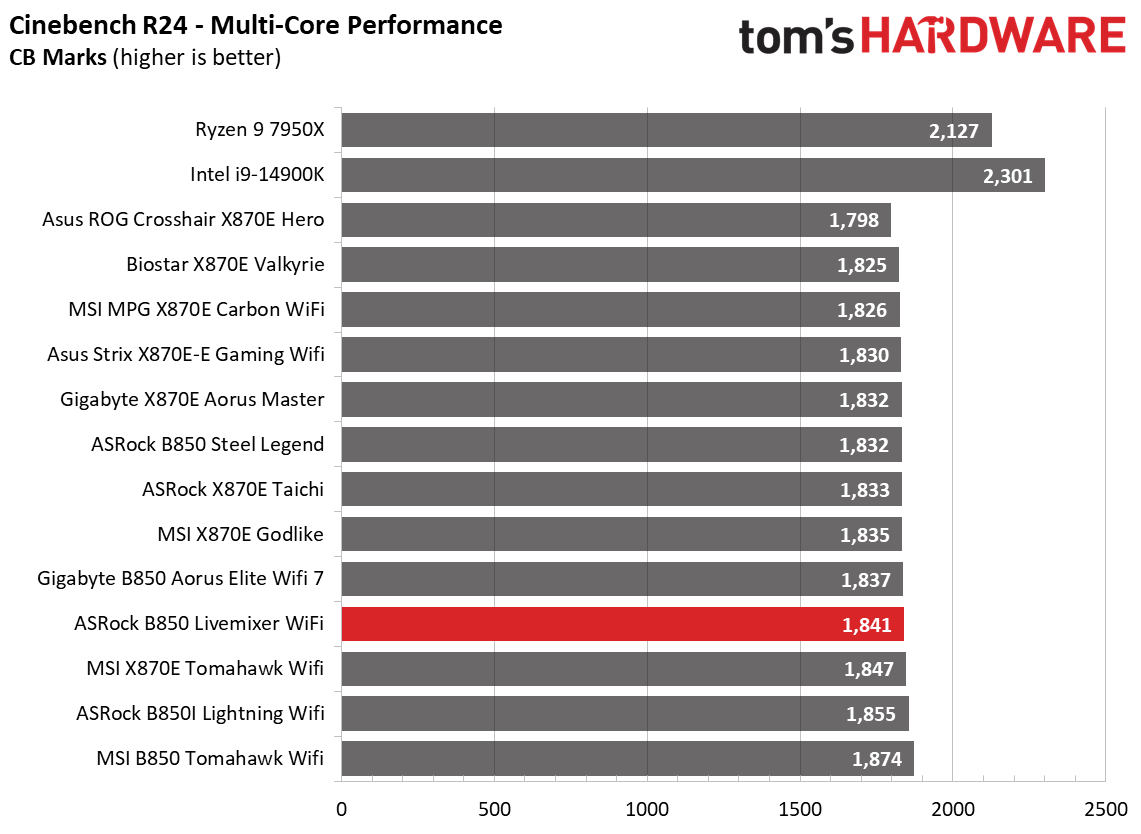
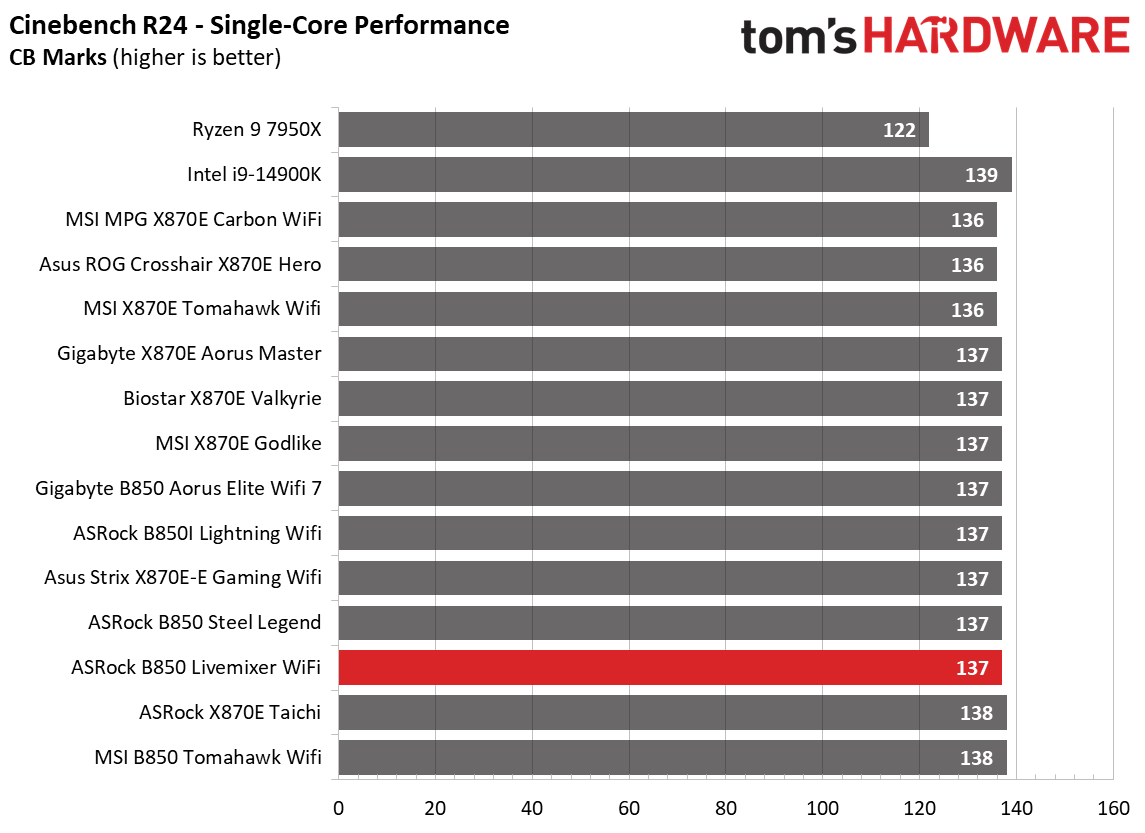
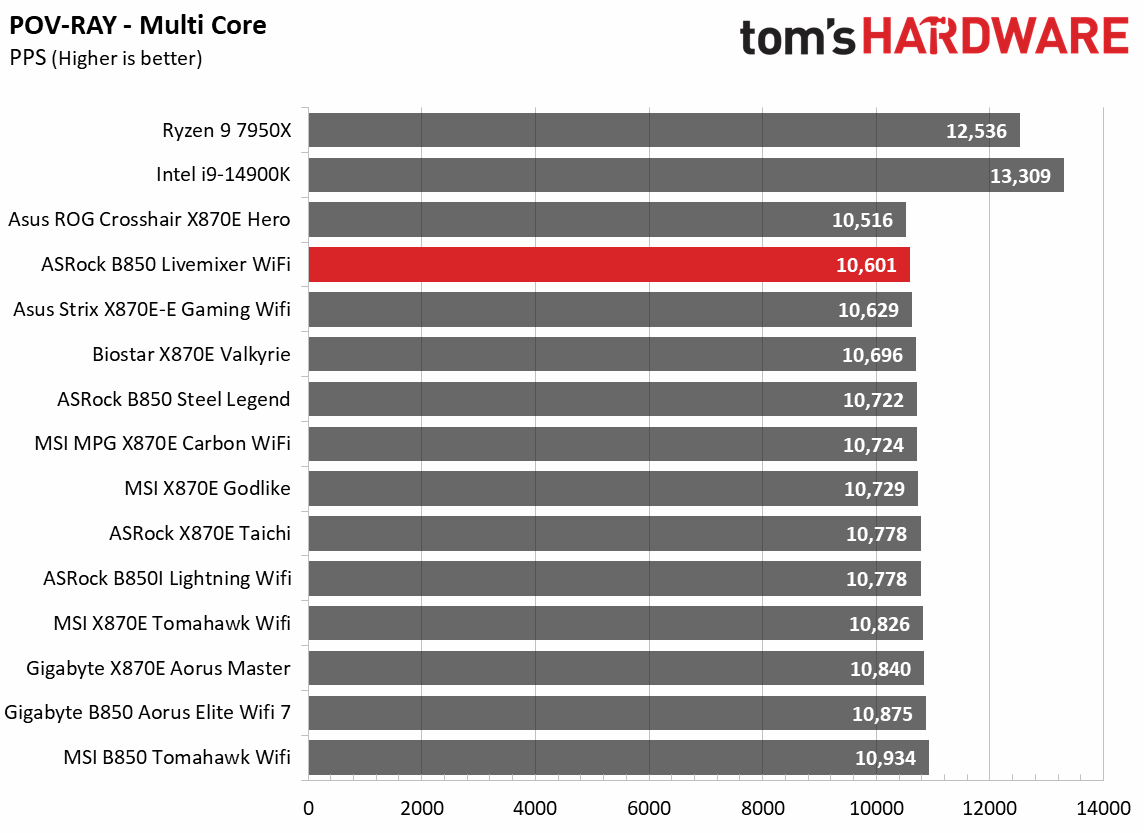
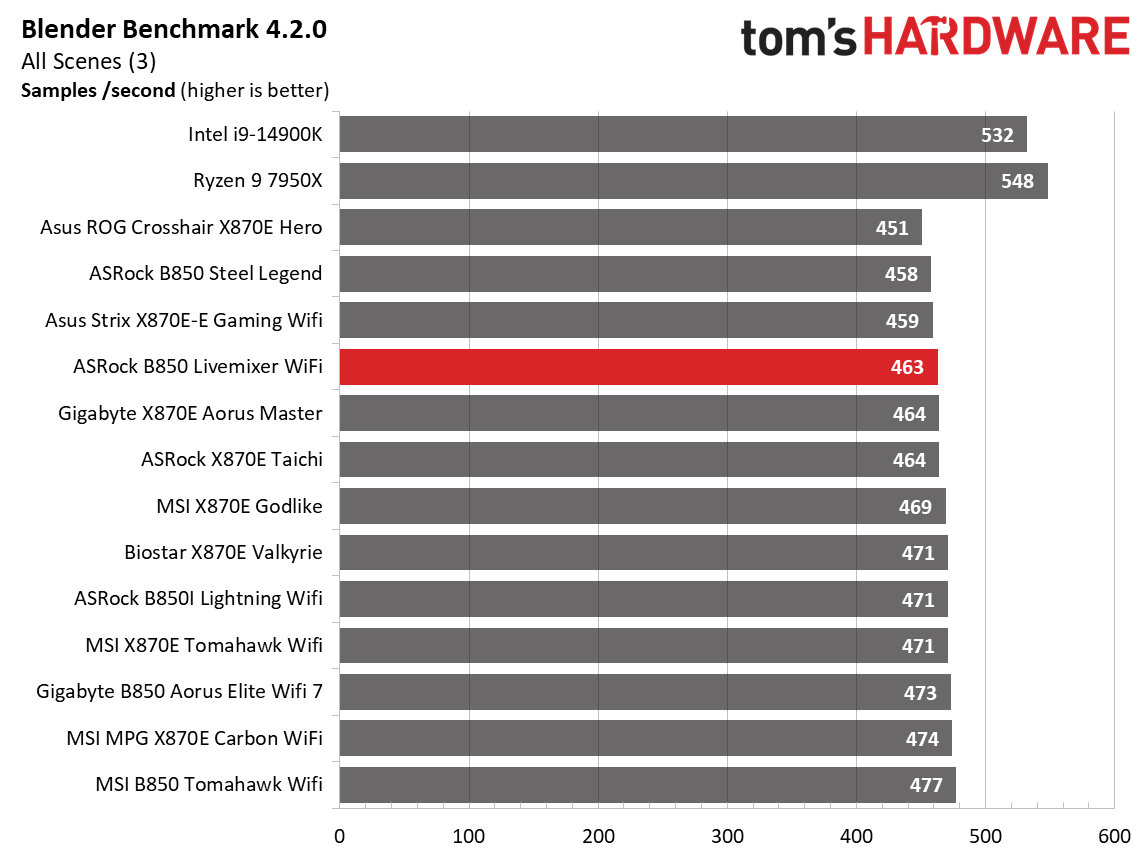
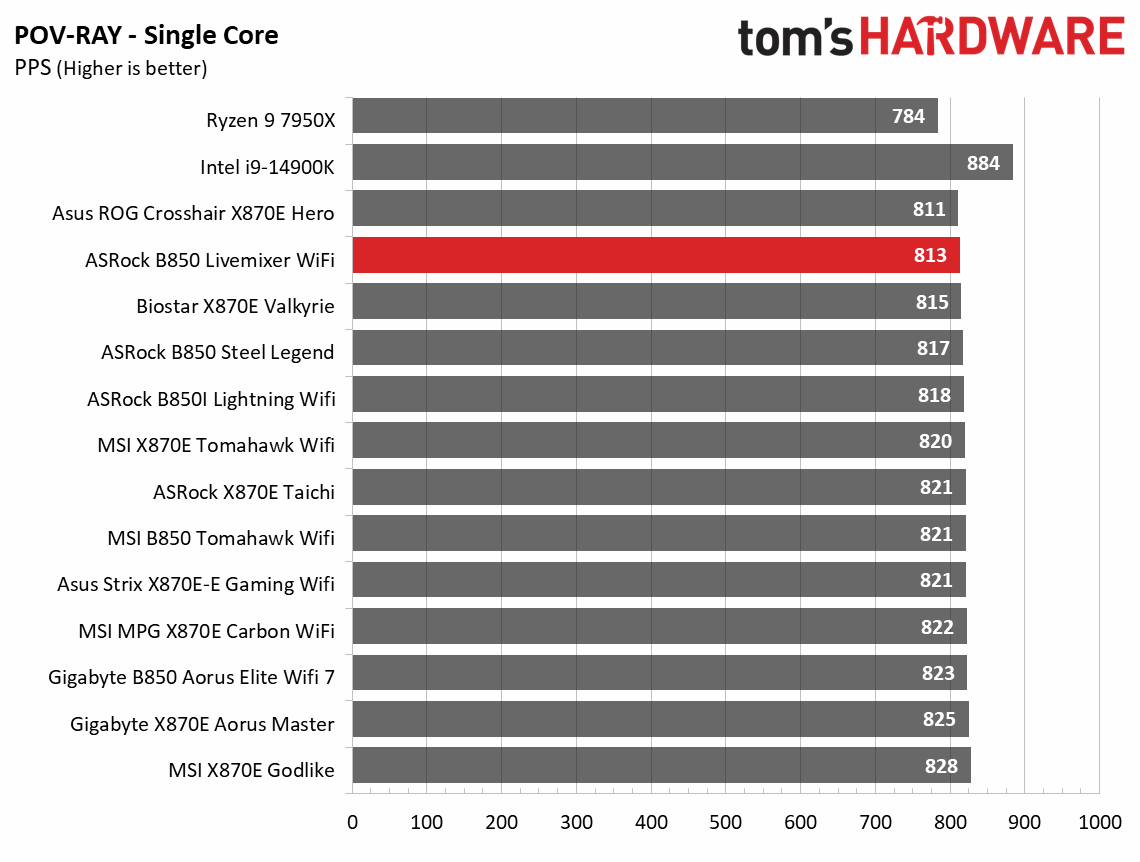
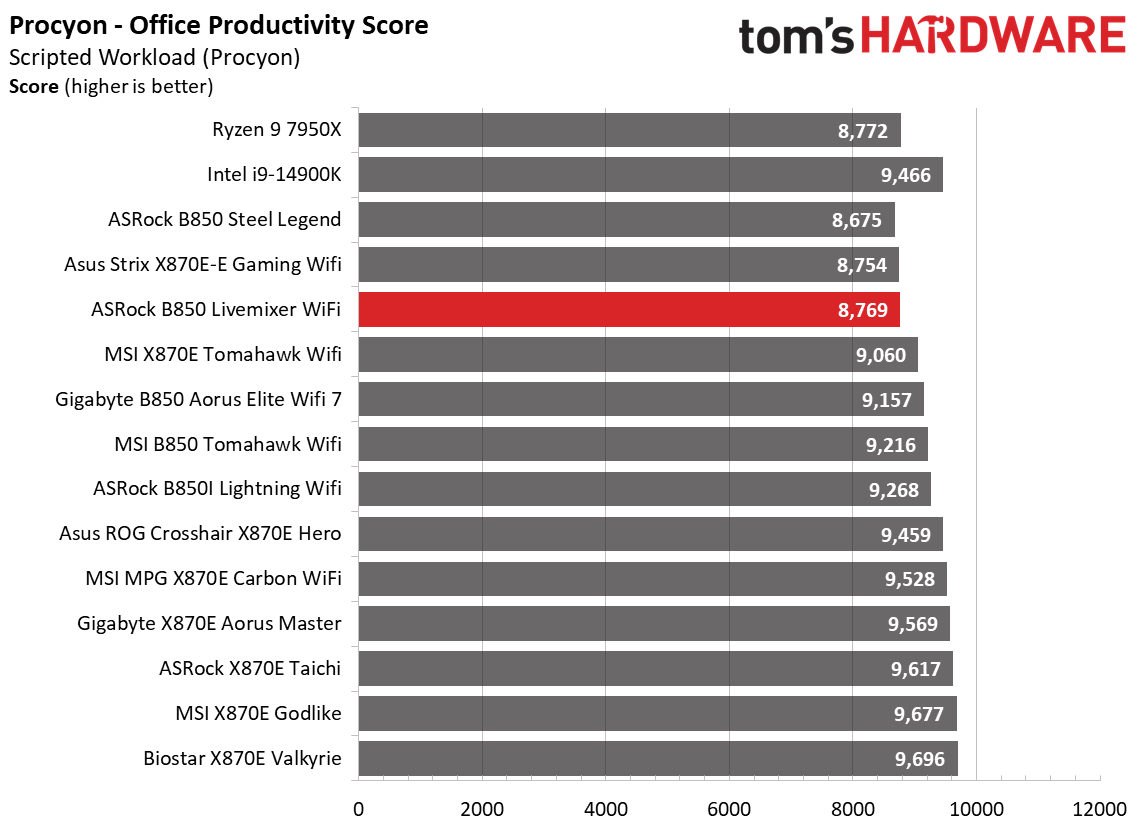
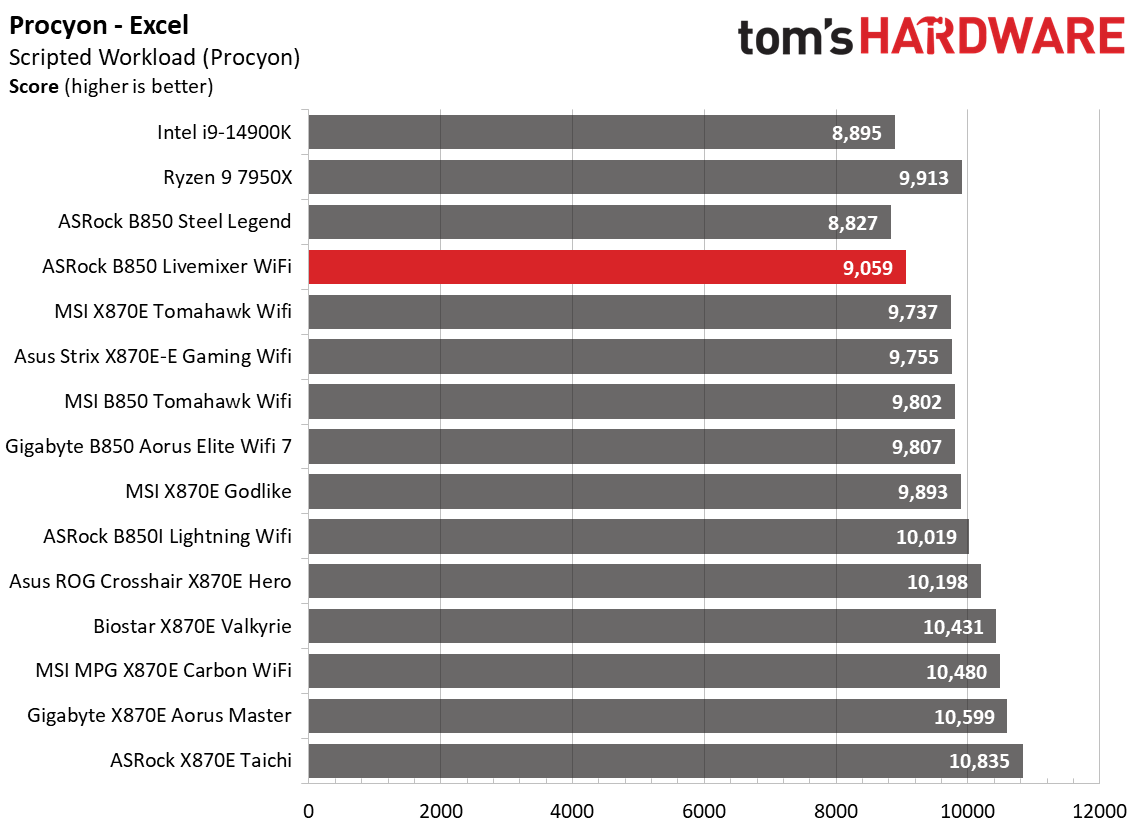
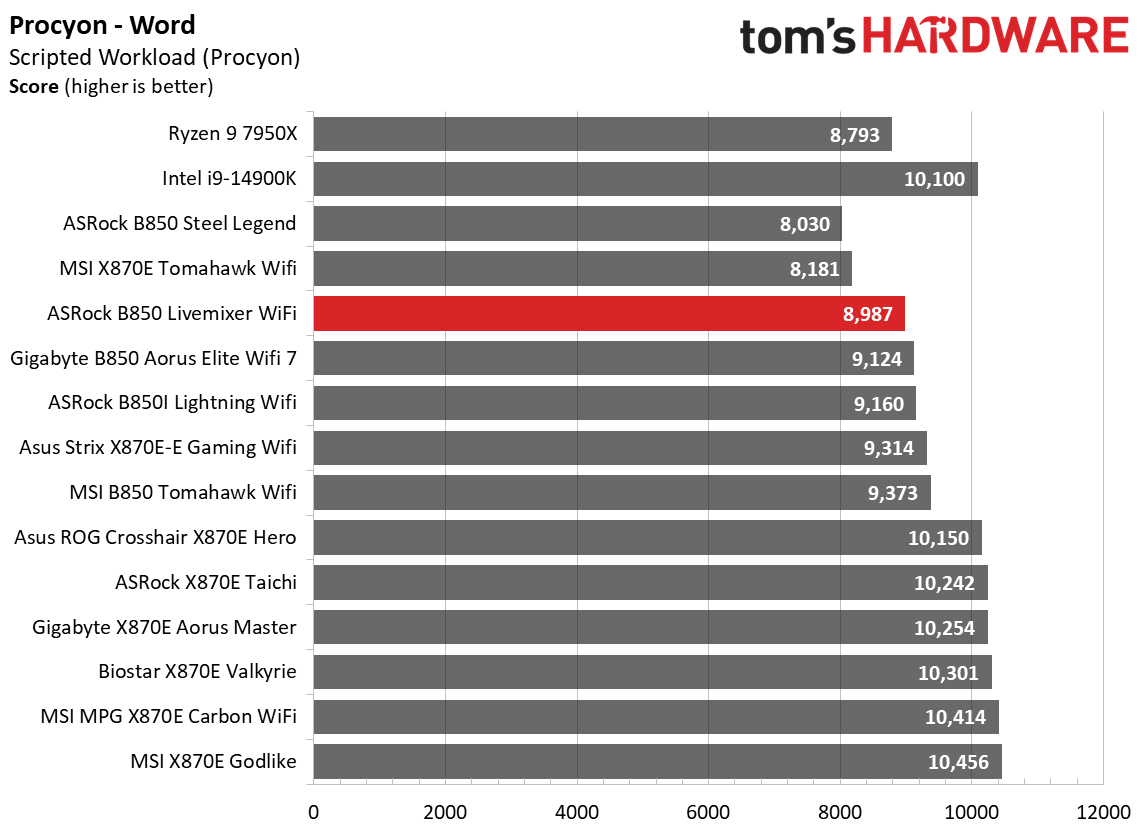
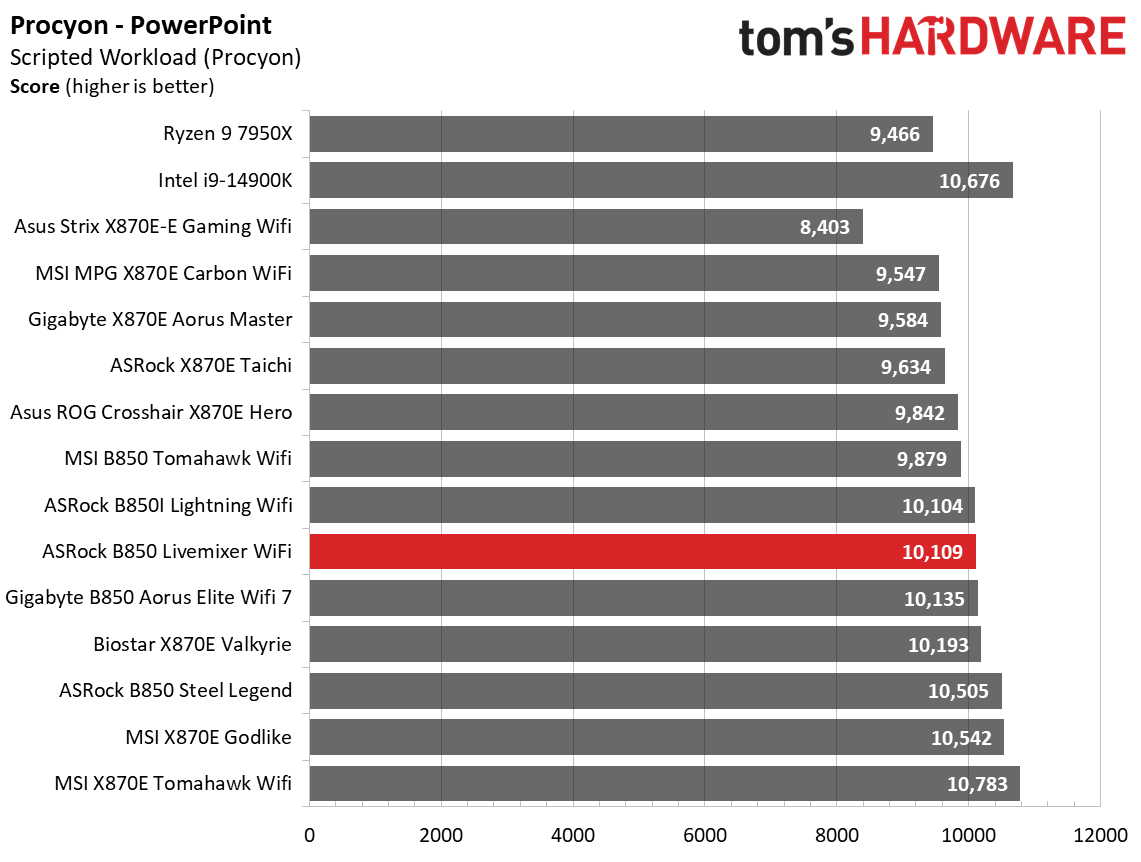
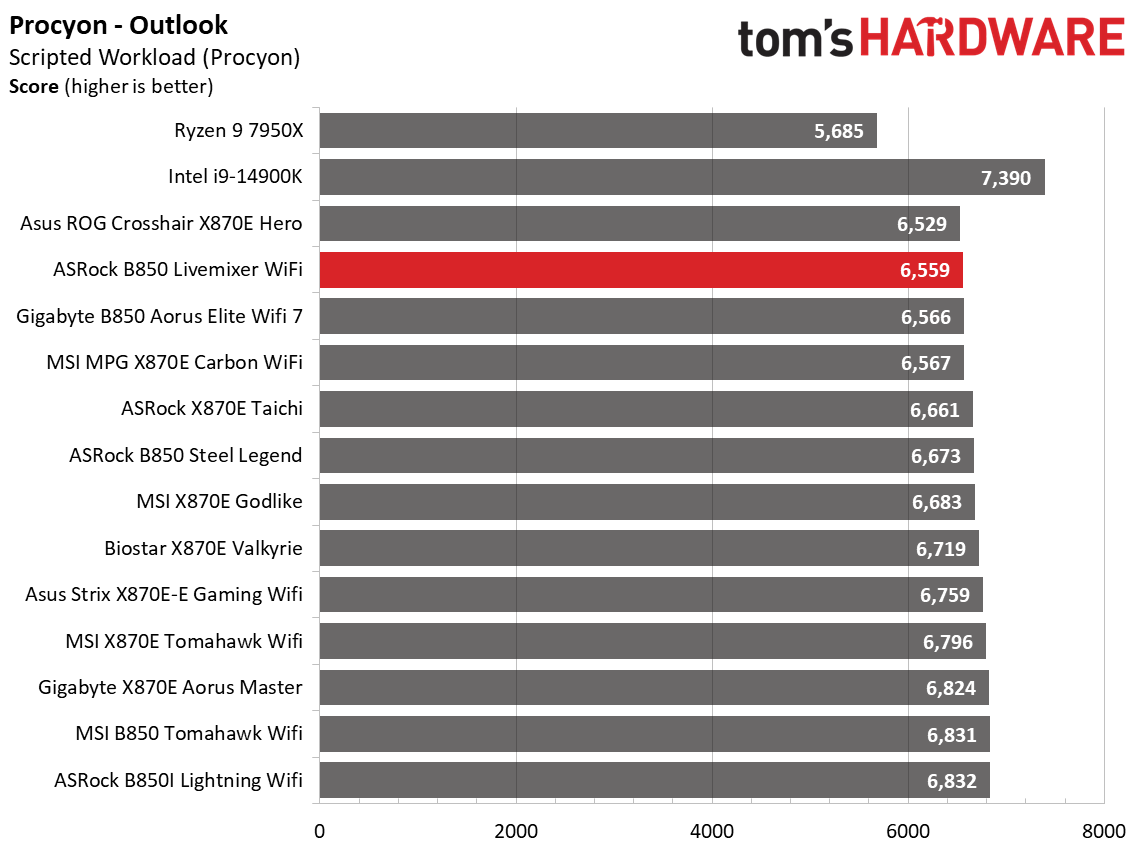
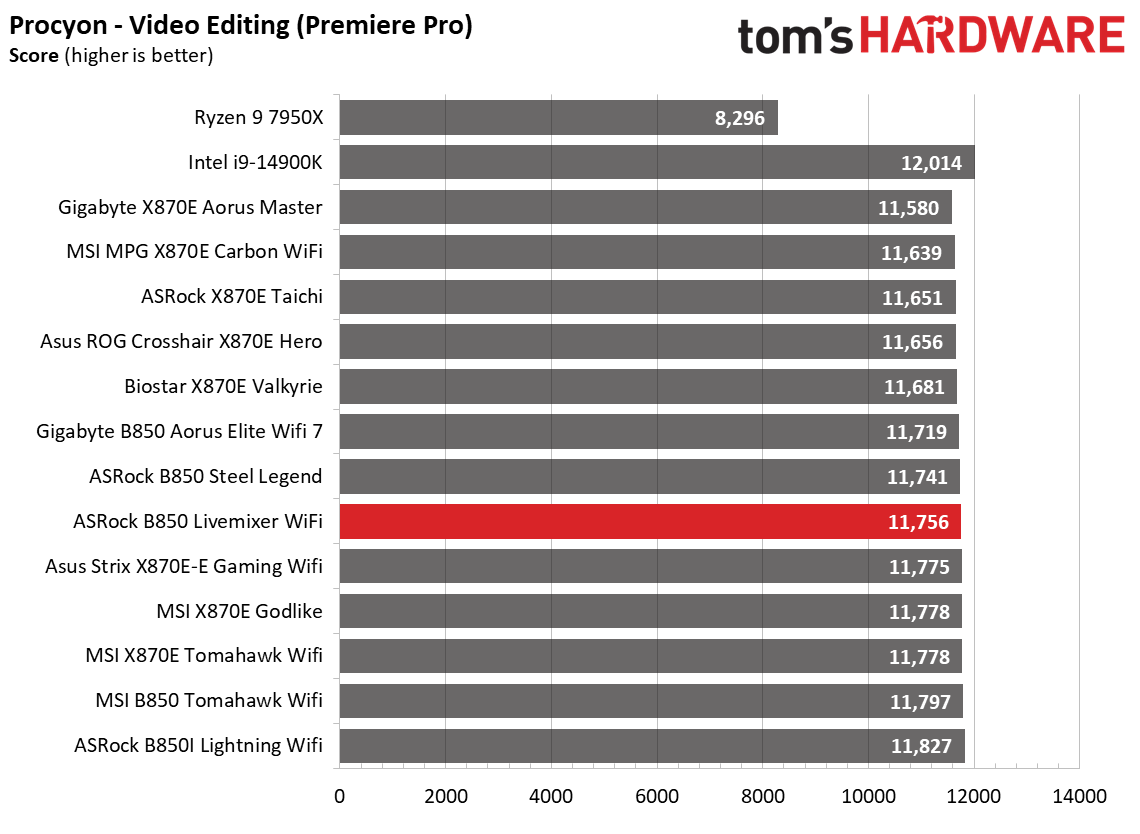
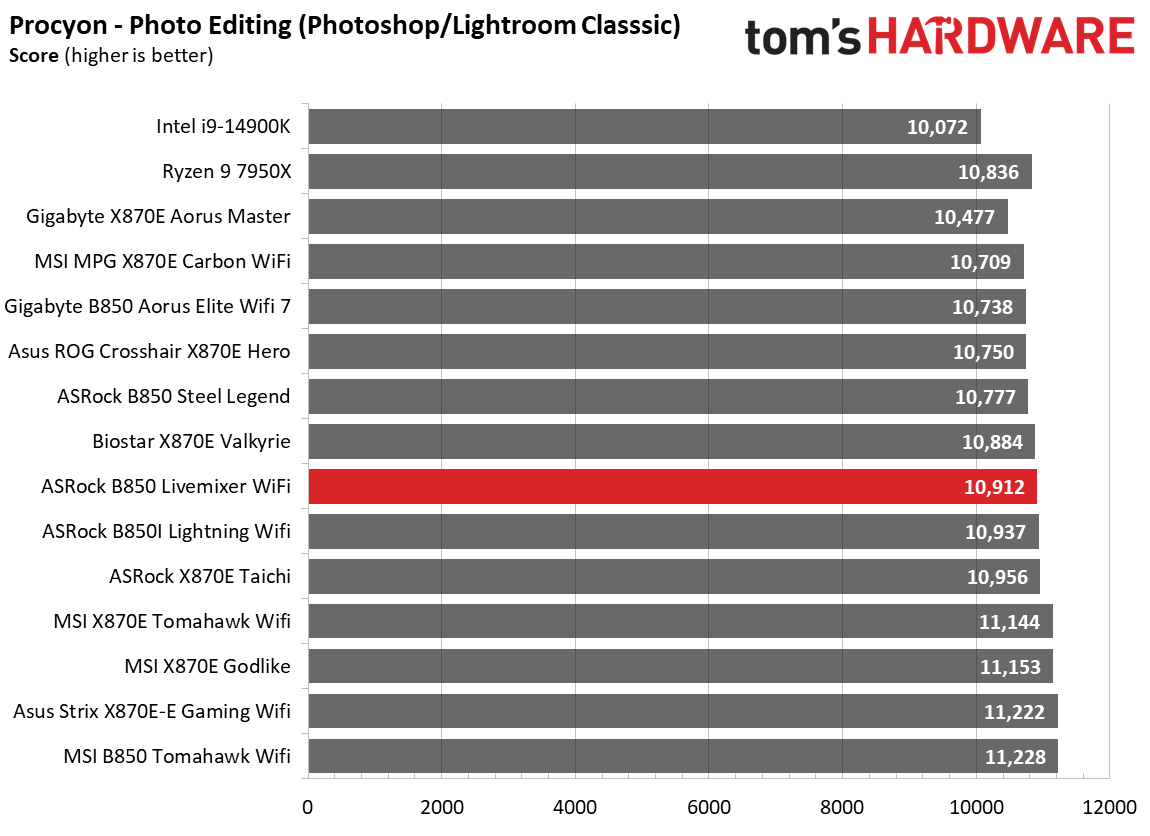
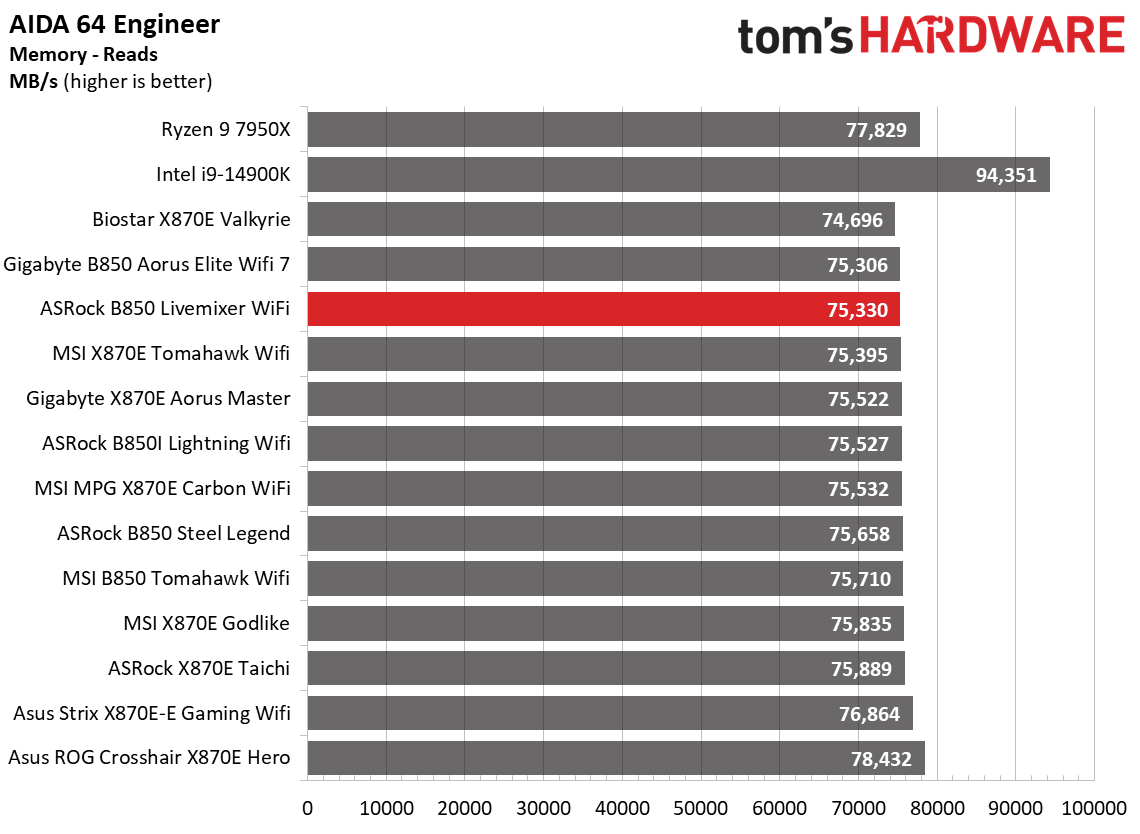
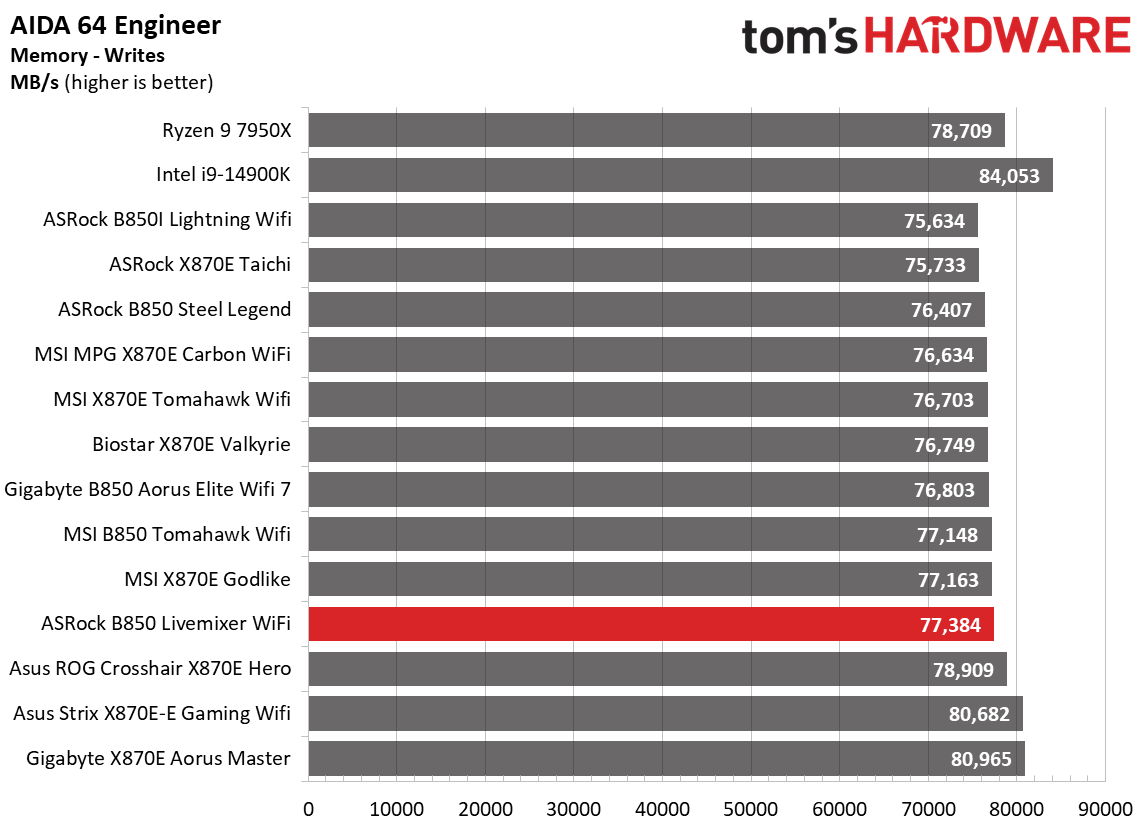
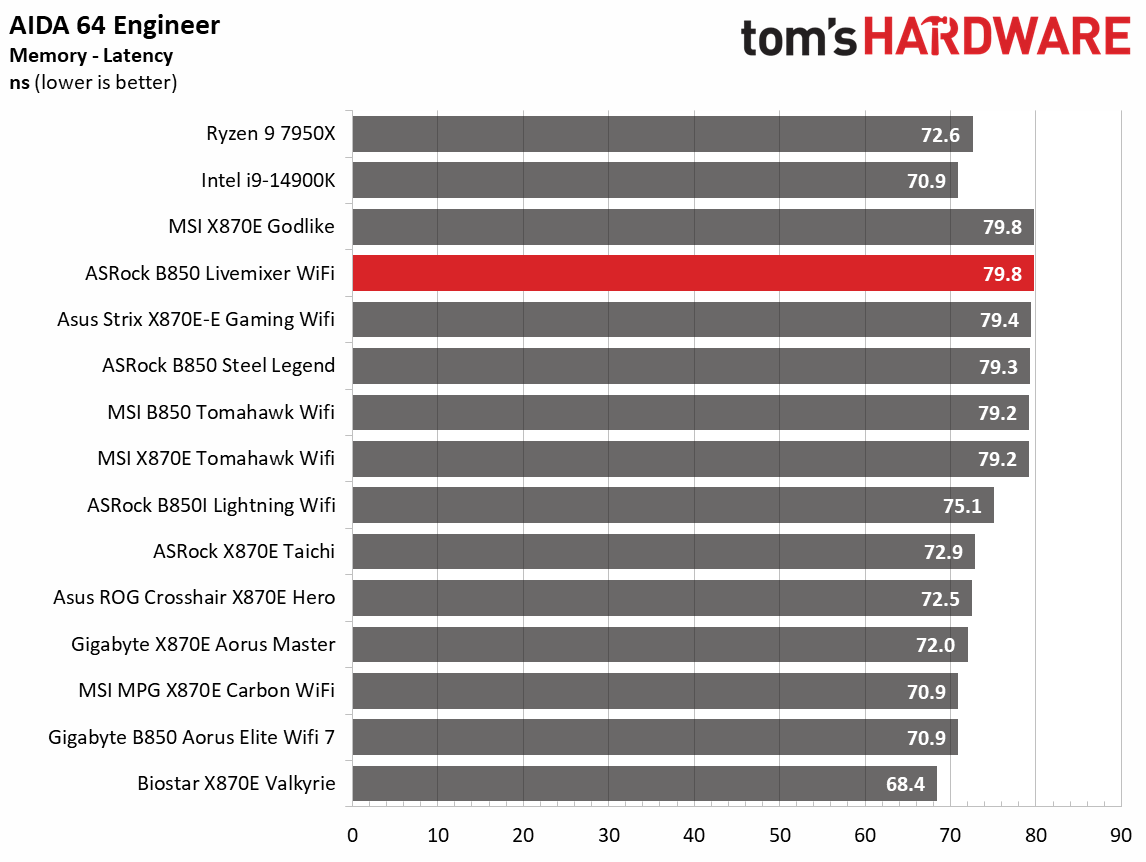
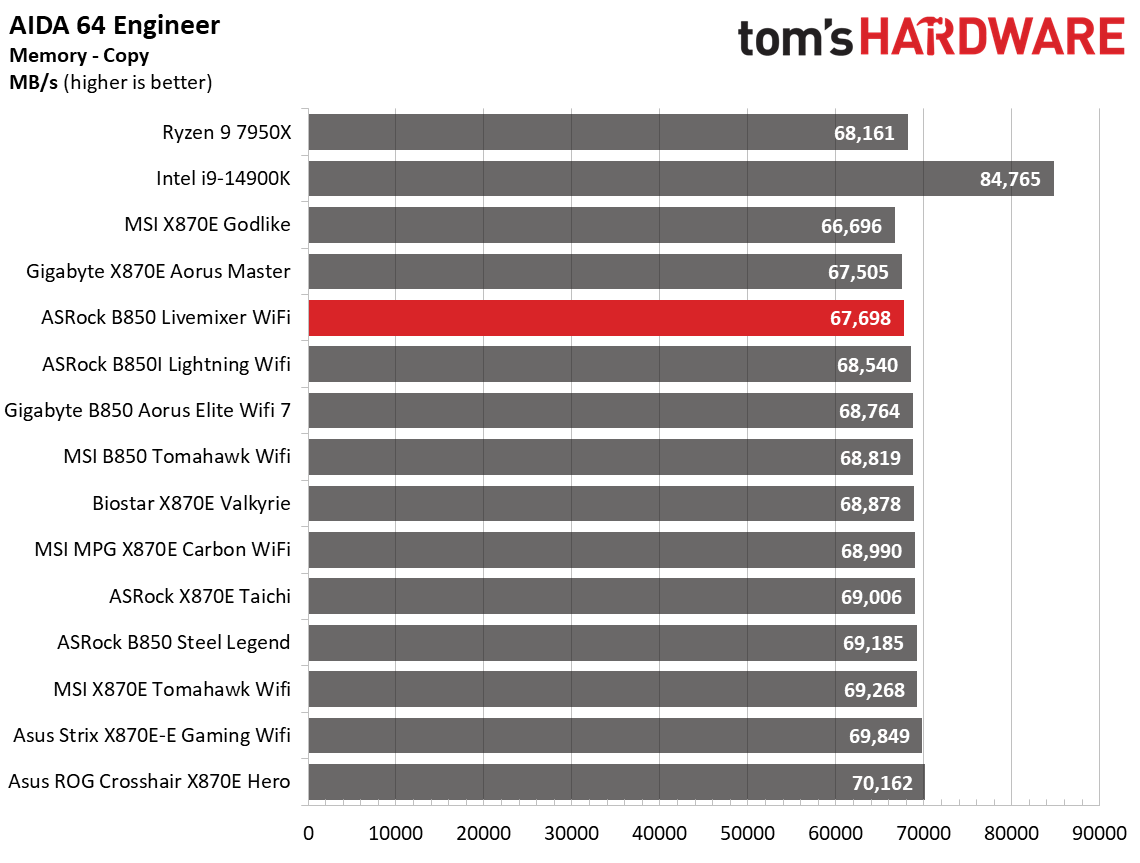
Performance across the synthetic benchmarks was average, but some memory-sensitive applications were slower. As we said earlier, running our regular sticks would have brought things in line, so it’s no fault of the board (outside of a seeming memory incompatibility with our Kingston set). It was a bit slower in some of the MS Office/Procyon tests, but you likely wouldn’t notice in the applications, and that benchmark tends to vary a bit more than others.
Timed Applications

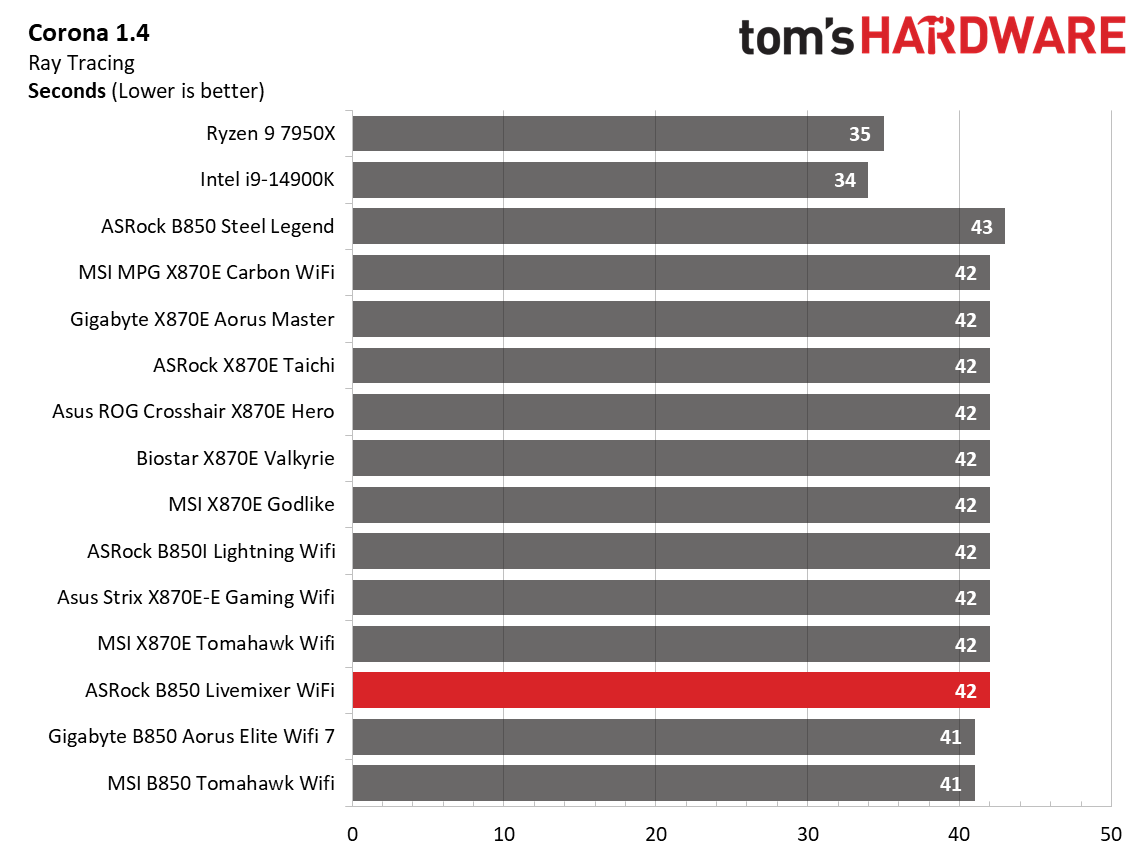
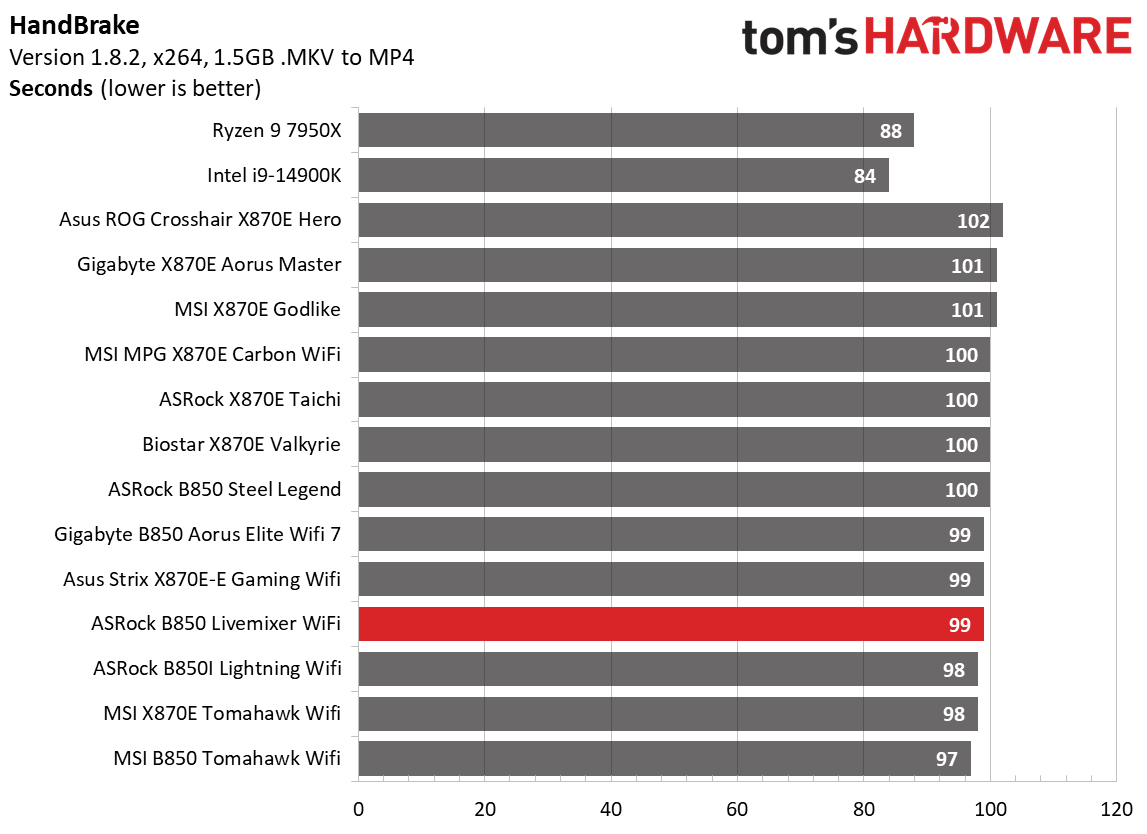
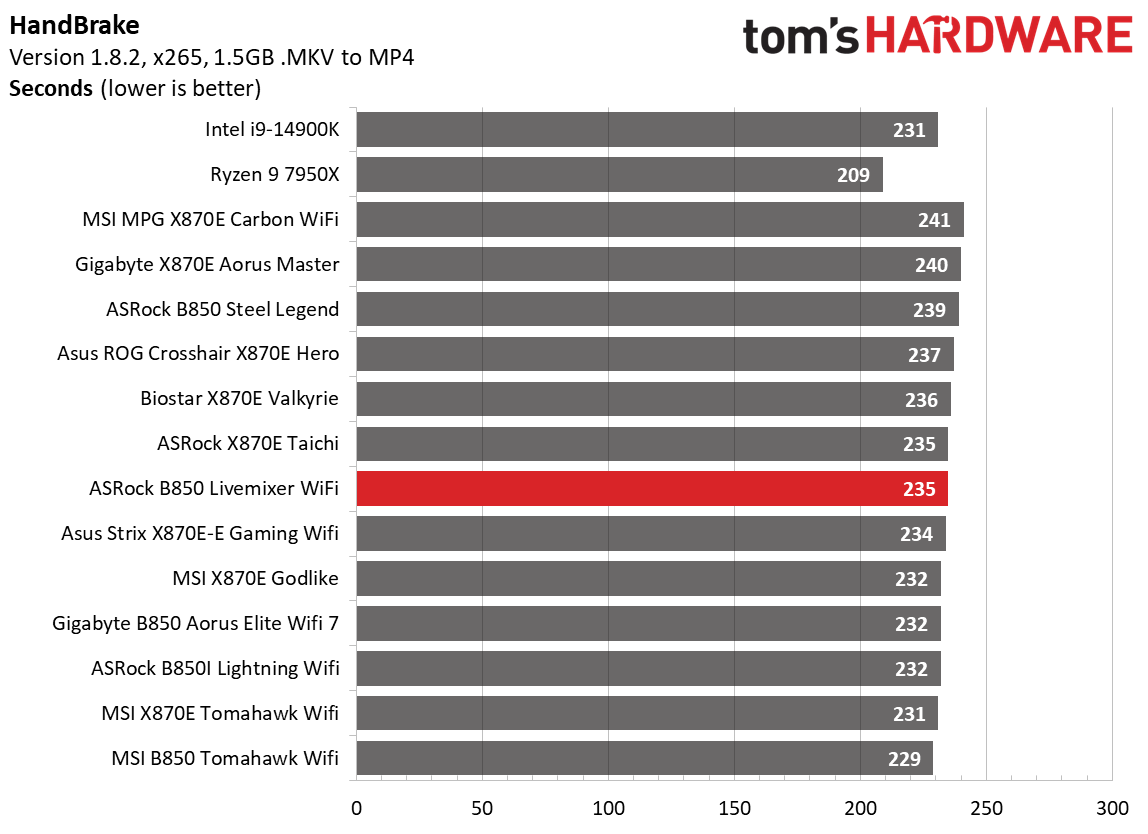
In the timed applications, it performed average again across the board. Surprisingly, we didn’t see quite the same memory hit as we did on the Steel Legend.
3D Games and 3DMark
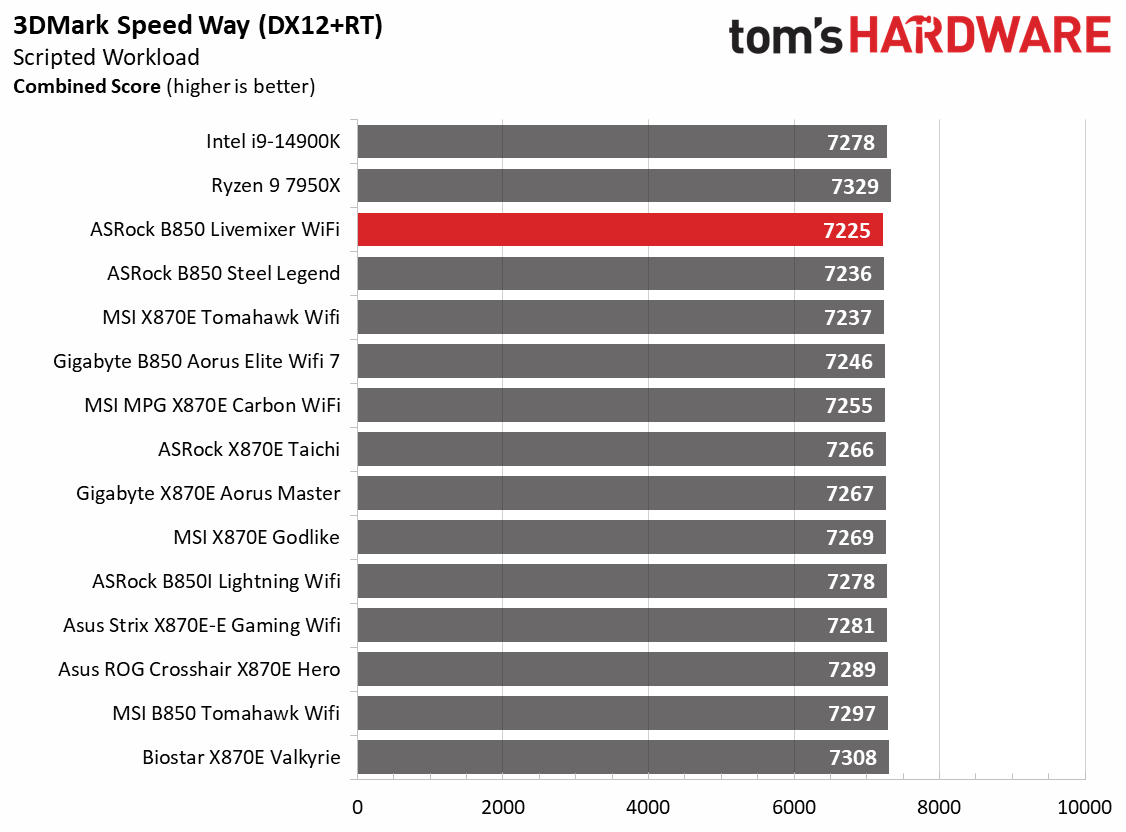
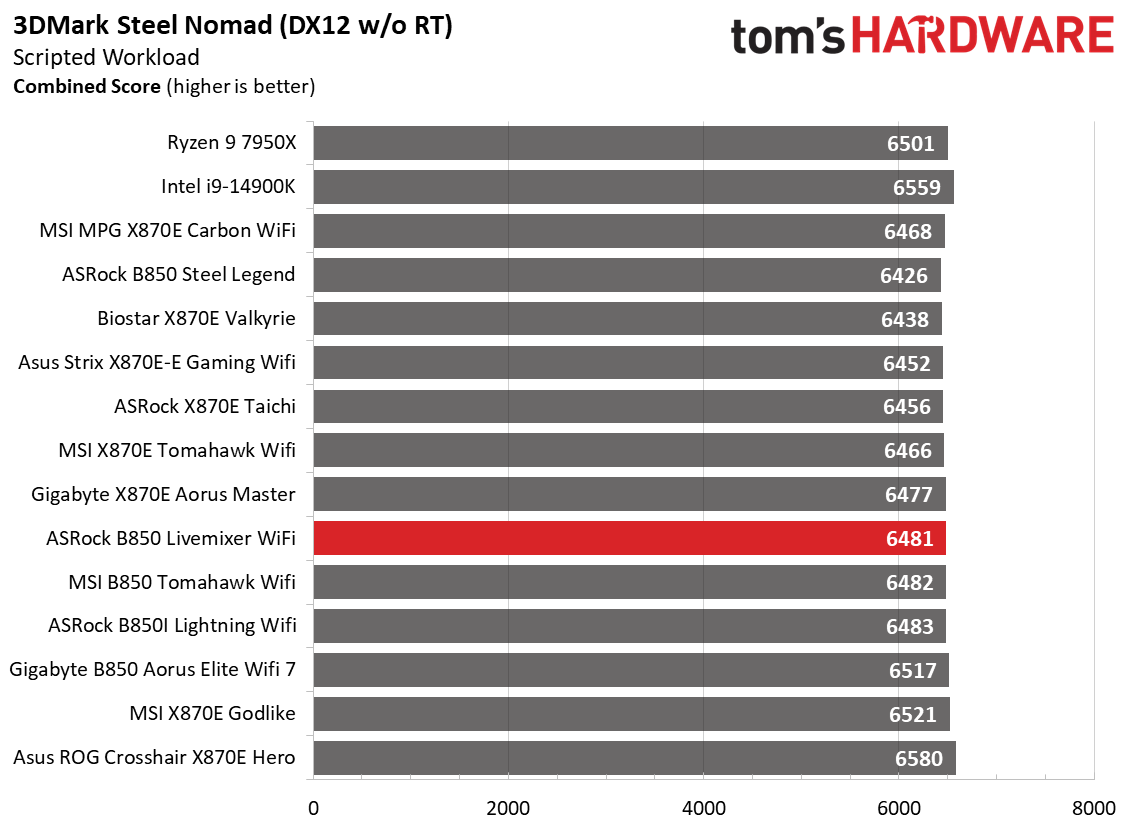
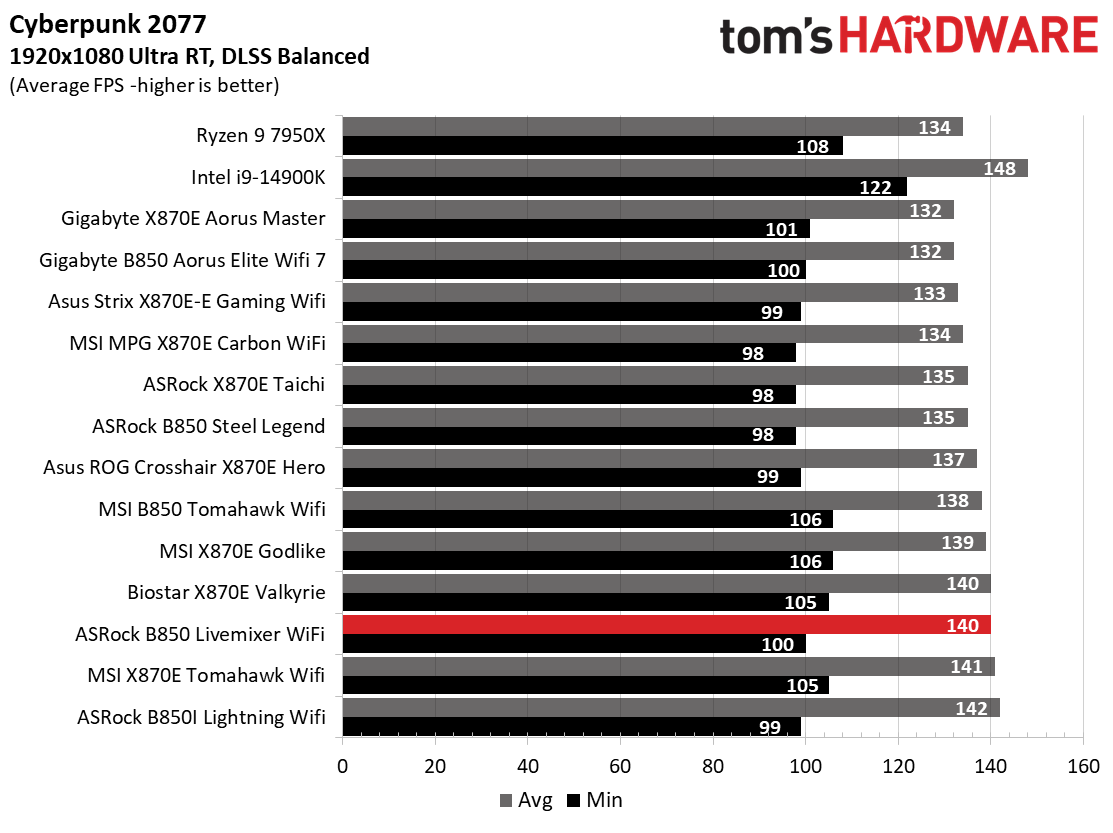
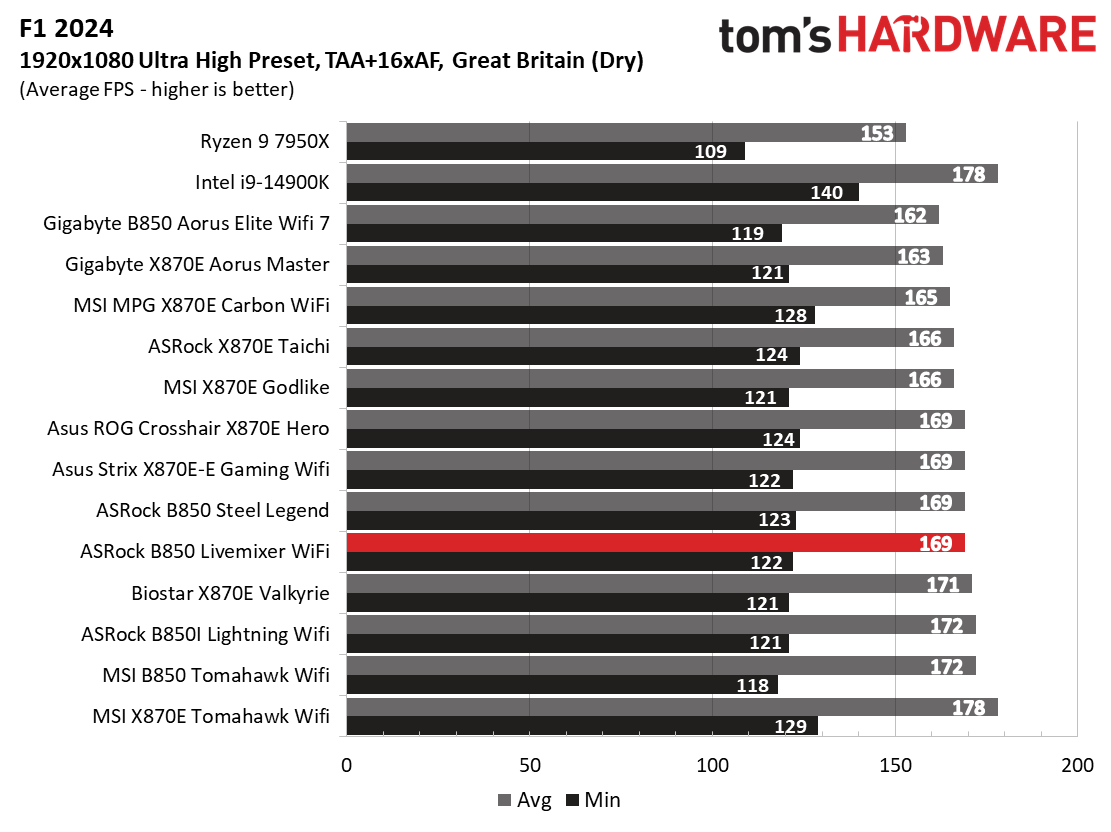
Starting with the launch of Zen 5, we updated our game tests. We kept EA’s F1 racing game and have upgraded to F1 24. We also dropped Far Cry 6 in favor of the even more popular and visually appealing Cyberpunk 2077. We run both games at 1920x1080 resolution using the Ultra preset (details listed above). Cyberpunk 2077 uses DLSS, while we left F1 24 to native resolution scaling. The goal of these settings is to determine if there are differences in performance at the most commonly used (and CPU/system-bound) resolution with settings most people use or strive for (Ultra). We expect the difference between boards in these tests to be minor, with most falling within the margin of error. We’ve also added a minimum FPS value, which can affect your gameplay and immersion experience.
The results in our two games were spot on, with F1 2024 and Cyberpunk 2077 both falling around the average of our tested boards. ASRock’s board was the slowest we’ve seen, but it is less than 1% behind the fastest anyway. All good here!
Overclocking
Over the past few CPU generations, overclocking headroom has been shrinking on both sides of the fence while the out-of-the-box potential has increased. For overclockers, this means there’s less fun to be had. For the average consumer, you’re getting the most out of the processor without manual tweaking. Today’s motherboards are more robust than ever, and they easily support power-hungry flagship-class processors, so we know the hardware can handle them. There are multiple ways to extract even more performance from these processors: enabling a canned PBO setting from the BIOS, manually adjusting the PBO settings, or opting for an all-core overclock. Results will vary and depend on the cooling as well. In other words, your mileage may vary. Considering all the above, we will not be overclocking the CPU. However, we will try out all our different memory kits to ensure they meet the specifications.
Get Tom's Hardware's best news and in-depth reviews, straight to your inbox.
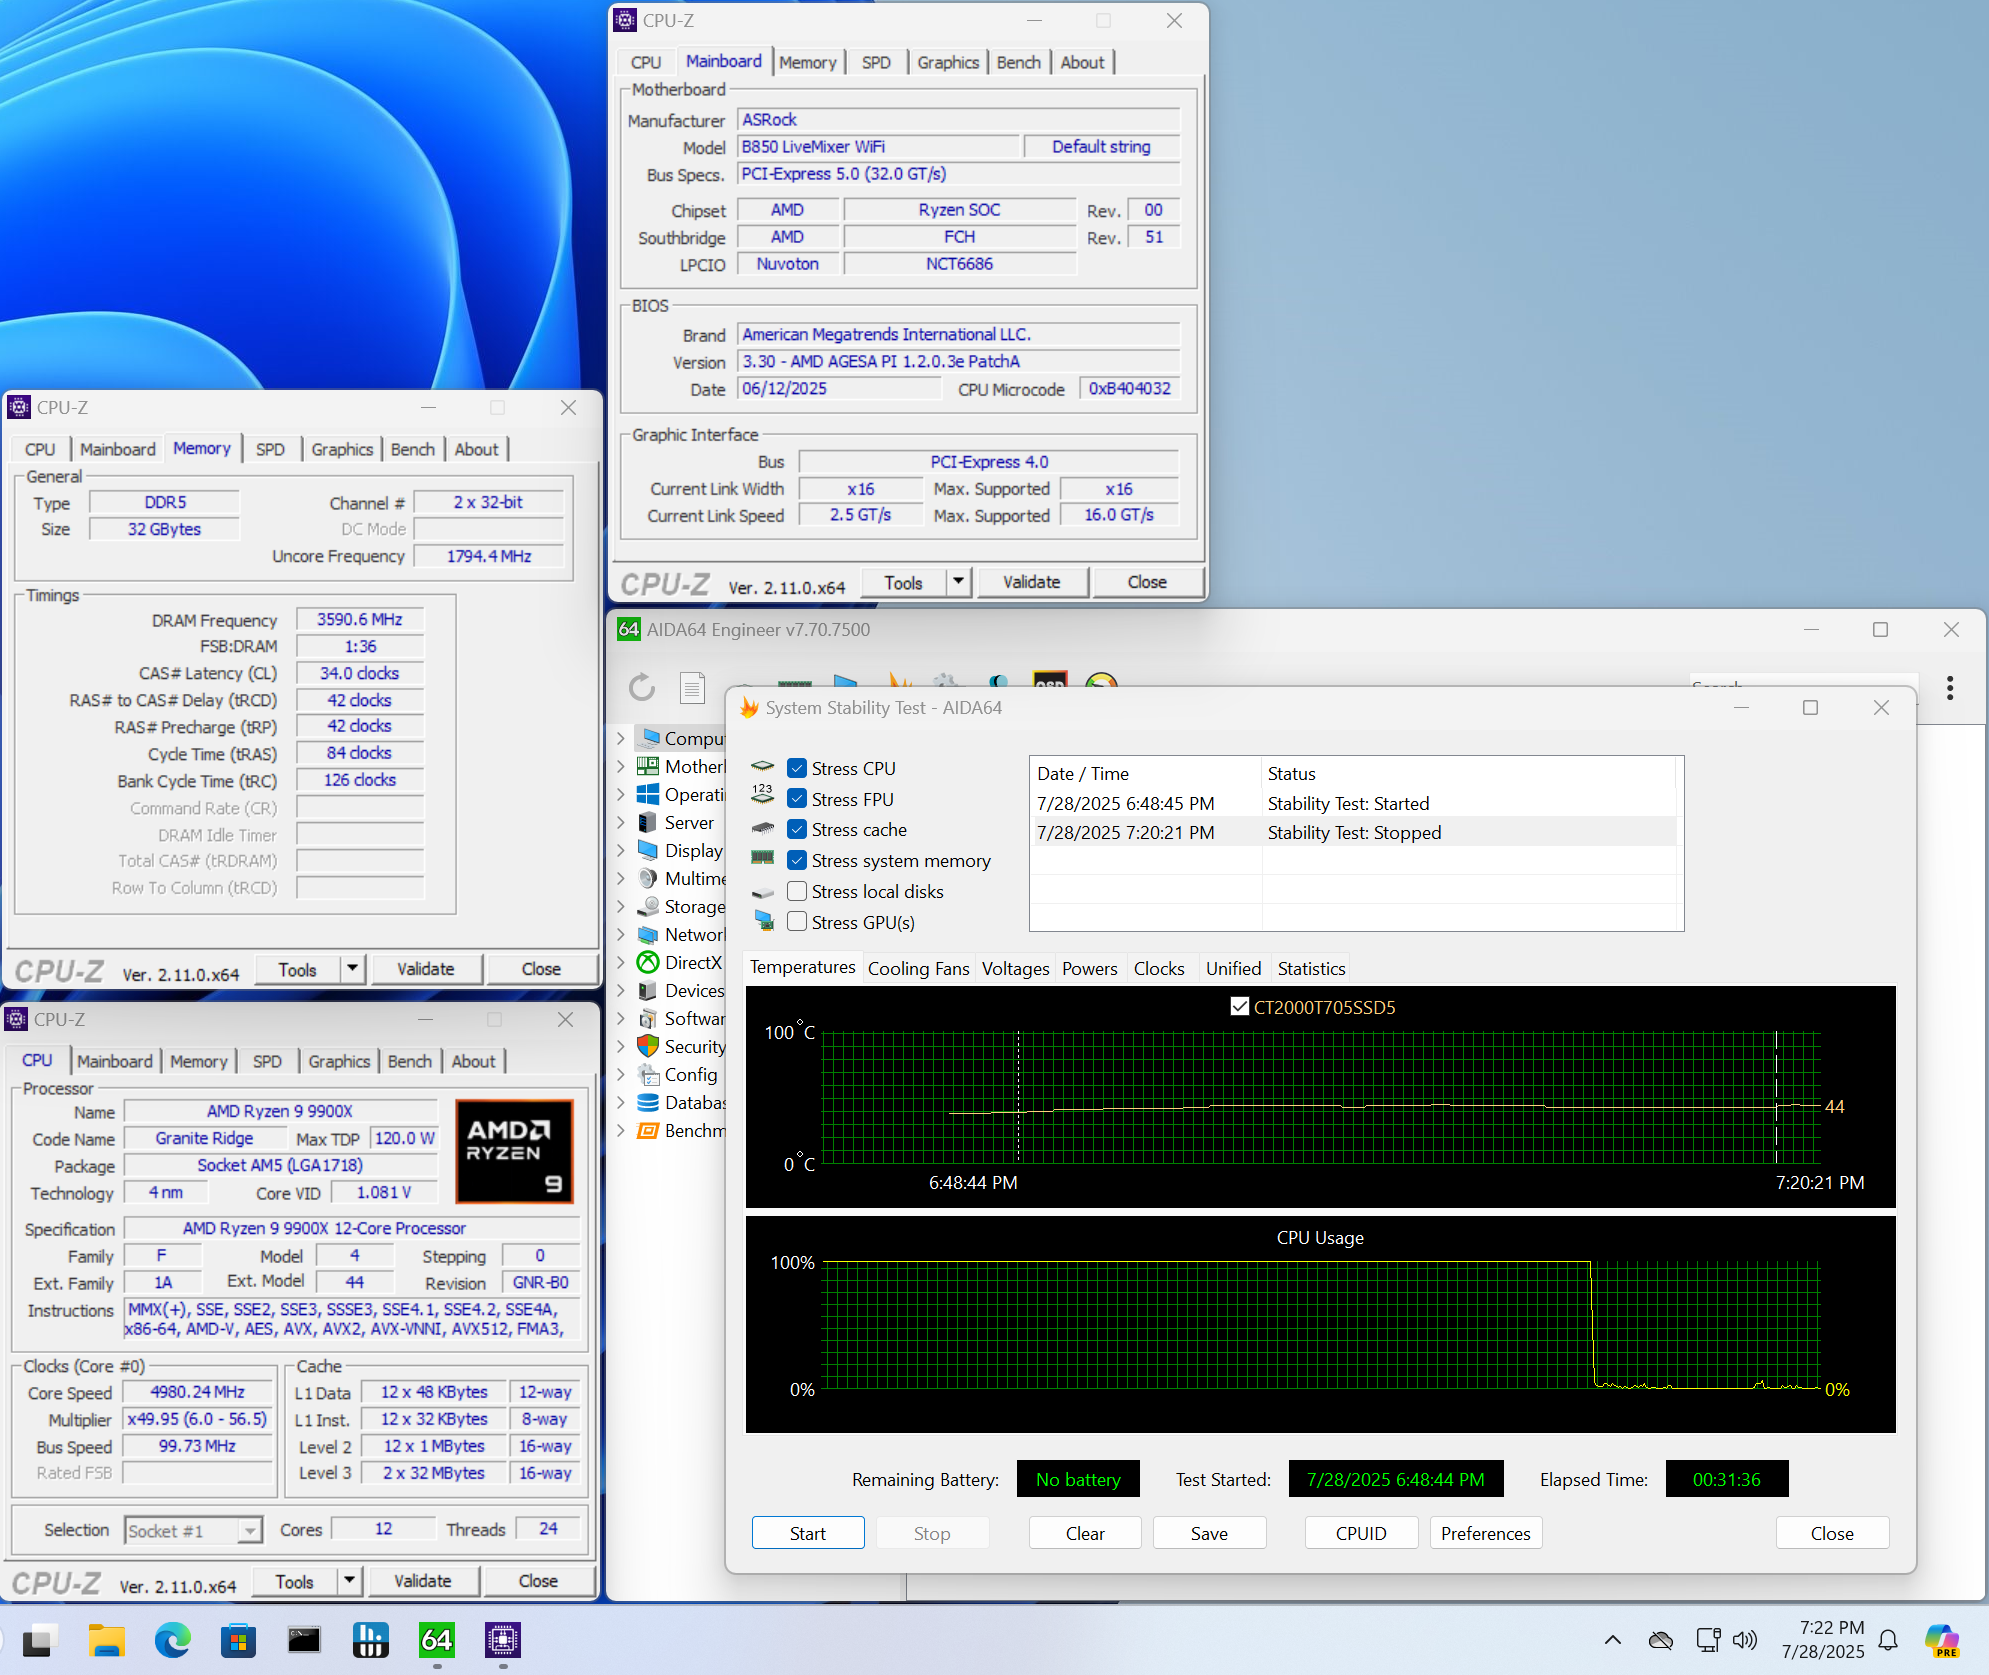
A familiar story emerges from these budget-class boards: We ran our Team Group DDR5-7200 kit through a 30-minute stress test without issue, but the DDR5-8000 kit we use also failed. That said, the board offers plenty of headroom if you want to tweak your RAM (though it seems to have access to fewer options than others) and other processor settings, including PBO or manual overclocking.
Power Consumption / VRM Temperatures
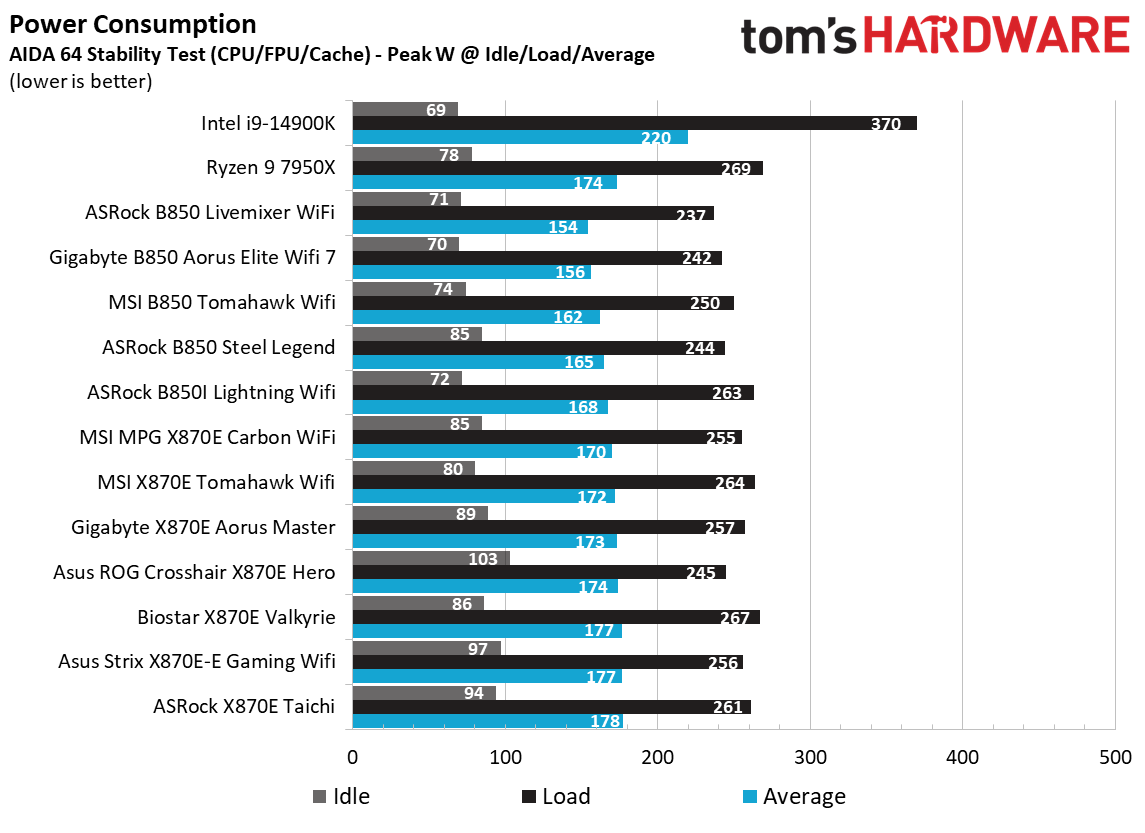
We used AIDA64’s System Stability Test with Stress CPU, FPU, Cache, and Memory enabled for power testing, using the processor's peak power consumption value. The wattage reading is obtained from the wall via a Kill-A-Watt meter, capturing the entire PC (excluding the monitor). The only variable that changes is the motherboard; all other parts remain the same. Please note that we moved to using only the stock power use/VRM temperature charts, as this section aims to ensure the power delivery can handle flagship-class processors.
The MSI B850 Livemixer peaked at 237W and idled at 71W, making it one of the most efficient all-around boards in our testing.
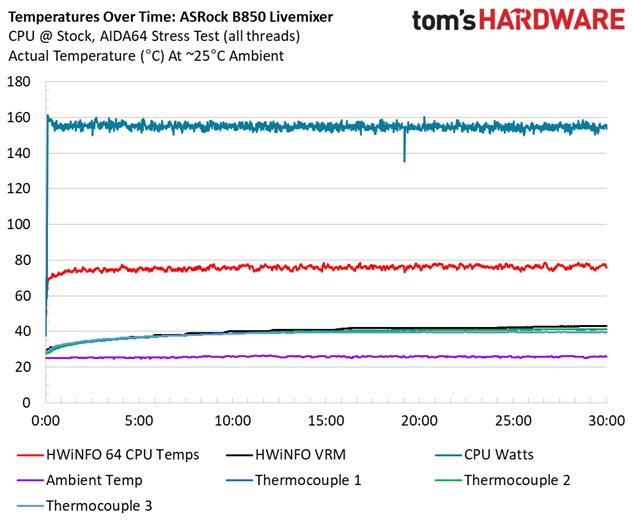
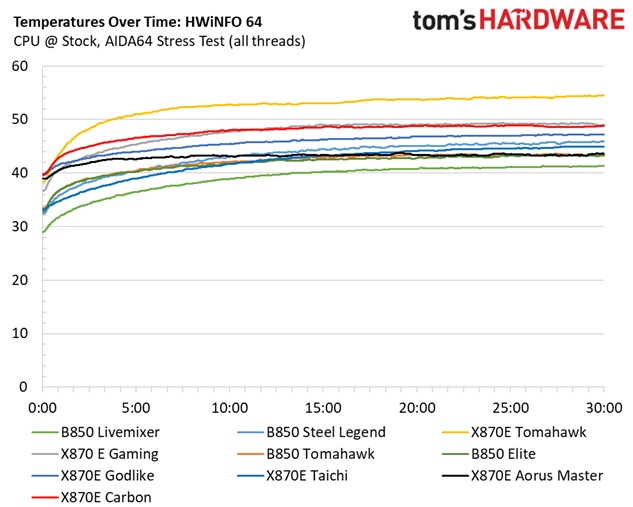
The Livemixer’s maximum VRM temperatures were well within specification. The capable power delivery and oversized heatsinks kept things temperatures at bay. The 80A MOSFETs peaked around 41 degrees Celsius on our sensors (and nearly spot on 43 degrees on the internal sensor), and the CPU averaged 139W.
Bottom Line
For an inexpensive motherboard, ASRock’s B850 Livemixer offers a wide variety of connectivity, including numerous USB ports on the rear I/O, and three PCIe slots for further expansion, all of which should help its intended audience: content creators. Performance was generally on par with the rest and offers the same flexibility as other motherboards at a similar price point. Aesthetics are more subdued this time around, featuring a black and silver theme, along with some RGB lighting, which offers users a board that should complement most build themes.
There are other capable AMD boards available round the $179-199 price point, but the Livemixer at $189.99 is one of the better options in the ATX space. If you need a lot of USB ports and three PCIe slots for a pittance, ASRock’s B850 Livemixer should be on your shortlist.
MORE: Best Motherboards
MORE: How To Choose A Motherboard
MORE: All Motherboard Content

Joe Shields is a staff writer at Tom’s Hardware. He reviews motherboards and PC components.
-
logainofhades With a chance of frying your CPU. I really hope Asrock figures out the issues they are having with Ryzen 9000. I really do like the looks of some of their boards.Reply -
PixelAkami Reply
Does it happen with other brands as well? Asking just on case I have to give advice to the one or two friends I have that run Ryzen.logainofhades said:With a chance of frying your CPU. I really hope Asrock figures out the issues they are having with Ryzen 9000. I really do like the looks of some of their boards. -
thestryker Reply
It was some sort of issue with ASRock and implementation within the BIOS that has supposedly been resolved. Given that it was a manufacturer specific issue this does seem believable however there are plenty of other options out there so I can see why people would still steer clear.PixelAkami said:Does it happen with other brands as well? Asking just on case I have to give advice to the one or two friends I have that run Ryzen. -
logainofhades ReplyPixelAkami said:Does it happen with other brands as well? Asking just on case I have to give advice to the one or two friends I have that run Ryzen.
Asus had a similar issue with the 7800x3d early on, but was resolved. Personally, I stick with Gigabyte for AMD boards.
