One SSD Vs. Two In RAID: Which Is Better?
Results: I/O Benchmark Profiles (Iometer)
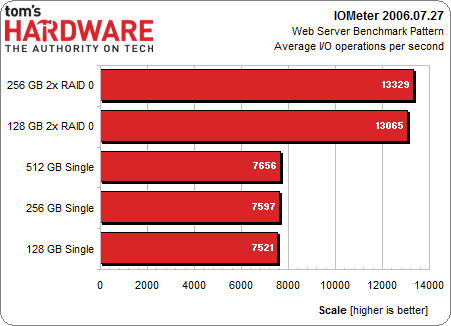
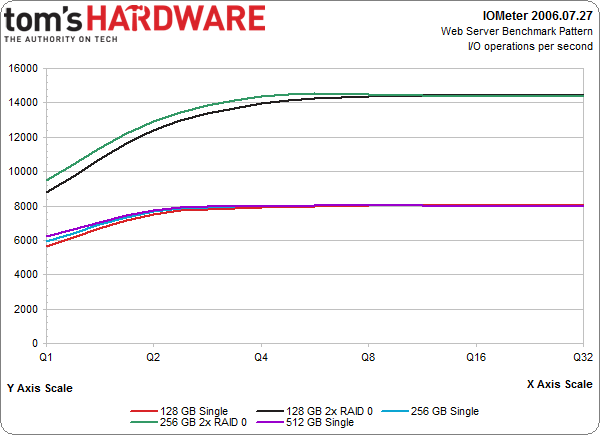
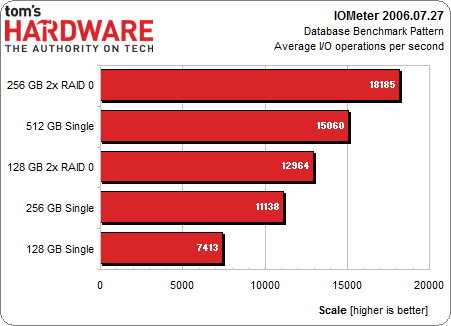
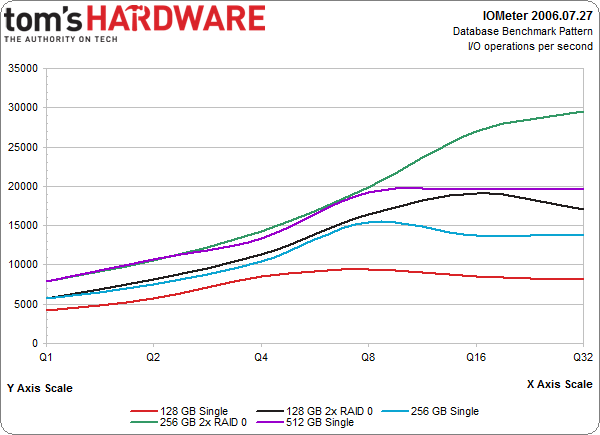
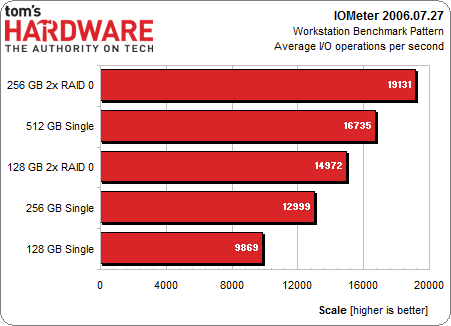
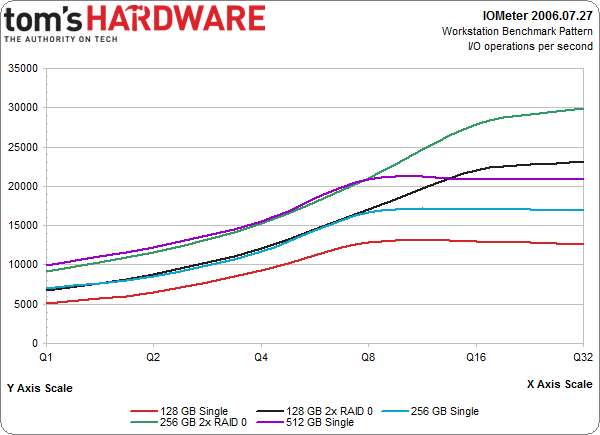
Again, the bar charts represent average performance from a queue depth of one through 32 in three benchmark profiles: database, Web server, and workstation.
The two RAID 0 arrays manage to clearly draw ahead of the single drives across all queue depths in Iometer’s Web server benchmark profile. Can anyone guess the access pattern in play? That's right, 100% reads. Could have seen that one coming, right?
However, the database and workstation profiles convey less scaling at queue depths up to eight. Up until that point, the Samsung 840 Pro 512 GB performs about the same as the two 256 GB SSDs in RAID 0. The same is true for the single 256 GB SSD and two striped 128 GB SSDs.
Get Tom's Hardware's best news and in-depth reviews, straight to your inbox.
Current page: Results: I/O Benchmark Profiles (Iometer)
Prev Page Results: Access Time Next Page Results: PCMark 7 And PCMark Vantage-
pocketdrummer I just bought a Samsung 840 Pro 512Gb. I plan to buy another and RAID 0 them, but not for speed. I just want 1TB of storage on an SSD. I dual boot and have a ton of Pro Audio applications and games I'd like to load quickly. I know it's an absurd amount of money for storage, but it makes me happy.Reply
2nd kind of cool, right? -
Kamab Putting them in RAID0 doubles your chance of data failure, aka either drive fails and you probably lose everything.Reply -
Xazax310 You dont have to RAID 0 them just to get more storage it be safer just to have them seperate, as 500GB/500GB drivesReply -
JonnyDough What they're saying is that even large game file load times won't be cut much, if at all. RAID with high speed SSDs on a home system makes very little sense. Without a fast (and expensive) dedicated hardware RAID card there's pretty much ZERO point in doing raid for home use.Reply -
slyu9213 pocketdrummerI just bought a Samsung 840 Pro 512Gb. I plan to buy another and RAID 0 them, but not for speed. I just want 1TB of storage on an SSD. I dual boot and have a ton of Pro Audio applications and games I'd like to load quickly. I know it's an absurd amount of money for storage, but it makes me happy.2nd kind of cool, right?Reply
If you don't care about the speed boost of RAID 0 I would suggest you not RAID 0 them but just use them separately as two 512GB drives. By doing this you have less risk of losing all of your data because your data won't be mixed through both drives.
KamabPutting them in RAID0 doubles your chance of data failure, aka either drive fails and you probably lose everything.
Which was already stated in the article/benchmark. Real world differences are too small, maybe even worse in half of the tests. One positive is for the raw video captures like at the end of the article. -
JackNaylorPE I don't see the "surprise". This has always been true of RAID 0....here's some oldies :)Reply
http://en.wikipedia.org/wiki/RAID_0#RAID_0
RAID 0 is useful for setups such as large read-only NFS servers where mounting many disks is time-consuming or impossible and redundancy is irrelevant.
RAID 0 is also used in some gaming systems where performance is desired and data integrity is not very important. However, real-world tests with games have shown that RAID-0 performance gains are minimal, although some desktop applications will benefit.
http://www.anandtech.com/printarticle.aspx?i=2101
"We were hoping to see some sort of performance increase in the game loading tests, but the RAID array didn't give us that. While the scores put the RAID-0 array slightly slower than the single drive Raptor II, you should also remember that these scores are timed by hand and thus, we're dealing within normal variations in the "benchmark".
Our Unreal Tournament 2004 test uses the full version of the game and leaves all settings on defaults. After launching the game, we select Instant Action from the menu, choose Assault mode and select the Robot Factory level. The stop watch timer is started right after the Play button is clicked, and stopped when the loading screen disappears. The test is repeated three times with the final score reported being an average of the three. In order to avoid the effects of caching, we reboot between runs. All times are reported in seconds; lower scores, obviously, being better. In Unreal Tournament, we're left with exactly no performance improvement, thanks to RAID-0
If you haven't gotten the hint by now, we'll spell it out for you: there is no place, and no need for a RAID-0 array on a desktop computer. The real world performance increases are negligible at best and the reduction in reliability, thanks to a halving of the mean time between failure, makes RAID-0 far from worth it on the desktop.
Bottom line: RAID-0 arrays will win you just about any benchmark, but they'll deliver virtually nothing more than that for real world desktop performance. That's just the cold hard truth."
http://www.techwarelabs.com/articles/hardware/raid-and-gaming/index_6.shtml
".....we did not see an increase in FPS through its use. Load times for levels and games was significantly reduced utilizing the Raid controller and array. As we stated we do not expect that the majority of gamers are willing to purchase greater than 4 drives and a controller for this kind of setup. While onboard Raid is an option available to many users you should be aware that using onboard Raid will mean the consumption of CPU time for this task and thus a reduction in performance that may actually lead to worse FPS. An add-on controller will always be the best option until they integrate discreet Raid controllers with their own memory into consumer level motherboards."
http://www.hardforum.com/showthread.php?t=1001325
"However, many have tried to justify/overlook those shortcomings by simply saying "It's faster." Anyone who does this is wrong, wasting their money, and buying into hype. Nothing more."
http://jeff-sue.suite101.com/how-raid-storage-improves-performance-a101975
"The real-world performance benefits possible in a single-user PC situation is not a given for most people, because the benefits rely on multiple independent, simultaneous requests. One person running most desktop applications may not see a big payback in performance because they are not written to do asynchronous I/O to disks. Understanding this can help avoid disappointment."
http://www.scs-myung.com/v2/index. om_content
"What about performance? This, we suspect, is the primary reason why so many users doggedly pursue the RAID 0 "holy grail." This inevitably leads to dissapointment by those that notice little or no performance gain.....As stated above, first person shooters rarely benefit from RAID 0.__ Frame rates will almost certainly not improve, as they are determined by your video card and processor above all else. In fact, theoretically your FPS frame rate may decrease, since many low-cost RAID controllers (anything made by Highpoint at the tiem of this writing, and most cards from Promise) implement RAID in software, so the process of splitting and combining data across your drives is done by your CPU, which could better be utilized by your game. That said, the CPU overhead of RAID0 is minimal on high-performance processors." -
JonnyDough It made more sense with hard drives when they were very slow. Overall I felt I noticed slightly reduced overall system performance on socket 939 back in the day with my dual raptor drives, however larger game save files (ie Oblivion) seemed to see a slight reduction in overall load times.Reply -
Matsushima Would also have liked to seen storage controller benchmarks like motherboard chipsets vs specialised RAID controllers. I remember Tom's did an article on RAID controllers and migration back in 2005. DFI had not quit the enthusiast market back then.Reply -
JonnyDough Although dedicated RAID controllers might change this a bit, when you consider that software raid on a modern high end CPU will use very little of the overall CPU power, I'm not sure it would make much difference if any.Reply -
jase240 I understand RAID0 is more dangerous, but I myself plan on using 2x 256GB in RAID0 soon. The speed gains might not be there in applications but right now 2 256GB drives are cheaper than 1 512GB drive on newegg.com, $479.98 vs $499.99.Reply
And as far as data loss in case of failure, don't use an SSD to store you data, use a separate HDD to store any important data(I have a 2TB drive).
However it all comes to opinion, some users don't want to worry about RAID nor take the time to setup(I don't blame them either).
