Is the Acer F20 the Ferrari of LCD Monitors?
Acer Ferrari F20: Familiar Performance
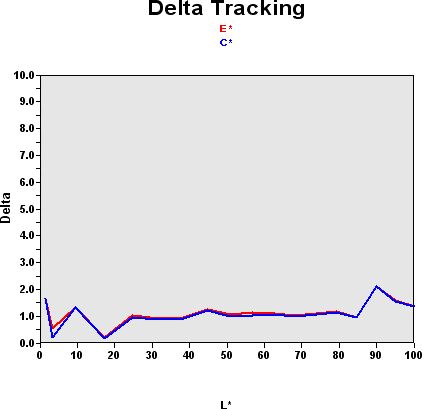
In our calibrator test, the F20 showed performance similar to that of the AL2032W.

Recall that this graph shows the difference between the desired color shade and the one that was actually displayed.
- If DeltaE >3, the color displayed is significantly different from the theoretical one, meaning that the difference will be perceptible to the viewer.
- If DeltaE <2, LaCie considers the calibration a success, with a slight difference remaining, but one that will be all but undetectable to the user.
- If DeltaE < 1, color fidelity is excellent.
The color rendering here wasn't ideal, but while less than 80% of the colors were perfect, 98% were good. Overall, the performance resembled that of the AL2032W. We'll mention in passing that the control of color temperature was not very good overall. Warm was at 5800K, cold at 7500K. When we readjusted the controls and employed user parameters (Red = 79, Green = 83, Blue = 100), we achieved significantly better performance.
| Black spot | White spot | Contrast |
|---|---|---|
| 0.4 | 273 | 682: 1 |
The monitor's brightness was a little too high, but still the black level was astoundingly low, which resulted in an excellent contrast ratio of more than 680:1. Still it would be better if the brightness weren't so elevated.

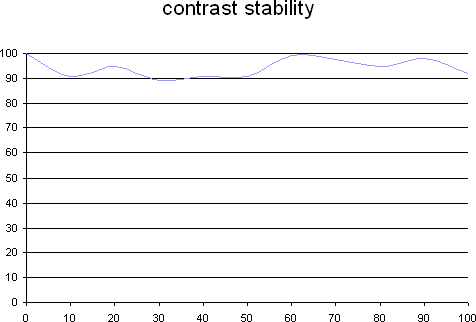
The contrast was "fairly" stable. Though the values didn't stray much beyond the 90-100% range, they did yo-yo around a bit. We've seen better, but in general, we have to admit that monitor makers have made significant improvements in this area compared to the previous generation of LCD units.
This curve indicates the contrast value measured at a given brightness adjustment level on the OSD. In theory, brightness and contrast are two independent parameters, and good contrast is a requirement regardless of the brightness adjustment. Unfortunately such is not the case in practice.
The brightness adjustment is shown on the X-axis, contrast on the Y-axis. Contrast is expressed here as a percentage of the maximum value measured using the ANSI test protocol. If you want to know more about this topic, refer to this article.
Stay on the Cutting Edge
Join the experts who read Tom's Hardware for the inside track on enthusiast PC tech news — and have for over 25 years. We'll send breaking news and in-depth reviews of CPUs, GPUs, AI, maker hardware and more straight to your inbox.
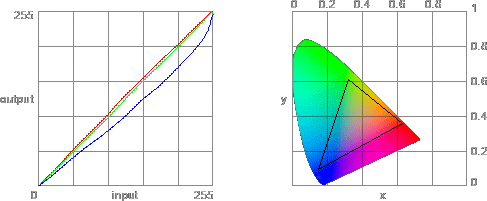
Tested with the Gretag Eye-One Display 2, the F20 wasn't all that impressive. The panel's color range covered the sRGB color space and no more, so you'll have to settle for that.

The color gamut represents the richness of the colors displayed. The corners of the triangle are the primary colors (in additive synthesis, of course). The surface of the triangle represents all colors that are displayable by combining the three primary colors with more or less intensity for each. So the greater the area of the triangle, the richer the colors.
Current page: Acer Ferrari F20: Familiar Performance
Prev Page Ergonomics Next Page Spatial UniformityMost Popular

