Why you can trust Tom's Hardware
AMD Ryzen 9 9950X Power Consumption and Efficiency
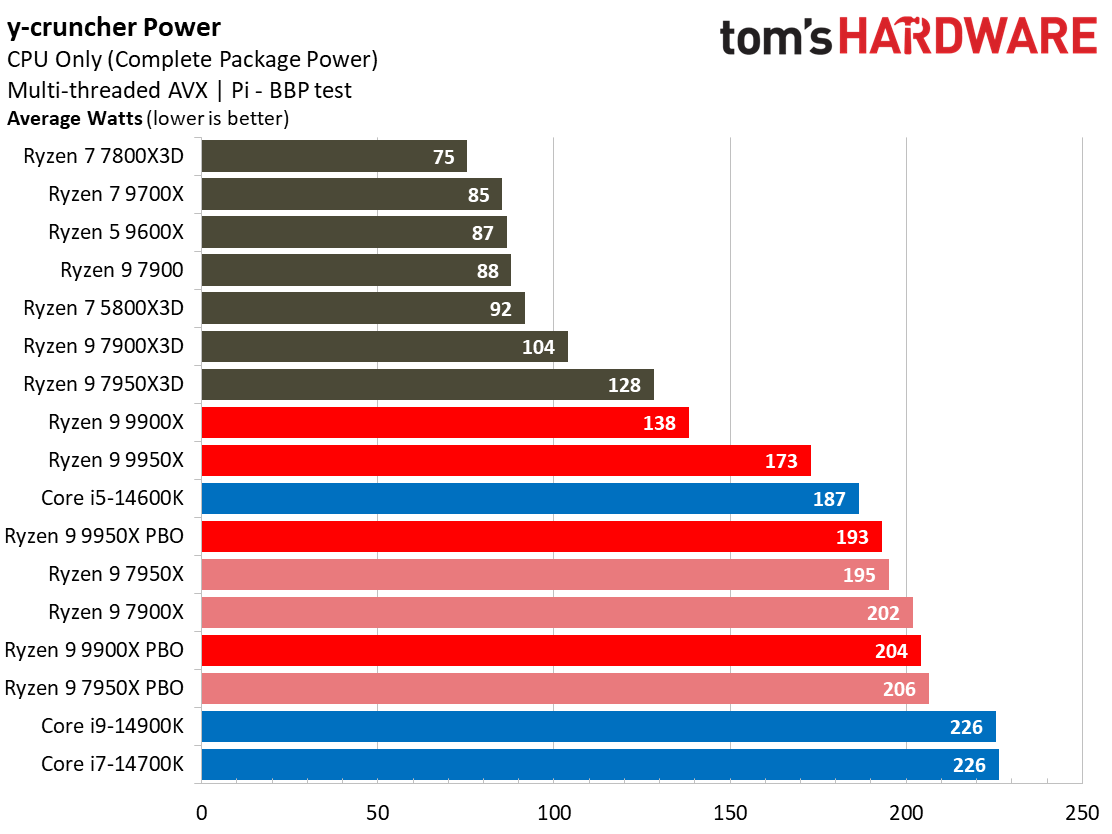
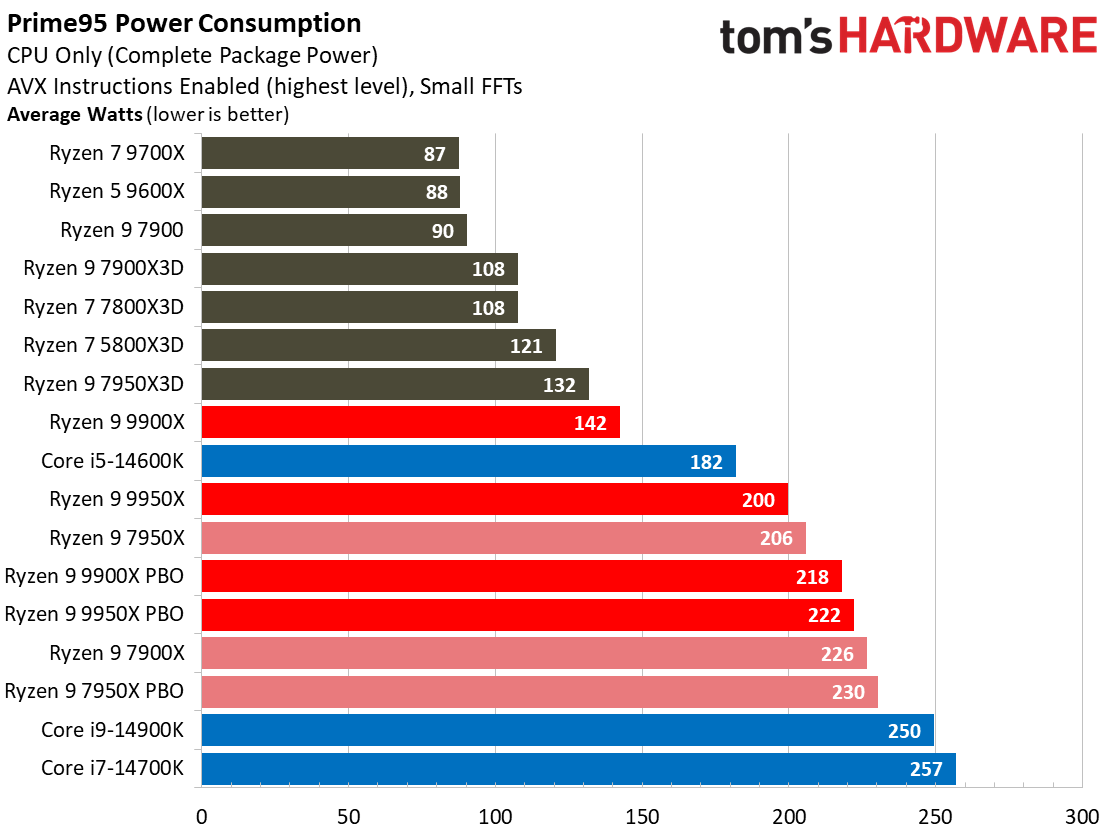
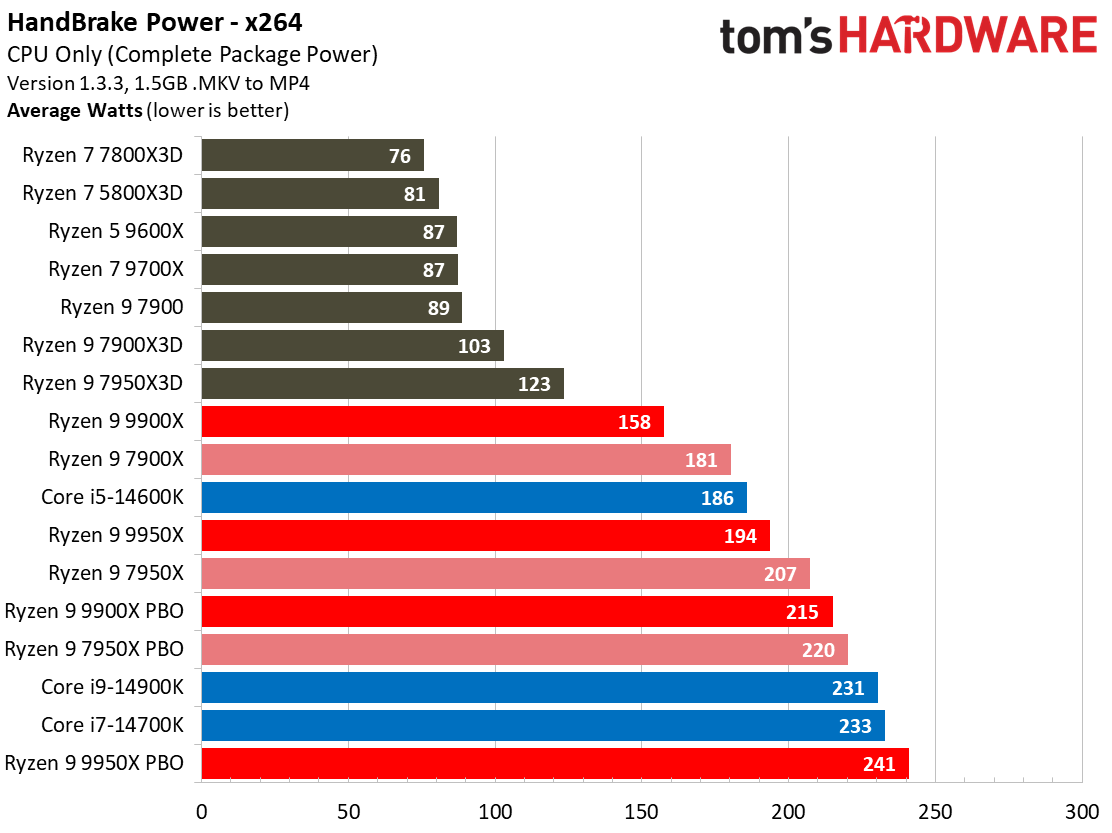
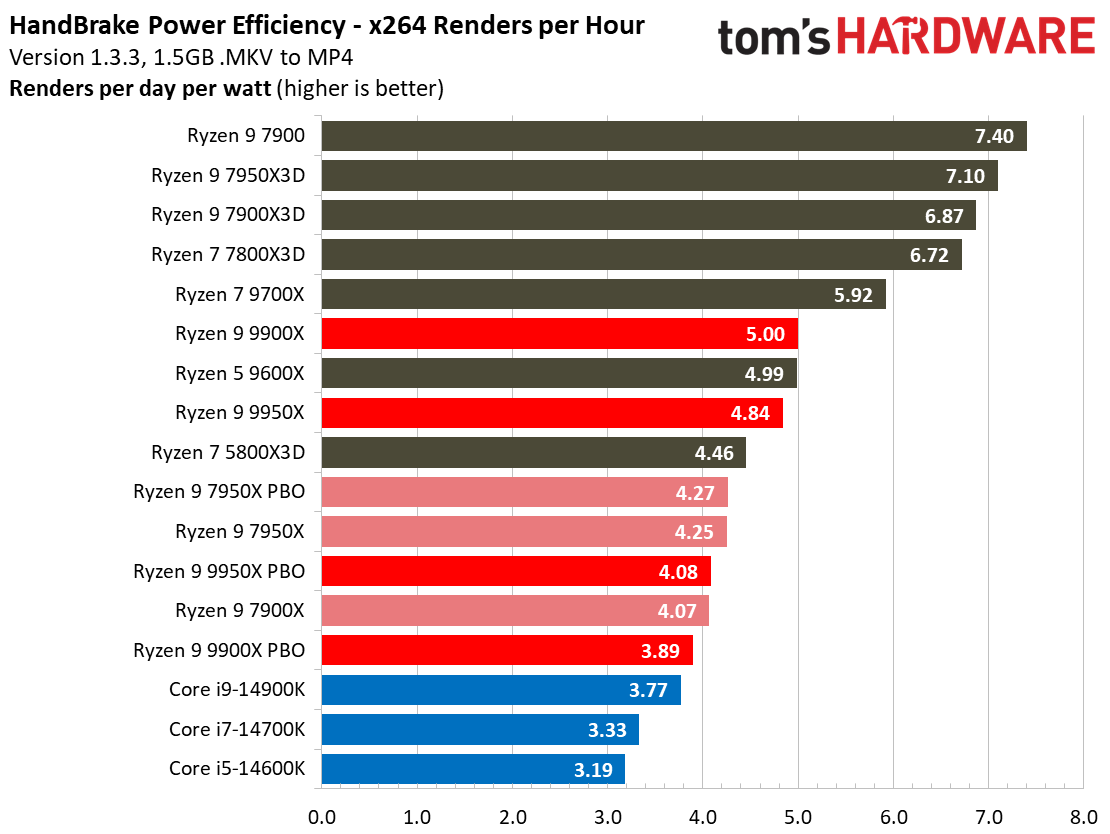
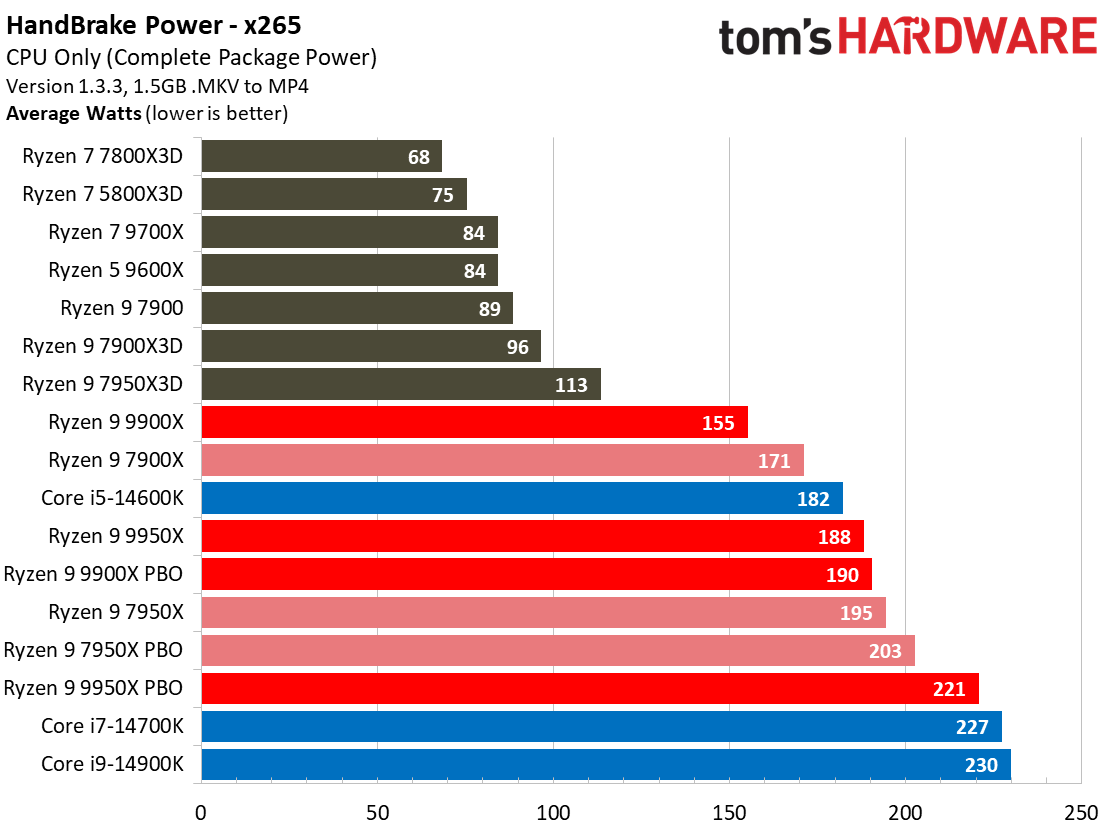
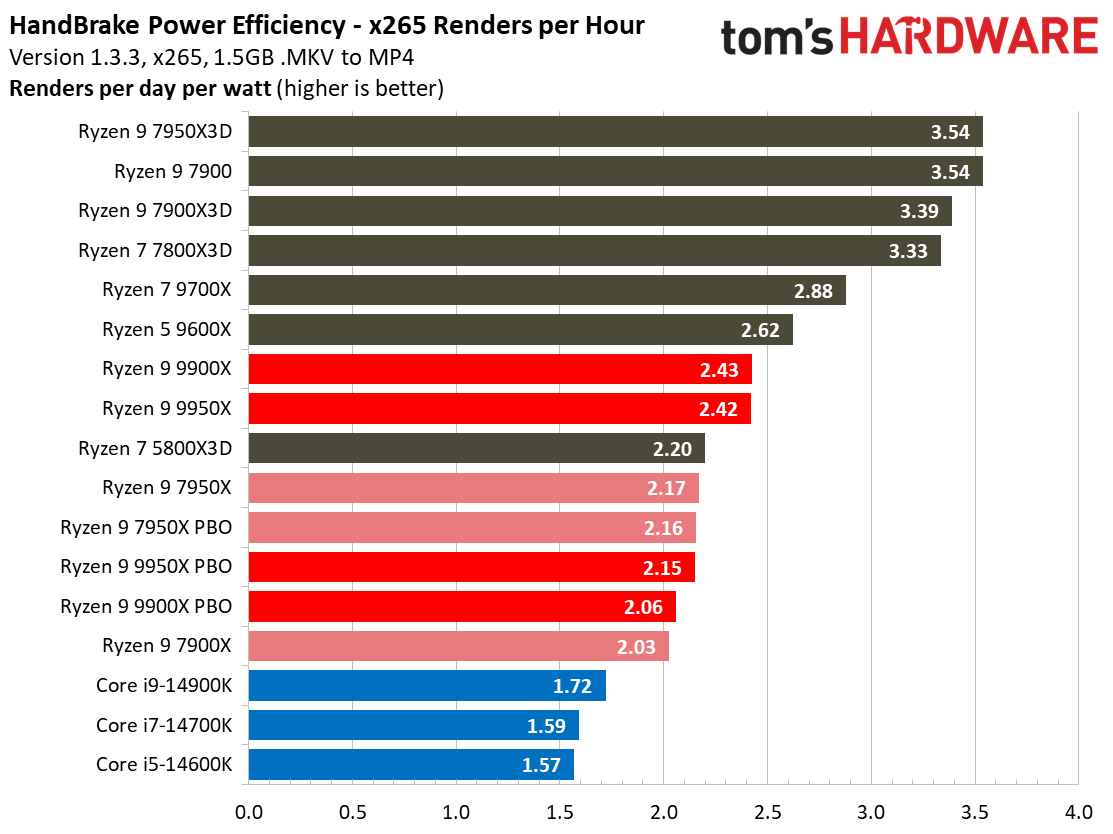
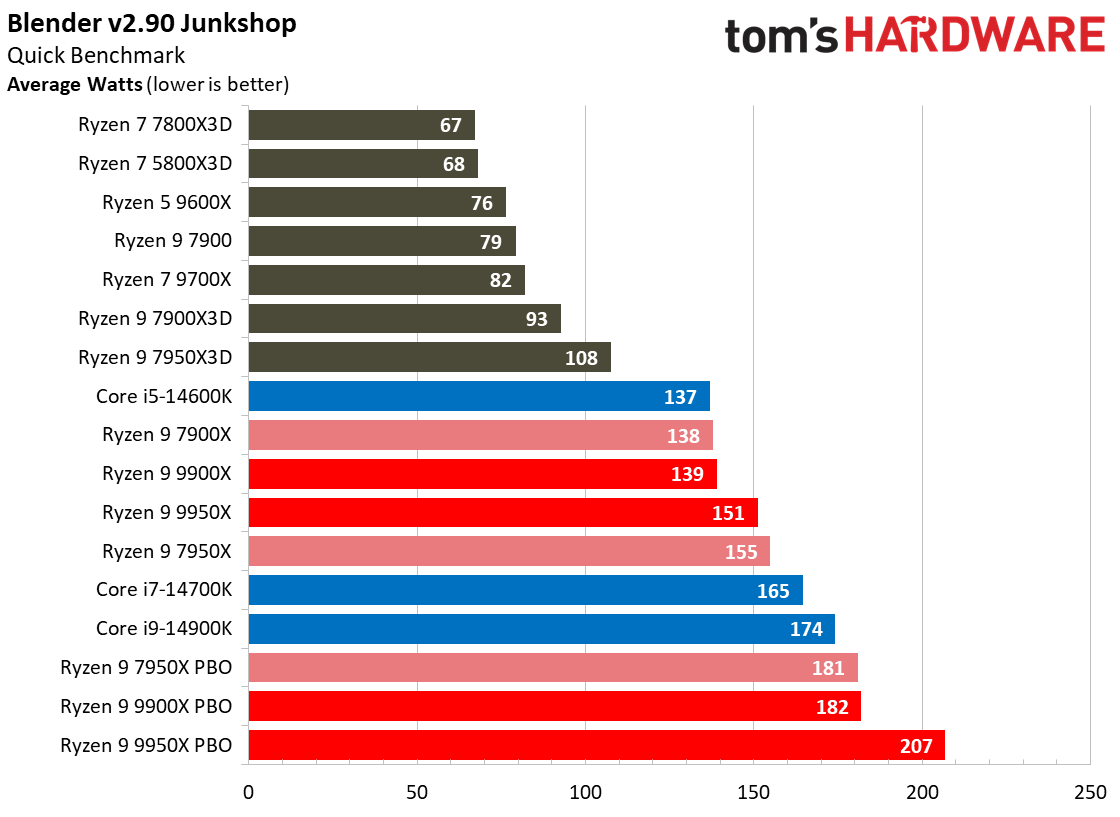
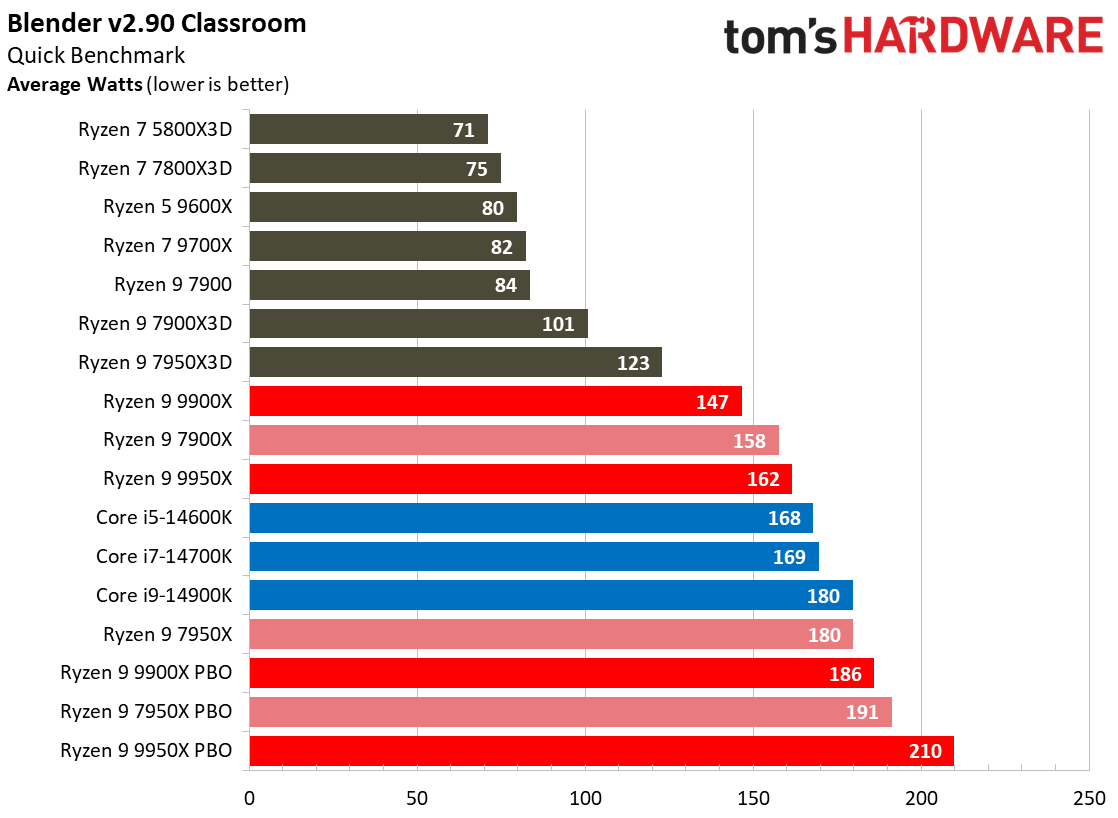
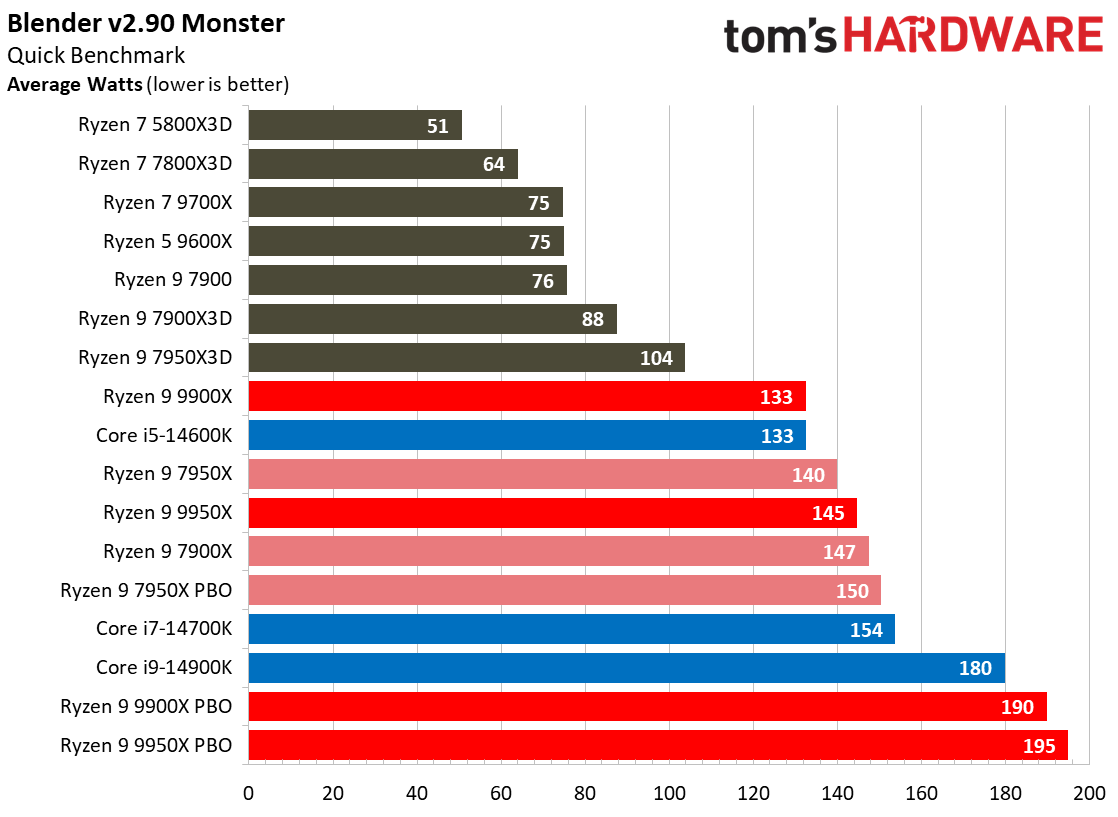
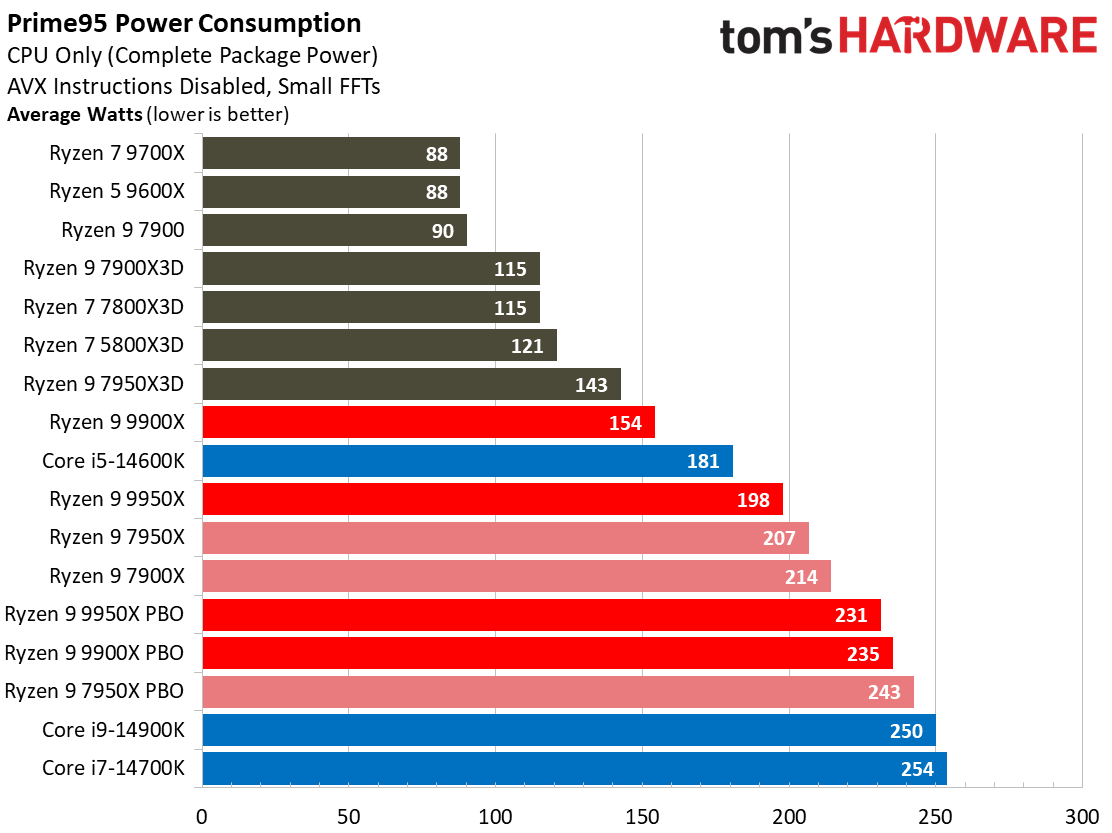
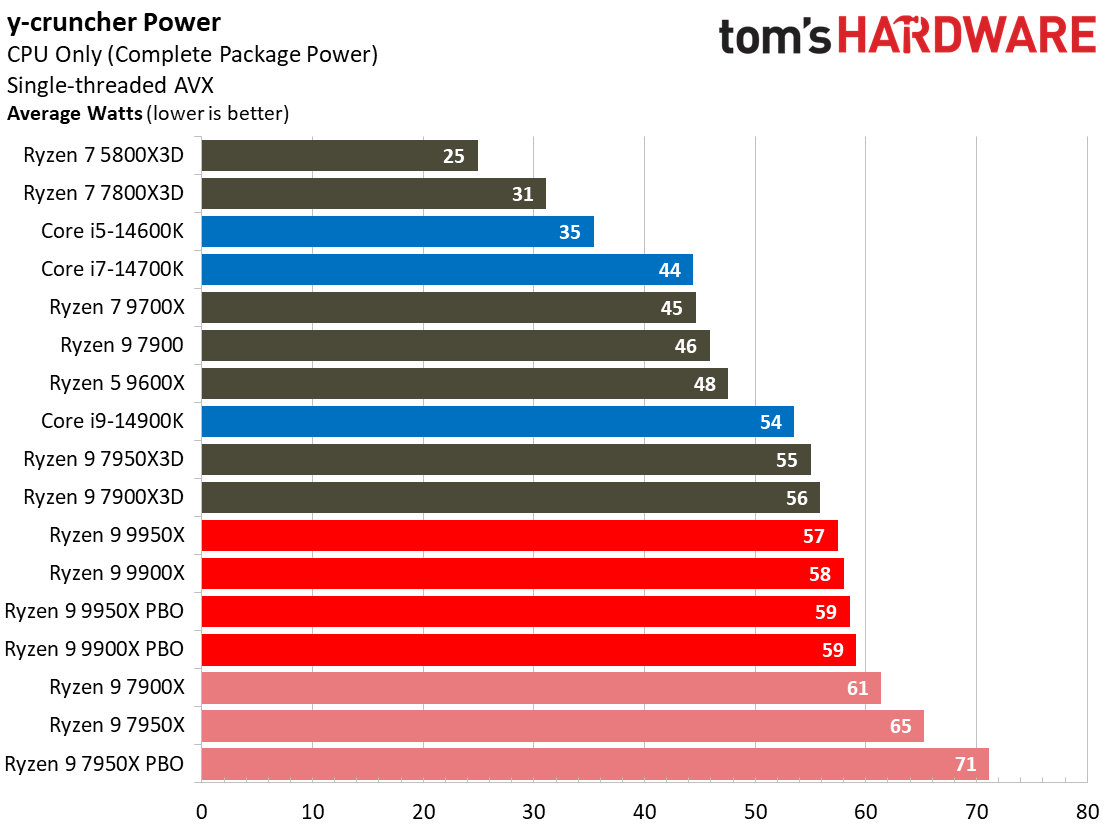
The Ryzen 9 9950X has the same 170/230W TDP rating as its prior-gen counterpart, the 7950X, but it does consume 7–15 percent less power in a range of workloads, like y-cruncher BBP, HandBrake, and a few of the Blender renders. The 9950X delivers more performance than its predecessor with less power, but the efficiency gains will vary by workload.
We recorded a 10% and 15% generational improvement in power efficiency in the HandBrake x264 and x265 renders, respectively, while the 9950X also beat the Intel Core i9-14900K in our efficiency metrics by large margins. The Ryzen 9 9950X consumed less power at stock settings than the Core i9-14900K across the board, with deltas ranging between 10% to 23%.
In real-world workloads, we recorded a peak of 194W in HandBrake x265 and 200W in the synthetic Prime95 stress test. Uncorking the 9950X’s TDP with the auto-overclocking PBO allows the chip to draw more power, with a peak in real-world workloads of 210W in the Blender Classroom render and 235W in Prime95 with AVX instructions disabled. The Ryzen 9 9950X does consume more power with PBO enabled than the 14900K at stock, but the 14900K would exceed the 9950X if it were similarly overclocked.
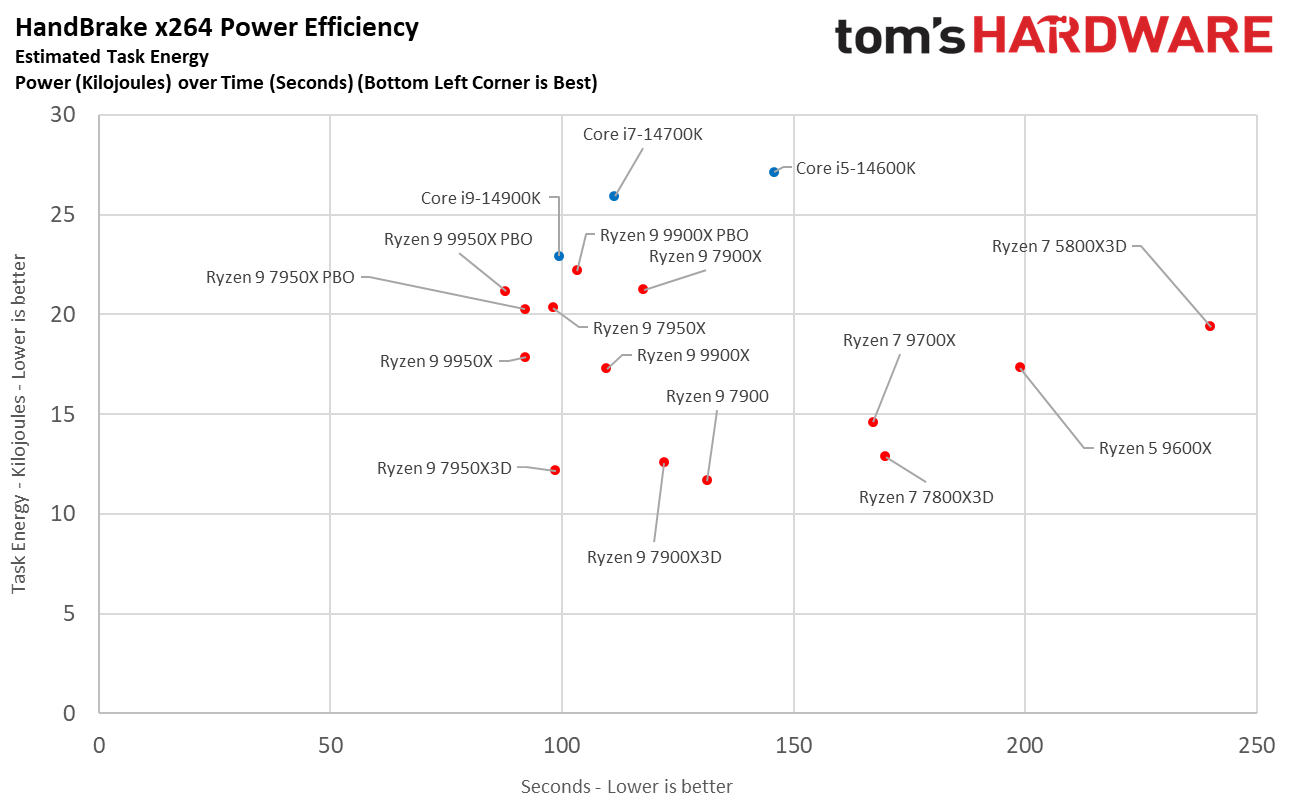
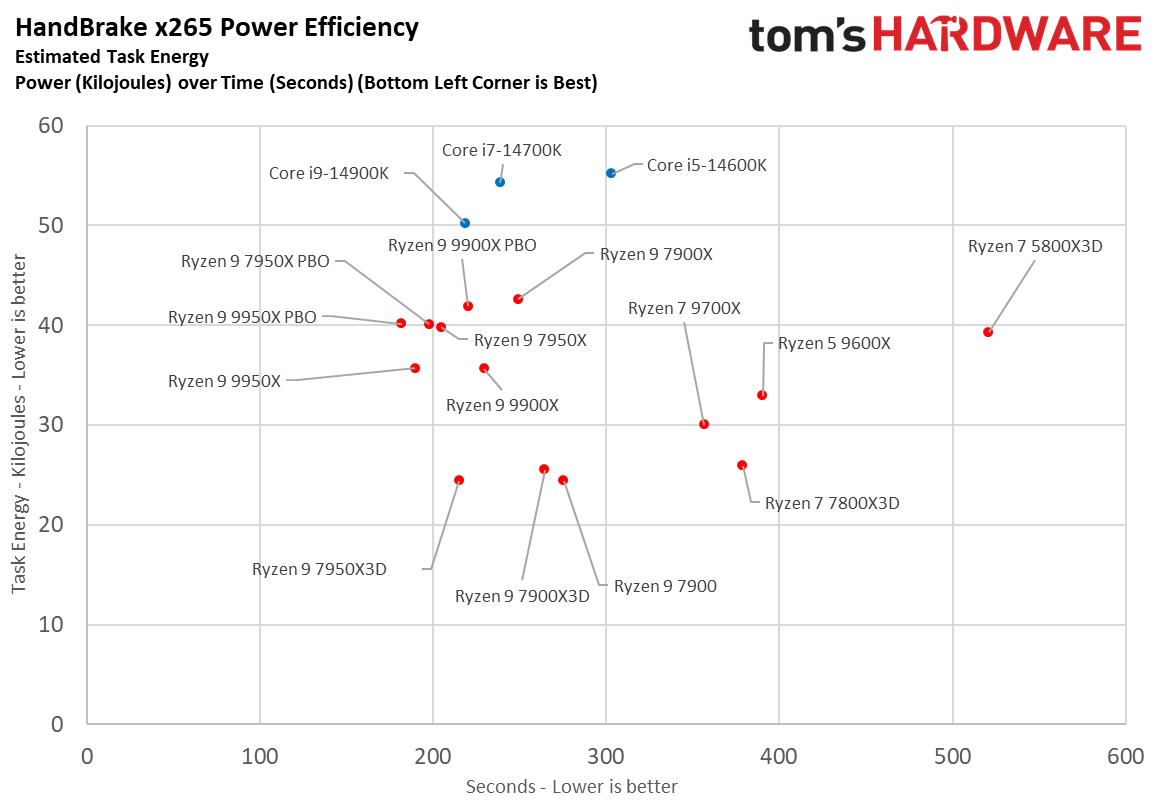
These charts take a slightly different look at power consumption by plotting the cumulative energy required to execute an x264 and x265 HandBrake workload. We plot this 'task energy' value in Kilojoules on the left side of the chart, with time charted on the x-axis.
These workloads consist of a fixed amount of work, so we can plot the task energy against the time required to finish the job (bottom axis), thus generating a useful power chart. Faster compute times and lower task energy are ideal. That means processors that fall the closest to the bottom left corner of the chart are the best.
The lower-power 7900X3D and non-X processors land in the sweet spot of power efficiency, a natural byproduct of their lower spot on the power/efficiency curve. The Ryzen 9 9950X provides a moderately better blend of power and performance than the older 7950X and is more efficient than the Intel models.
AMD Ryzen 9 9950X Thermals and Boost Testing
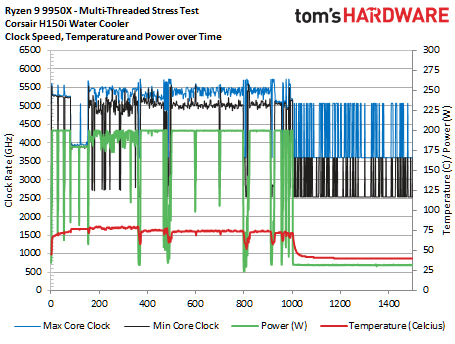
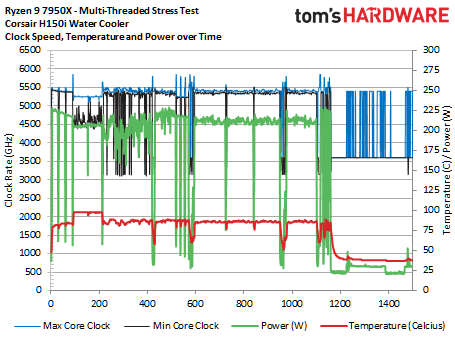
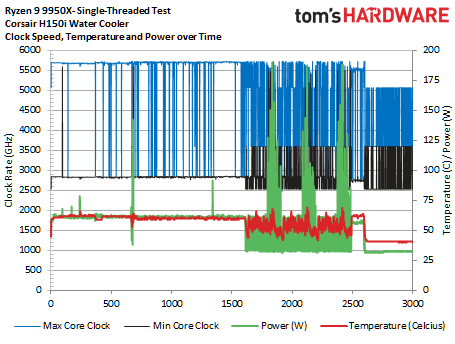
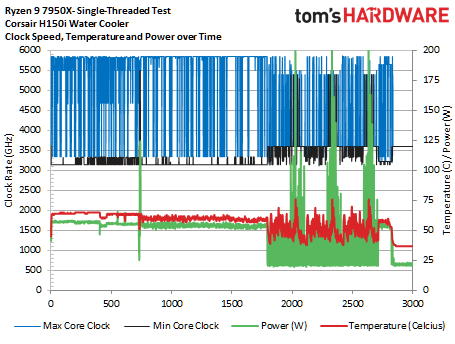
We ran through a spate of standard heavily threaded applications (Corona, AVX-heavy y-cruncher, HandBrake, POV-Ray, Cinebench, and Blender) to measure power and thermals in multi-threaded work, and then another series of lightly-threaded apps to check performance in lighter fare (POV-Ray sT, LAME, Cinebench sT, Geekbench 6, y-cruncher sT). We tested both the Ryzen 9 9950X and 7950X under the same conditions.
The Ryzen 9 9950X peaked at 200W during the multi-threaded test, whereas the previous-gen 7950X peaked at 228W. As you can see in the bottom axis, the 7950X completed the workload in roughly 1,100 seconds while the 9950X finished a minute and a half earlier.
Interestingly enough, the 7950X operated at a higher average frequency during key parts of the workload, particularly during the AVX-heavy y-cruncher and Cinebench 2024 benchmark, due to the full AVX-512 datapath on the 9950X. Temperatures peaked at 99C for the 7950X, whereas the 9950X peaked at 80C. The single-threaded test shows the 9950X easily reaching its 5.7 GHz rated boost speed.
AMD Ryzen 9 9950X Overclocking and Test Setup
- Ryzen 9 9950X: Default power limits, DDR5-5600
- Ryzen 9 9950X PBO: Precision Boost Overdrive (PBO) — advanced motherboard, 10X scalar, +200 MHz CPU clock, -10 Curve Optimizer, DDR5-6000 EXPO profile (fabric 2000 MHz, mclk/uclk 1:1)
- Ryzen 9 9900X: Default power limits, DDR5-5600
- Ryzen 9 9900X PBO: Precision Boost Overdrive (PBO) — advanced motherboard, 10X scalar, +200 MHz CPU clock, -20 Curve Optimizer, DDR5-6000 EXPO profile (fabric 2000 MHz, mclk/uclk 1:1)
We encountered somewhat inconsistent performance during our gaming tests, with the 9950X and 9900X exhibiting more variability between separate full test runs of our suite than we’re accustomed to. At times, this amounted to a 3–5 percent delta between runs, but even the variance was inconsistent — it could vary by title and by run, indicating something is potentially amiss.
As noted in the introduction, we noticed that AMD’s core parking mechanisms sometimes allow the cores to slip in and out of a parked state for a few seconds during gaming. This seems to happen randomly, and while it isn’t ideal, we aren’t sure how it impacts our test results. The erratic gaming behavior could also be the result of other problems with the early, raw motherboard firmware.
We do know that when installed correctly, this same core parking mechanism has worked very well with the Ryzen 7000X3D processors in all our previous testing, so it isn’t clear if this is an early driver/firmware teething issue or just an issue specific to our test bed.
AMD didn’t notify us of the core parking feature until very late in the review process, but this created an issue. As we’ve covered in the past, the core parking feature has a known issue — it can’t be uninstalled from the operating system. As such, once you’ve installed an AMD chip that uses the special core parking mechanism, you’re stuck with it for the life of your operating system. If you later install another processor with the same operating system, the feature will persist and can continue to park cores (potentially unbeknownst to the user), thus reducing performance with processors that aren’t designed to use the feature. Naturally, this can be extremely problematic for our test bed.
The late notice from AMD necessitated sanity retests on several of the chips in our test pool, ultimately not leaving us time to fully diagnose the issue with Ryzen 9000’s core parking on our system. We’re revisiting our testing with the Ryzen 9000 processors to double-check our findings — we’ll update as necessary. In the meantime, be sure to check multiple reviews for gaming performance results to get a broader view.
We tested the Ryzen 9 9900X and Ryzen 9 9950X in standard stock trim and with overclocked memory coupled with the auto-overclocking Precision Boost Overdrive (PBO) feature. We used the DDR5-6000 EXPO profile for the Ryzen 9 9950X PBO configuration in tandem with Precision Boost Overdrive (PBO) with the advanced 'motherboard' power presets. We then enabled a 10X scalar, 200 MHz extra boost for the CPU cores, and a -10 undervolt using the Curve Optimizer (we used a -20 offset for the 9900X PBO config).
As noted in the introduction, Intel’s instability issue can potentially impact all its 65W and higher CPUs, and an unknown percentage of the processors experience the issues. Intel has released a new microcode patch to address the instability issues, and we have retested the Intel processors with the new microcode and higher ‘extreme’ power limits for this review. We do see a marked performance improvement, particularly in gaming, but this should not be taken as an improvement from the new microcode update — all performance increases are attributable to the higher power limits we used for this review. We did notice a slight regression in Hitman 3, which Intel has also acknowledged in its microcode announcement, but all other indicators point to slight performance differences that fall within the margin of error.
Microsoft has advised gamers to turn off several security features to boost gaming performance. For maximum performance, we disabled secure boot, virtualization support, and fTPM/PTT on all systems. The table below provides further hardware details.
| Intel Socket 1700 DDR5 (Z790) | Core i5-14600K, Core i3-14100, Core i7-14700K |
| Motherboard | MSI Z790 Carbon Wifi |
| RAM | G.Skill Trident Z5 RGB DDR5-6800 - Stock: DDR5-4800 (non-K) DDR5-5600 (K) |
| AMD Socket AM5 (X670E) | Ryzen 5 9600X, Ryzen 7 9700X, Ryzen 9 9900X, Ryzen 9 9950X, Ryzen 7 7800X3D, Ryzen 9 7900X, Ryzen 9 7900X3D, Ryzen 9 7950X3D, Ryzen 9 7900X, Ryzen 9 7900 |
| Motherboard | ASRock X670E Taichi |
| RAM | G.Skill Trident Z5 Neo DDR5-6000 - Stock: DDR5-5600 (Ryzen 9000) — DDR5-5200 (Ryzen 7000) — OC: DDR5-6000 EXPO |
| AMD Socket AM4 (X570) | Ryzen 7 5800X3D, 5700X3D |
| Motherboard | MSI MEG X570 Godlike |
| RAM | 2x 8GB Trident Z Royal DDR4-3600 - Stock: DDR4-3200 | OC/PBO: DDR4-3600 |
| All Systems | 2TB Sabrent Rocket 4 Plus, Silverstone ST1100-TI, Open Benchtable, Arctic MX-4 TIM, Windows 11 Pro |
| Gaming GPU | Asus RTX 4090 ROG Strix OC |
| Application GPU | Nvidia GeForce RTX 2080 Ti FE |
| Cooling | Corsair iCue Link H150i RGB |
| Note: | Microsoft advises gamers to disable several security features to boost gaming performance. As such, we disabled secure boot, virtualization support, and fTPM/PTT. |
- MORE: Best CPU for gaming
- MORE: CPU Benchmark Hierarchy
- MORE: Intel vs AMD
- MORE: How to Overclock a CPU
Get Tom's Hardware's best news and in-depth reviews, straight to your inbox.
Current page: AMD Ryzen 9 9950X Power Consumption, Overclocking, Test Setup, Thermals
Prev Page AMD Ryzen 9 9950X Productivity Benchmarks Next Page Zen 5 at Full Power
Paul Alcorn is the Editor-in-Chief for Tom's Hardware US. He also writes news and reviews on CPUs, storage, and enterprise hardware.
-
HideOut Your story mentioned the USB 4.0 60GB/s with 3rd party chips, is that a new feature? its 40GB/s and then the newest standard of Thunderbolt is 80/80 (or 120 if you change one of the channels to make it asymetrical). There is no such thing as 60Reply
And pretty much like every other enthusiest on here, I think th is is the most disapointing AMD launch...ever -
Paul Alcorn Reply
Good eye. Typo, fixed!HideOut said:Your story mentioned the USB 4.0 60GB/s with 3rd party chips, is that a new feature? its 40GB/s and then the newest standard of Thunderbolt is 80/80 (or 120 if you change one of the channels to make it asymetrical). There is no such thing as 60
And pretty much like every other enthusiest on here, I think th is is the most disapointing AMD launch...ever -
btmedic04 While this isn't like 6 generations of skylake, it sure feels a bit like it. This is why we need a competitive product from both companies in both performance and powerReply -
Gururu It gets so confusing when the performance of new products falls between products from the past generation. Just make one chip with a true generational difference and charge $600.Reply -
NinoPino Very disappointing the single thread and gaming results. Anyway I find suspicious results on some benchmarks.Reply
There are regressions respect 7950X in games like "Far Cry 6" and "Hitman 3".
Regression also in Outlook score vs 7950X.
I found abnormal also the NAMD score that for the 9950X is 0.6328 days/ns while Phoronix achieved a 3.14 ns/day that is about twice the performance, for comparision the 14900k is in line with Phoronix.
I suspect there is something to analyse and refine on these benchmarks.
Agree that the driver problem with core parking feature is something unacceptable. But the need to reinstall the OS seems to me something exaggerated, must exist a better solution.
Also is historical the surpass in Adobe benchmarks.
Thanks for the review. -
redgarl There is obviously something fishy with Windows when you look at the results on Linux.Reply
"The Ryzen 9 9950X was 33% faster than the Intel Core i9 14900K performance overall and even the Ryzen 9 9900X was 18% faster than the Core i9 14900K. For those still on AM4, the Ryzen 9 9950X was delivering 1.87x the performance of the Ryzen 9 5950X processor. These are some great gains found with the Ryzen 9 9900 series."
-Phoronix
-
jeremyj_83 Anyone know if Zen 5 will allow for a mclk/uclk 1:1 with DDR5-6400 RAM or will that max out at 6000 again?Reply -
Blastomonas Whilst it maybe disappointing for some, it simply appears that AMD are continuing to separate out their gaming CPU range from their productivity range.Reply
This appears to be a very powerful and efficient chip for multi core workloads that will likely get better when some of the usual teething problems are ironed out.
Nothing groundbreaking, just a bit better.
