


Why you can trust Tom's Hardware Our expert reviewers spend hours testing and comparing products and services so you can choose the best for you. Find out more about how we test.
Intel Core Ultra 9 285K Productivity Benchmarks — The TLDR
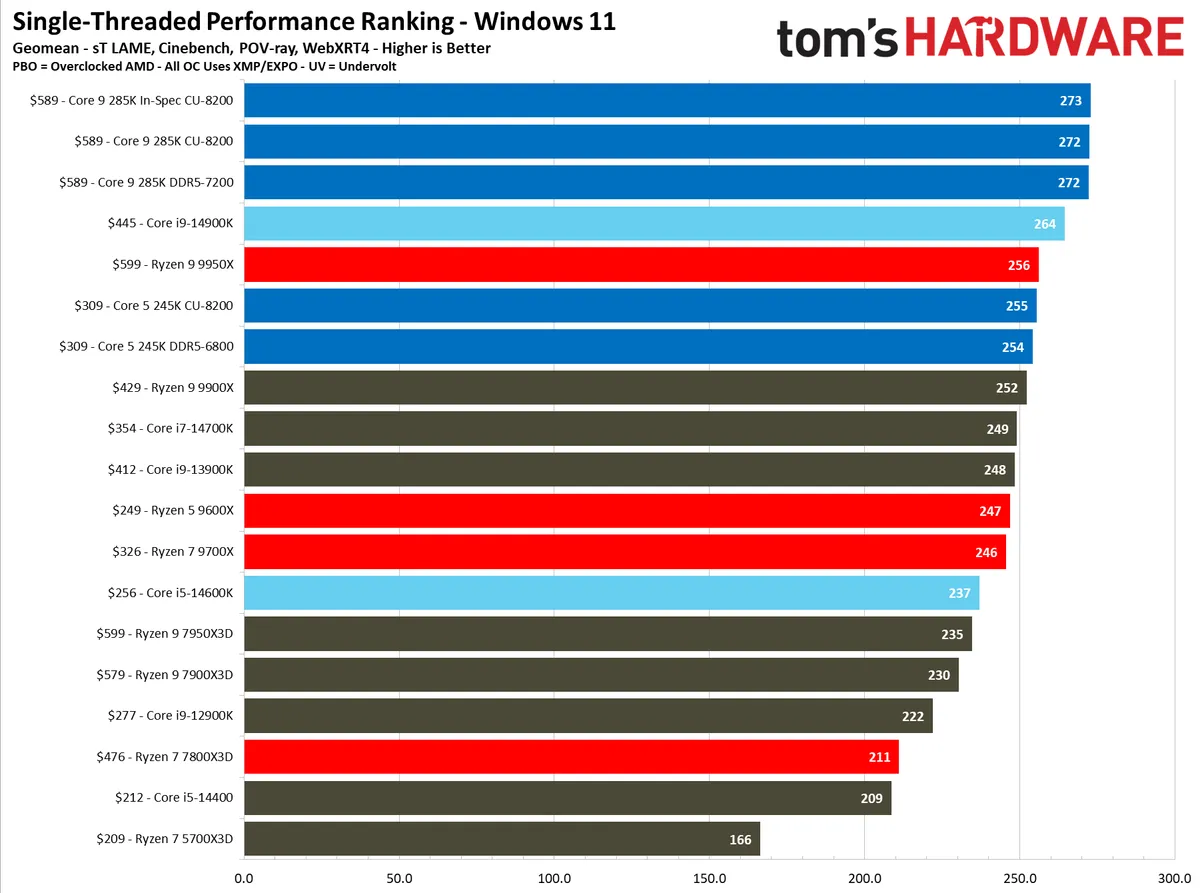
We boil down productivity application performance into two broad categories: single-threaded and multi-threaded. These slides show the geometric mean of performance in several of our most important tests in each of these categories, but be sure to look at the expanded results below for more granular analysis.
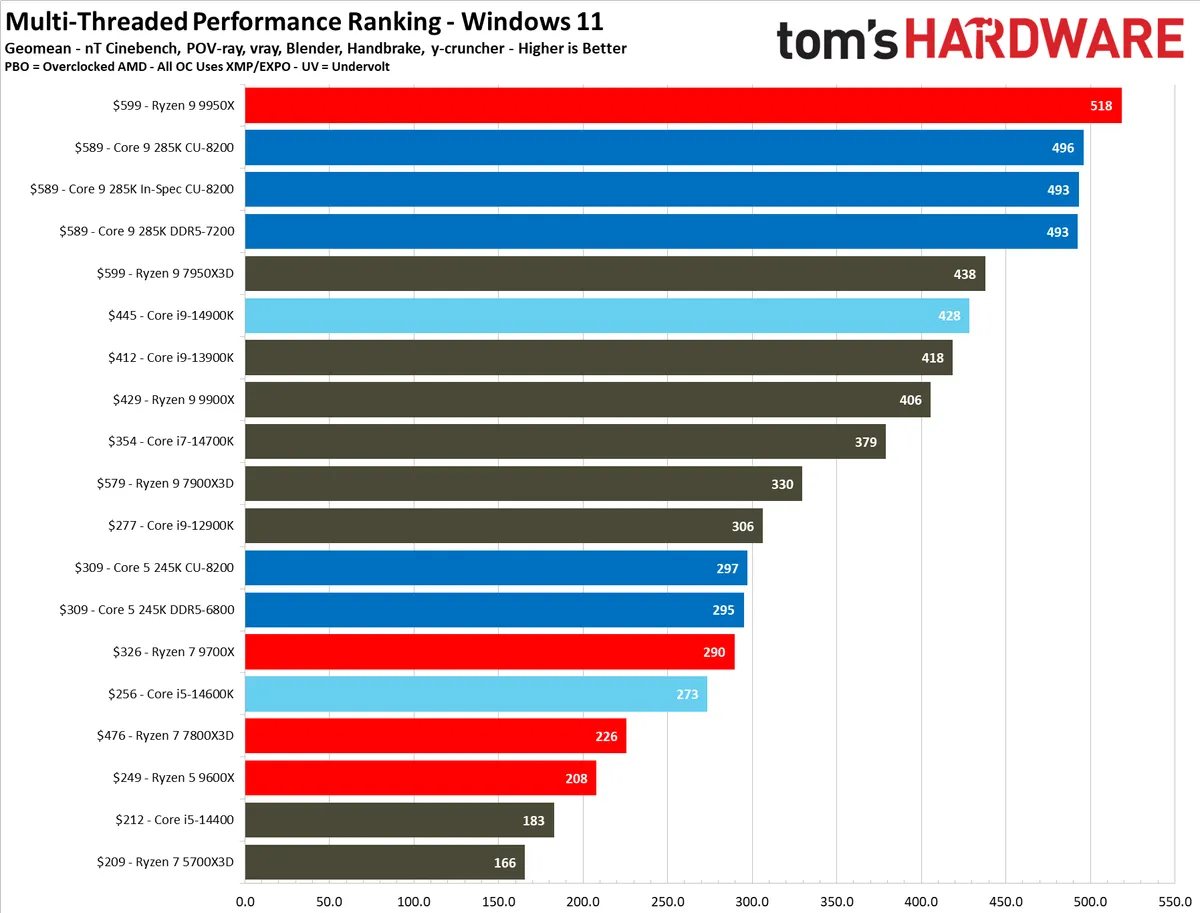


Intel claimed a 20% generational performance improvement in threaded workloads over its 14th Gen CPUs, and we measured a 15% test in the selection of workloads used for our ranking. However, we did see even larger gains in some distinct workloads, which you can see below. Despite Intel's impressive gains, the Ryzen 9 9950X remains 4% faster overall in threaded work, with much of that advantage stemming from its support for native AVX-512 that boosts performance in several of the workloads we use for measurements. As you can see below, both chips have their respective strengths and weaknesses.
The 285K made a small advance in single-threaded performance, outpacing the 14900K by 3%. That's good enough to stay at the top of the leaderboard, and also 6% faster than the Ryzen 9 9950X.
We tested with the 'Extreme" profile with unlocked power values for our standard configurations (more explanation in the power section). However, this profile resulted in much higher power draw. As such, we also tested performance with the more power-constrained and warrantied "performance" profile, which we've marked as "In-Spec" in the above chart. As you can see, the 'In-Spec" profile resulted in little to no performance loss in almost all workloads, but it consumed much less power (as you can see on the following page). To keep the charts as clean as possible, we excluded the "In-Spec" entry from the other benchmarks, as there is almost no difference in performance and it becomes a redundant entry.
You'll notice that the Ryzen 5 5700X3D, which delivers absolutely phenomenal performance for its price point in gaming, suffers tremendously in the application benchmarks due to its aging Zen 3 architecture. We also see the same trend with the Ryzen 7 7800X3D, the current fastest gaming chip in the world, so remember to proceed with caution when selecting these chips over more well-rounded competitors. They truly are specialist chips for gaming.
Rendering Benchmarks — Intel Core Ultra 9 285K


Intel has made strong gains with Arrow Lake, as we can see throughout this series of benchmarks. The increased throughput from the CUDIMMs doesn't often make a big impact, so unless there's a pricing benefit or future firmware updates that change the situation, regular DDR5 DIMMS seem just fine.
We see some remarkable gains in threaded workloads for the 285K, with performance in Cinebench 2024, POV-Ray, C-Ray, and Luxmark all taking giant strides forward. However, the AMD Ryzen 9 9950X remains strong in several tasks, like Embree, V-Ray 6, Blender, and Corona.
Encoding Benchmarks — Intel Core Ultra 9 285K


Most encoders tend to be either heavily threaded or almost exclusively single-threaded — and it takes an agile chip to master both disciplines. Handbrake, SVT-HEVC, and SVT-AV1 serve as our threaded encoders, while LAME and FLAC are indicative of how the chips handle lightly-threaded engines.
The 285K takes top honors in the Handbrake x264 encoding test, and only comes in just a bit behind the 9950X in the x265 and SVT_AV1 results. 285K also leads in the FLAC, libavif, and SVT-HEVC disciplines, while Raptor Lake still shows some skill in the LAME MP3 testing.
Adobe Photoshop, Premiere Pro, DaVinci Resolve — Intel Core Ultra 9 285K


We've brought back the Puget Systems benchmark to our test suite. We previously used this benchmark in its beta form, but its final release is now available as the PugetBench for Creators suite. We used the benchmark for Photoshop, Premiere Pro, and DaVinci workloads.
Arrow Lake and the 285K fail to take the top spot in any of the tests, though it comes close in the Premiere Pro LongGOP and Lightroom batch processing tests. Everywhere else, it offers decidedly middling performance, falling behind both Zen 5 Ryzen 9000 and Raptor Lake 14th Gen CPUs in many of the tests.
Web Browser, Office Benchmarks — Intel Core Ultra 9 285K


There's not much more to add here. As seen elsewhere, performance from Intel Arrow Lake offers mixed results. The 285K lands at or near the top in a few instances, but is just as likely to fall off the pace. Perhaps not too surprisingly, the WebXPRT WebAI result is one of the strong points, though it's not clear if that particular test makes use of the NPU.
Compilation, Compression, AVX, Chess Engines, Others — Intel Core Ultra 9 285K


This selection of tests runs the gamut from massively parallel molecular dynamics simulation code in NAMD to compression/decompression performance.
Y-cruncher computes Pi with the AVX instruction set, making for an exceedingly demanding benchmark. This benchmark was recently updated with specific tuning for AMD's AVX-512 implementation. The new code delivers a big boost to Ryzen. Intel's new chips make big strides in this benchmark over the prior generation, but they only support AVX-256 natively, ultimately giving AMD an easy win.
Intel has historically performed well in compilation tasks, and here we can see the 285K taking back the leadership spot in the LLVM benchmark, albeit by a slim margin. The NAMD simulation code benchmark finds the 285K making a much more definitive claim for leadership with an easy win over all competing chips.
Geekbench 6, Geekbench AI — Intel Core Ultra 9 285K


The GeekBench AI results in the slide deck above show performance with the workload running on the CPU cores via OpenVino and ONNX. Only two CPUs in this group have in-built NPUs — the Core Ultra 9 285K and Ultra 5 245K — making them the only processors capable of running the workload on a dedicated NPU. Given that the NPU is focused on low-power inference tasks, the results are impressive relative to the performance when the workload executes on the CPU cores.
Tom's Hardware |
FP32 |
FP16 |
Quantized (typ. INT8) |
Core Ultra 9 285K NPU - ONNX |
5038 |
2119 |
7056 |
SPECworkstation 3.1 — Intel Core Ultra 9 285K


The SPECworkstation 3 benchmark suite is designed to measure workstation performance in professional applications. The full suite consists of more than 30 applications split among seven categories, but we've narrowed the list to tests that largely focus on CPU performance. We haven't submitted these benchmarks to the SPEC organization, so be aware that these are not official benchmarks.
