Rosewill Capstone-G1200 PSU Review
Why you can trust Tom's Hardware
Cross-Load Tests And Infrared Images
Our cross-load tests are described in detail here.
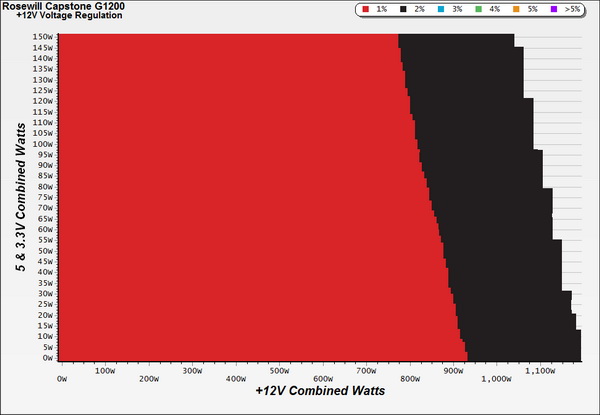
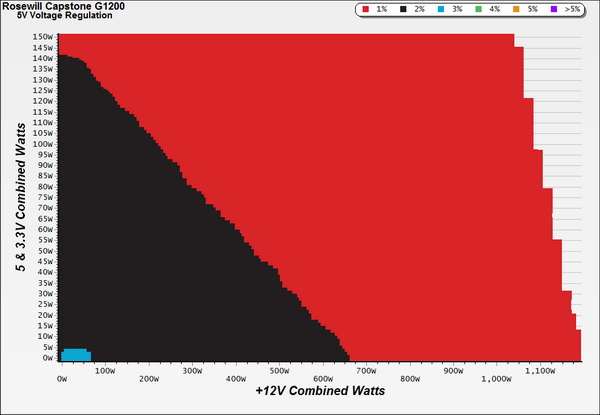
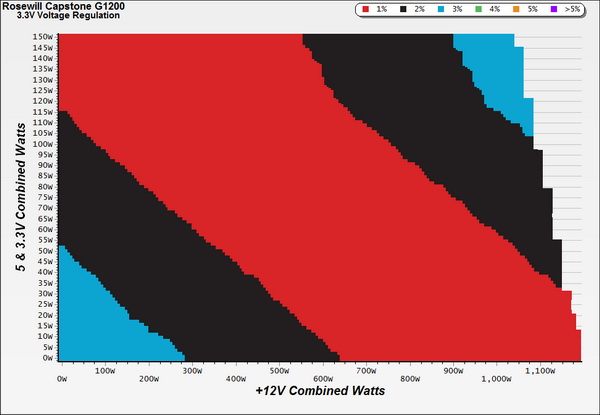
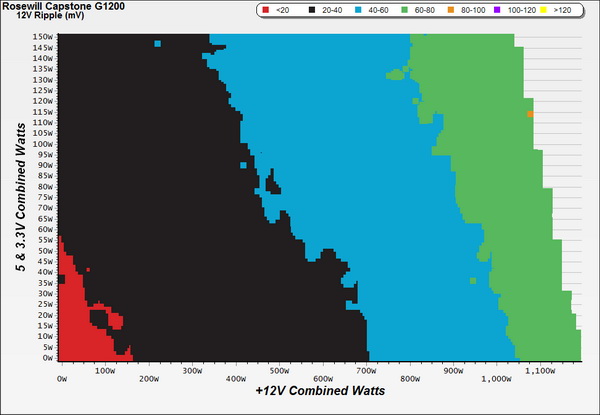
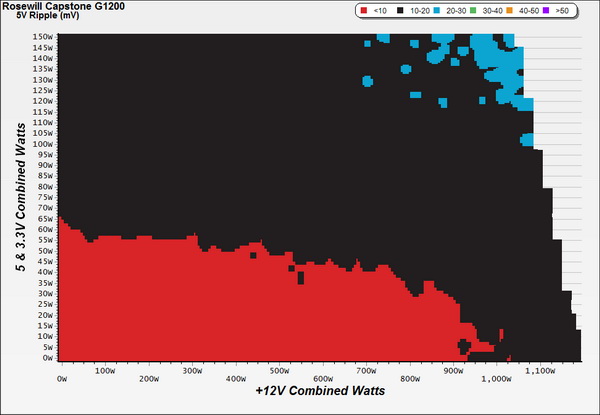
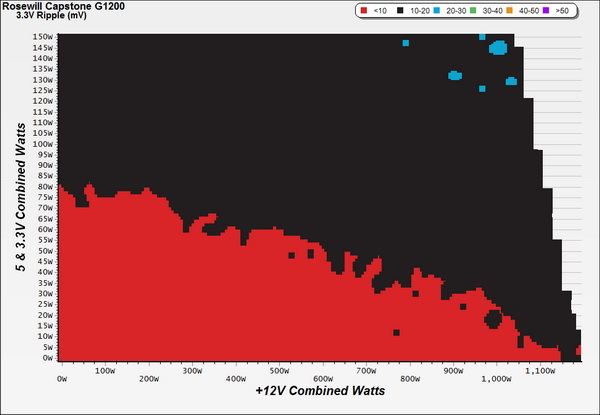
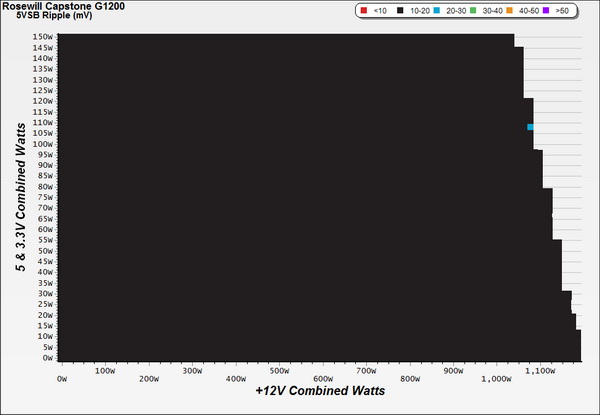
To generate the following charts, we set our loaders to auto mode through our custom-made software before trying more than 1500 possible load combinations with the +12V, 5V and 3.3V rails. The load regulation deviations in each of the charts below were calculated by taking the nominal values of the rails (12V, 5V and 3.3V) as point zero.
Load Regulation Charts
Efficiency Chart
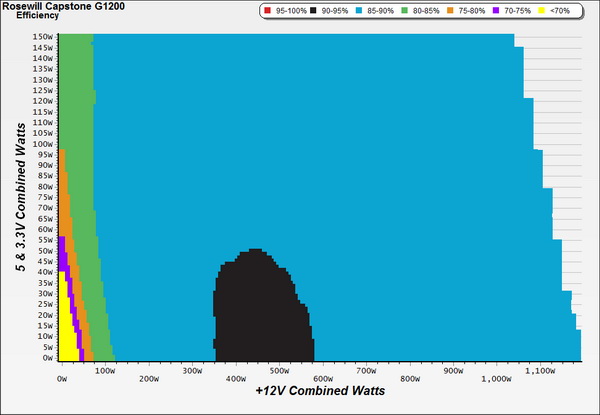
The Capstone-G1200 delivers greater-than 90 percent efficiency in a small part of its operational range. Efficiency mostly falls between 85 and 90 percent. This isn't bad until you start drawing comparisons between other Gold-rated PSUs with similar capacity, which typically deliver even better efficiency.
Ripple Charts
Infrared Images
Toward the end of the cross-load tests, we took some photos of the PSU with our modified FLIR E4 camera that delivers 320x240 IR resolution (76,800 pixels).
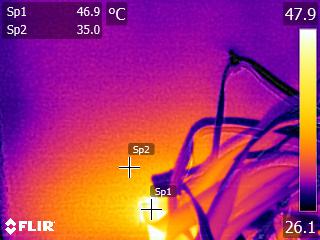
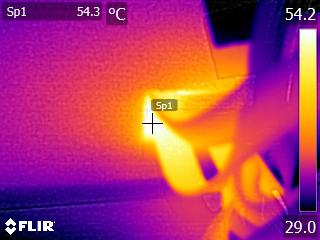
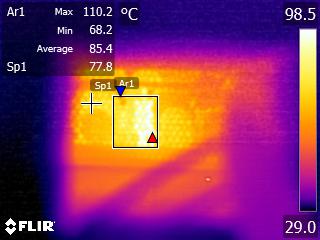
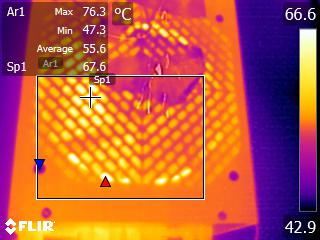
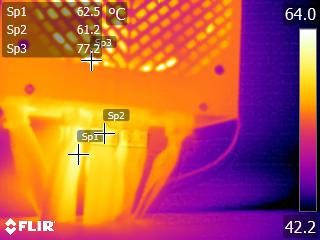
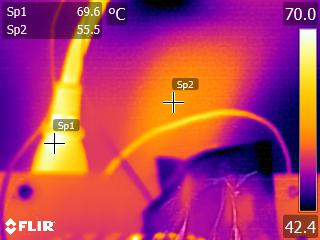
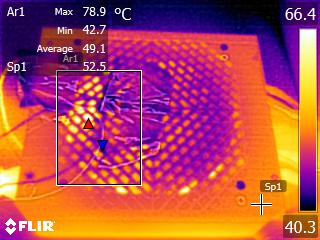
The temperature inside of our hot box easily rises to high levels due the G1200's waste heat. Inside the power supply, its bridge rectifiers approached their limit after being subjected to a 110 °C operating temperature. However, keep in mind that we pushed the PSU hard with an ambient temperature in excess of Rosewill's specifications.
Despite the elevated temperatures inside, the PSU worked flawlessly, and we didn't encounter any unexpected shut-downs from over-temperature protection. This means that the OTP trigger point is set higher than the levels we saw (strange, given the PSU's 40 °C rating).
Get Tom's Hardware's best news and in-depth reviews, straight to your inbox.
Current page: Cross-Load Tests And Infrared Images
Prev Page Efficiency, Temperature And Noise Next Page Transient Response Tests
Aris Mpitziopoulos is a contributing editor at Tom's Hardware, covering PSUs.
-
Giannis Karagiannis Quite low price for a 1200W unit but considering everything else I dont think its a good buy. Try better next time Rosewill...Reply -
Dark Lord of Tech Rosewill does have some Capstones that are great quality , The Super Flower models.Reply -
Dark Lord of Tech Also Enhance released a lot of nice V and VS series models for Cooler Master.Reply -
Aris_Mp Those older Capstones are EOL because they were older platforms which most likely aren't produced any more and on top of that Super Flower lately cannot meet demand, as the rumors say.Reply -
Dark Lord of Tech Super Flower is still pushing out a lot of units , I own 5 of he EVGA Super Flowers.Reply
The olser Capstones are solid , they are EOL , but were very good. -
DSzymborski Really disappointing to see Rosewill slide back - those older Capstones made by Super Flower were really quite nice and you could frequently get excellent deals on them and I made a couple of builds for people with the semi-modular gold 750s. Too bad.Reply -
MasterMace It's too bad, the previous Capstones were so nice. This makes me wonder if they should have slapped a lower rating on this unit, instead of overshooting for a Gold 1200Reply -
firefoxx04 I wish manufacturers didn't bother making crap power supplies for enthusiasts markets. The fact that they even sell is a huge problem.Reply -
Slobodan-888 LOL, ripple is fine. It is within ATX specifications which states that is is allowed up to 120 mVpp RMS on 12 V rail.Reply
