Cooler Master V750 PSU Review
Cooler Master recently updated its lower-capacity V series, and today we take a look at the V750. This unit features 80 PLUS Gold efficiency, fully modular cabling and very small dimensions, which put it up against the SilverStone ST75F-GS V2.
Why you can trust Tom's Hardware
Cross-Load Tests And Infrared Images
Our cross-load tests are described in detail here.
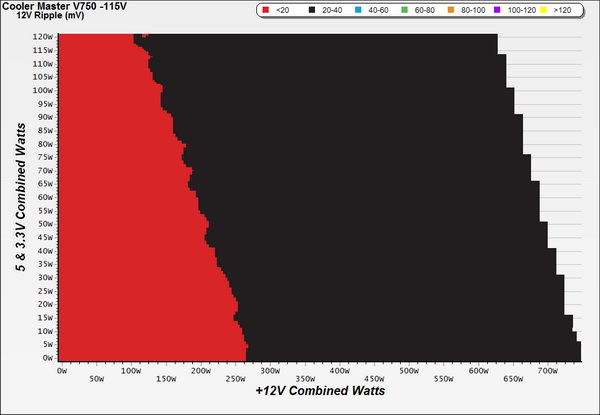
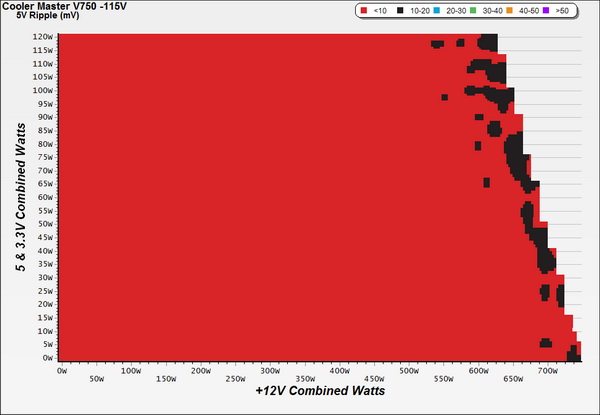
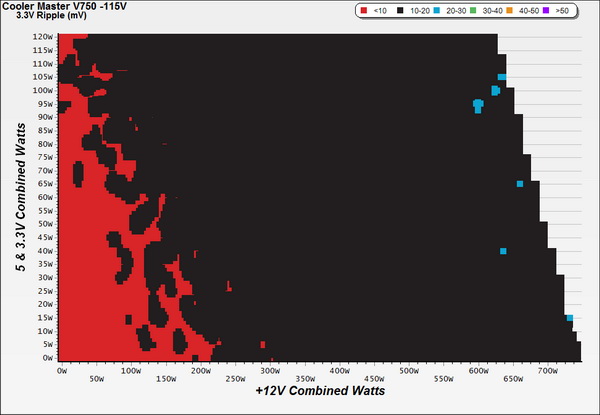
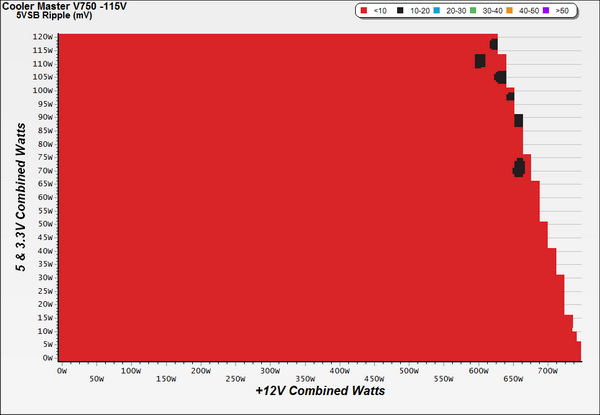
To generate the following charts, we set our loaders to auto mode through our custom-made software before trying more than 1500 possible combinations with the +12V, 5V and 3.3V rails. The load regulation deviations in each of the charts below were calculated by taking the nominal values of the rails (12V, 5V and 3.3V) as point zero.
Load Regulation Charts
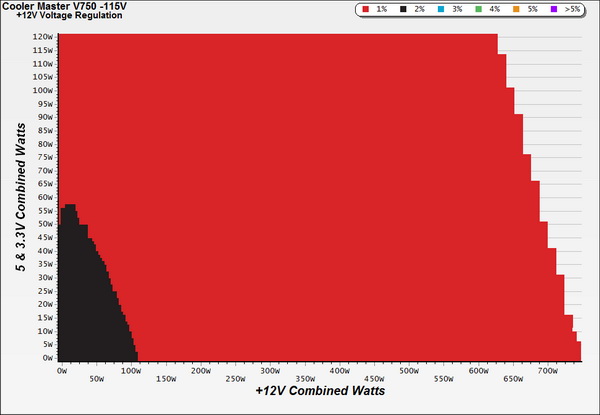
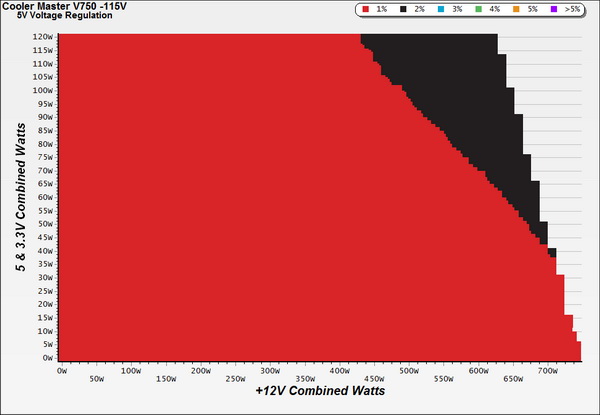
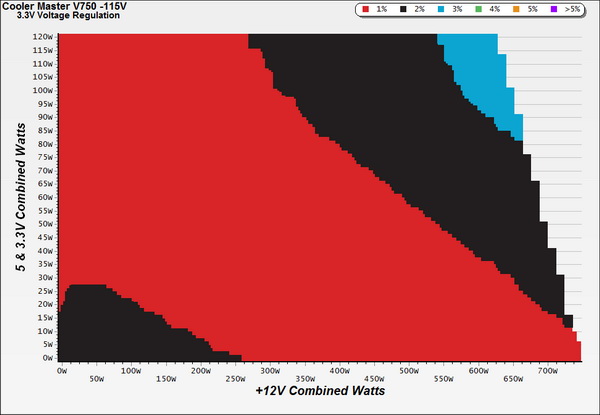
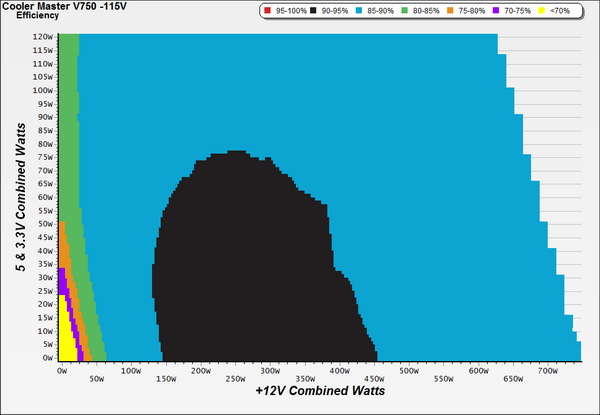
Efficiency Chart
For a significant part of its operational range, the PSU delivers 90 to 95 percent efficiency, and for the most part it achieves 85 to 90 percent efficiency. In general, this is a good Gold-rated platform that will save you some money on your electricity bills.
Ripple Charts
Infrared Images
Toward the end of the cross-load tests, we took some photos of the PSU with our modified FLIR E4 camera that delivers 320x240 IR resolution (76,800 pixels).
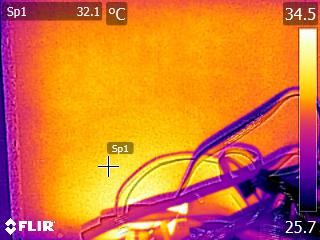
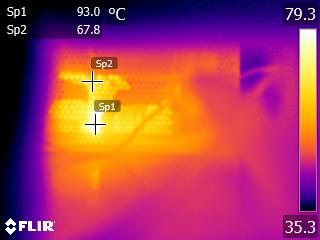
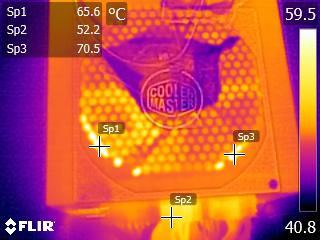
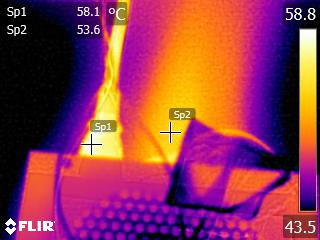
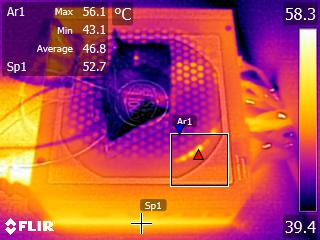
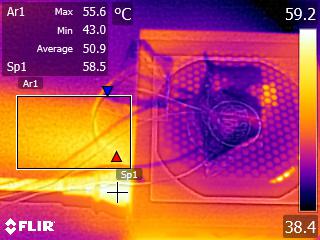
As usual, we stressed the PSU with higher than 45 °C ambient temperatures. Thermals inside the supply were high, but they weren't dangerous to the components. The small fan managed to handle the high heat load, though it made a lot of noise in the process.
Get Tom's Hardware's best news and in-depth reviews, straight to your inbox.
Current page: Cross-Load Tests And Infrared Images
Prev Page Efficiency, Temperature And Noise Next Page Transient Response Tests
Aris Mpitziopoulos is a contributing editor at Tom's Hardware, covering PSUs.
-
Nuckles_56 I couldn't see it mentioned, but could any of the other cables be plugged in where they shouldn't be?Reply -
Giannis Karagiannis But then again with a wire cutter and a little bit of insulating tape everything is possible... :PReply -
Gam3r01 I think TH reviews should take a bit from Jonnyguru or similar and include a point scale at the end. Sure listing the pros and cons with a verdict is enough in most cases, but its up to the reader to decide just how good or bad a unit may be.Reply -
Aris_Mp I agree with you on this, however on page #9 among others you will find a performance graph which can easily play the same role. On top of that it offers comparison data including relevant offerings so a reader can easily figure how the product fares against the competition.Reply -
Gam3r01 While that is included, it dosent give an overall final score. Saying the RMx scored 9% higher is alot different to readers than saying the RMx got a 9.8/10 for ecample.Reply -
SamSerious Point Scales are horrible and i am glad that TH is one of the few remaining sites not to do so. There are already enoguh websites and magazines for people who prefer points, and stars over content.Reply
