HP S700 SSD Review
Why you can trust Tom's Hardware
256GB SSD Performance
Comparison Products
There are some strange truths about DRAMless SSDs that go against what we've learned about SSDs over the last decade. The S700’s specification sheet doesn't show performance data with a significant amount of data on the drives. On paper, the smaller drives still have the lowest performance specifications. That is in line with other SSDs and conventional wisdom.
We also know that all SSDs, even those with a DRAM buffer, slow as you add data to the flash. That's because the cells are dirty, but also because the address map table is smaller when the drive is populated with less data. As you fill the drive, DRAMless SSDs lose performance at an accelerated rate compared to products with a DRAM buffer.
The $130 HP S700 retails for nearly the same as the Samsung 960 EVO 250GB NVMe SSD. That's a bad position to be in, but it gets worse; Newegg lists similar DRAMless 256GB-class SSDs at just $79. The Samsung 850 EVO 250GB sells for just $100 at Newegg (at the time of writing). The S700 even steps into Corsair Neutron XTi 240GB ($109.99) and 850 Pro ($137.99) territory.
We added the Corsair Force LE 200 240GB, a DRAMless competitor, to the comparison products. It uses the Phison S11 controller. We also included the Mushkin Triactor again along with the Samsung 850 EVO. The SanDisk Ultra II also makes an appearance.
Sequential Read Performance
To read about our storage tests in-depth, please check out How We Test HDDs And SSDs. We cover four-corner testing on page six of our How We Test guide.
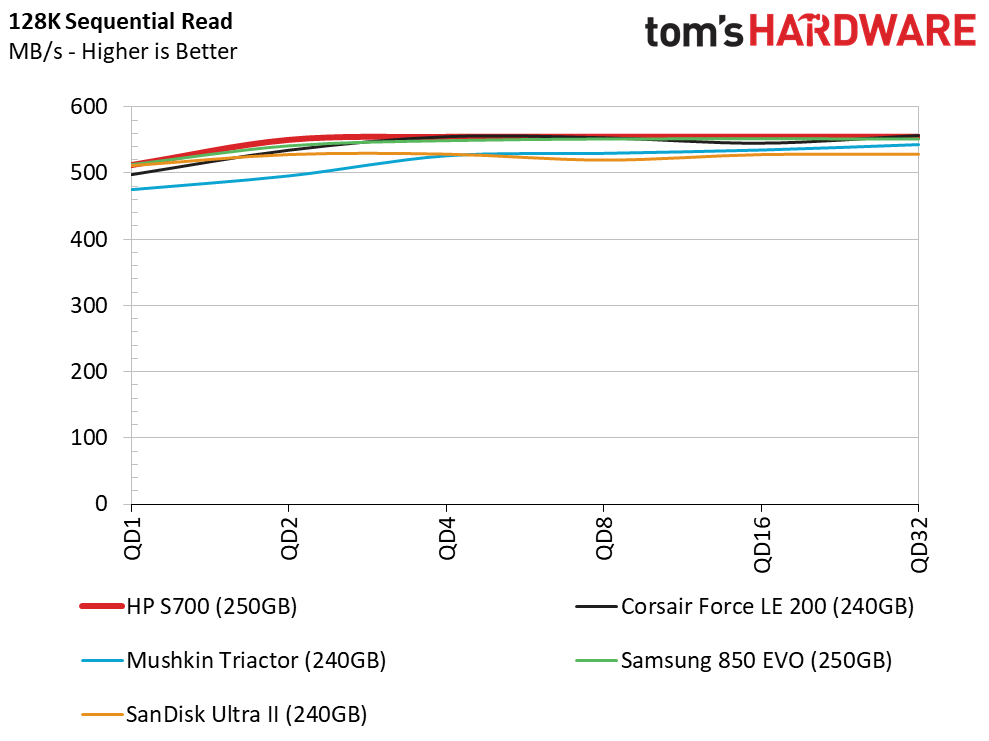
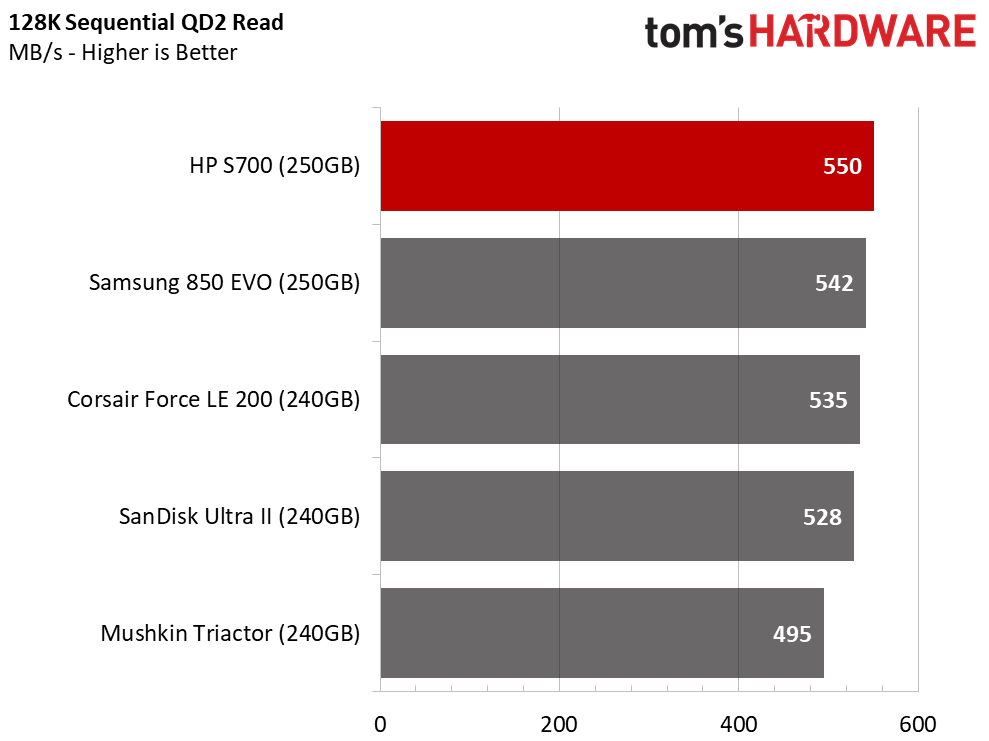
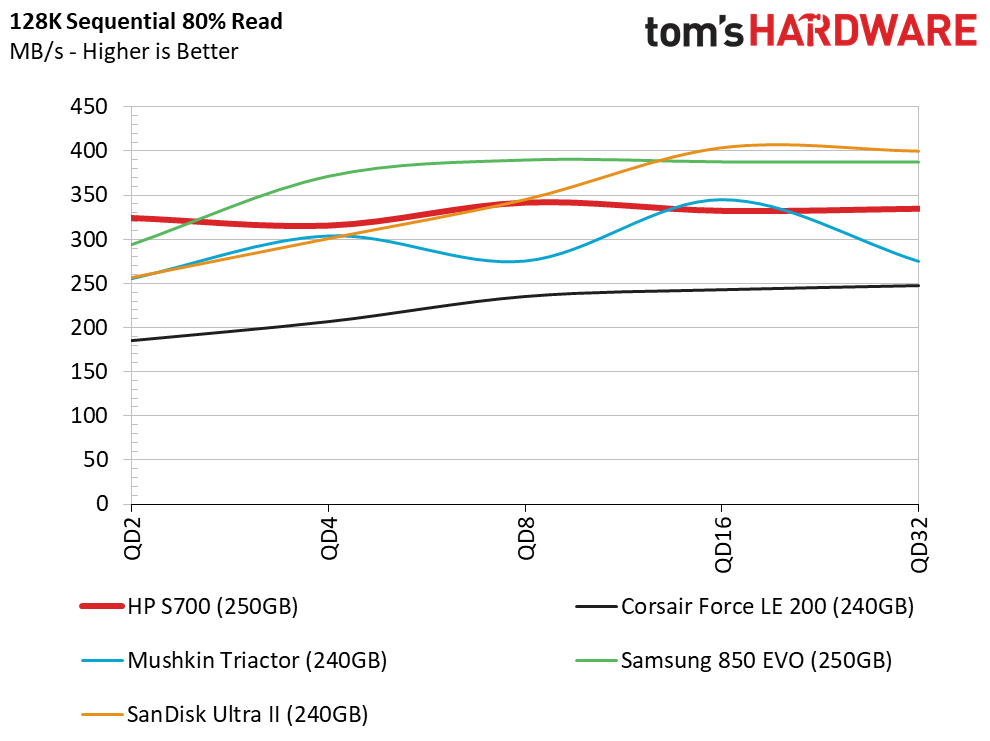
Again, the S700 takes the top spot in the sequential read test. This controller and NAND combination is almost unbeatable during a sequential read workload. If the S700’s price was more competitive, this could be a very good SSD for storing games on a secondary drive.
Sequential Write Performance
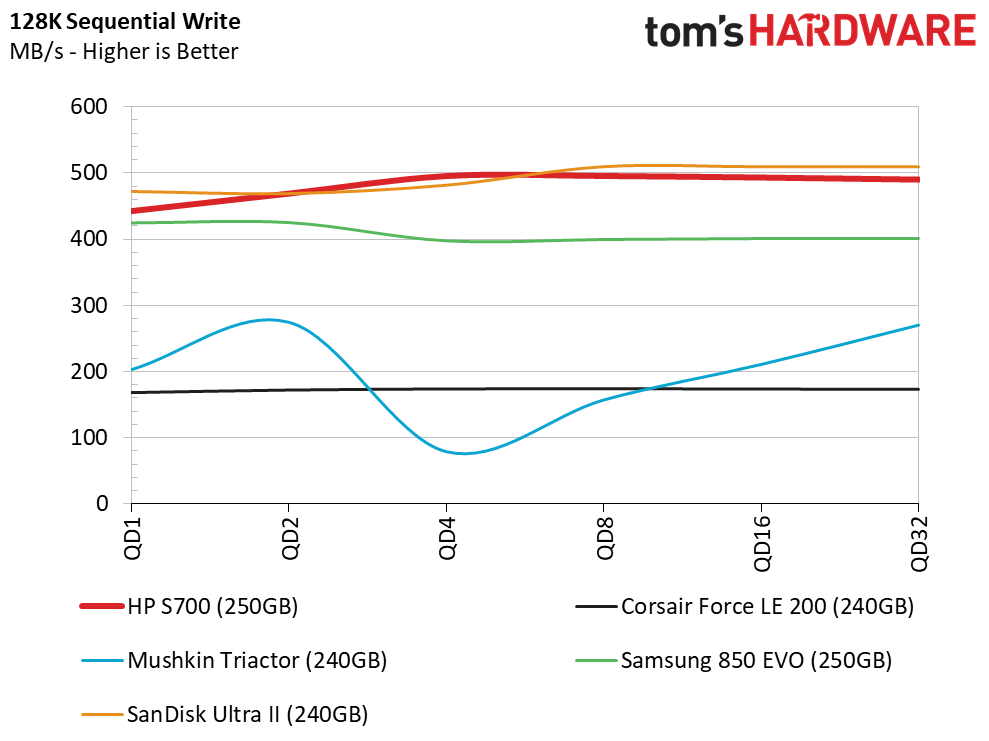
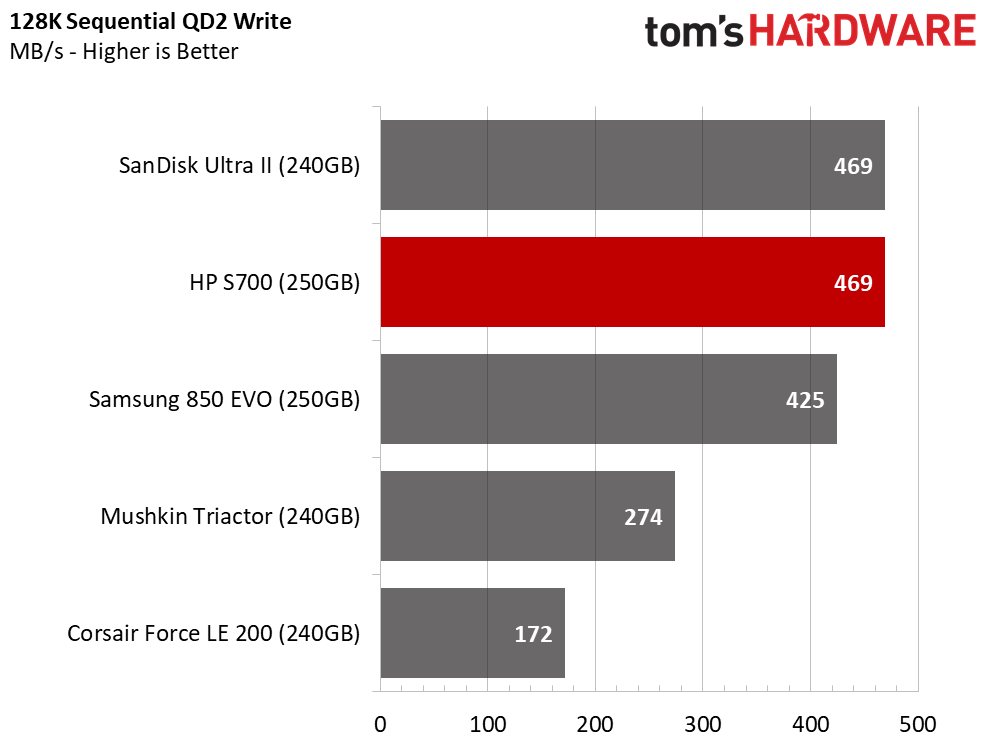
The S700 also performs well in the sequential write test. The DRAMless Force LE 200 240GB has very low sequential write performance at QD2.
Get Tom's Hardware's best news and in-depth reviews, straight to your inbox.
Random Read Performance
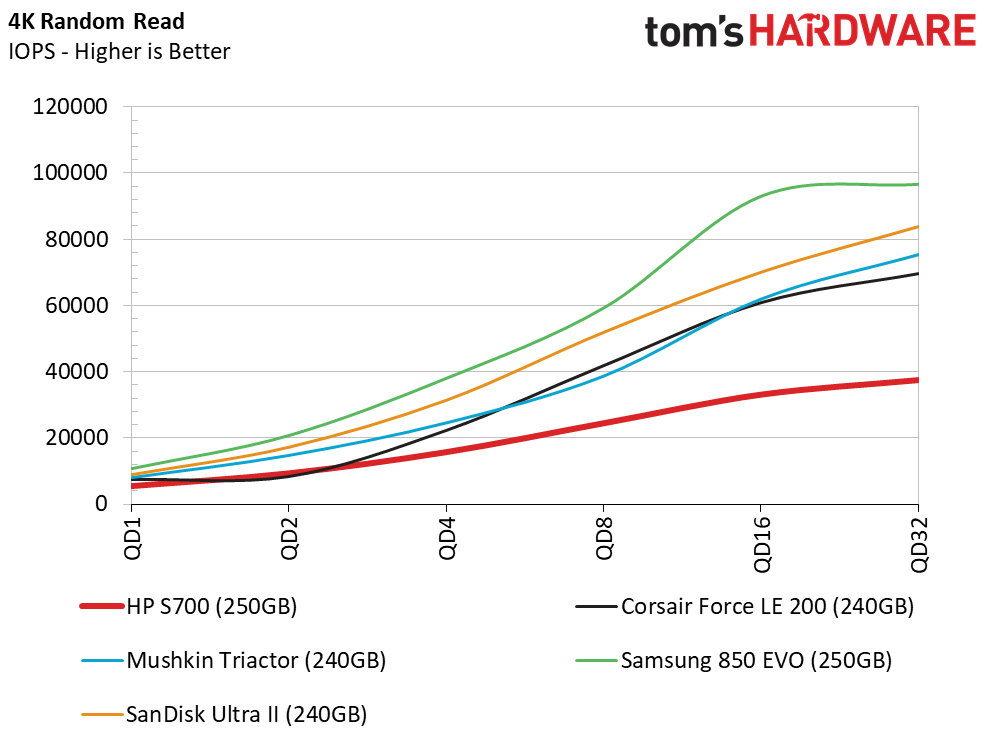
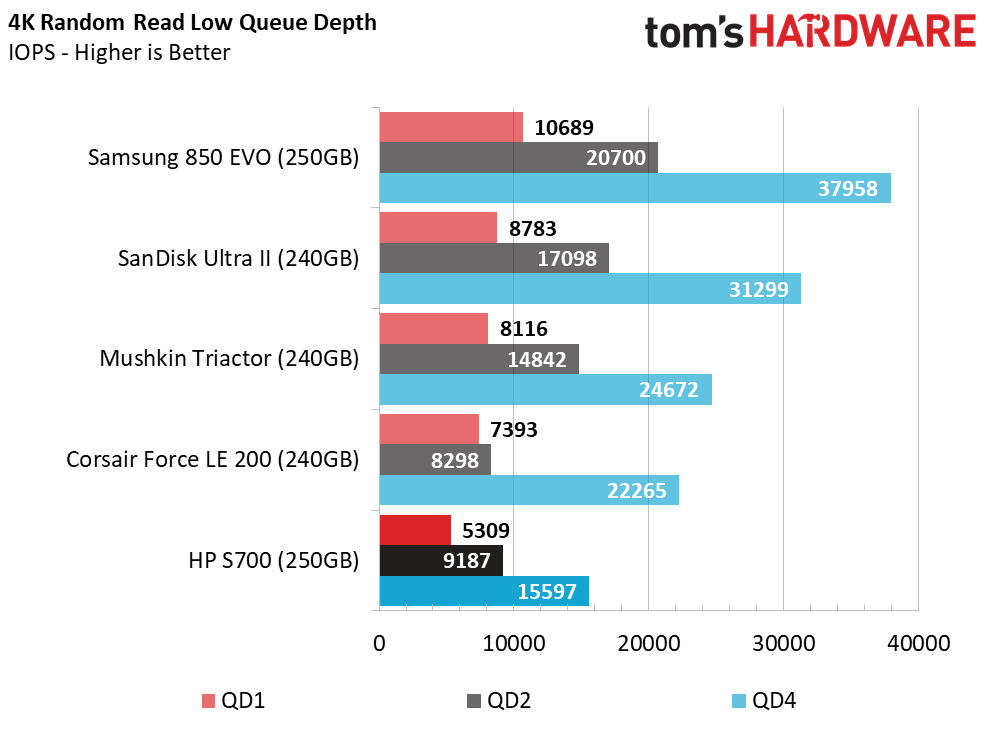
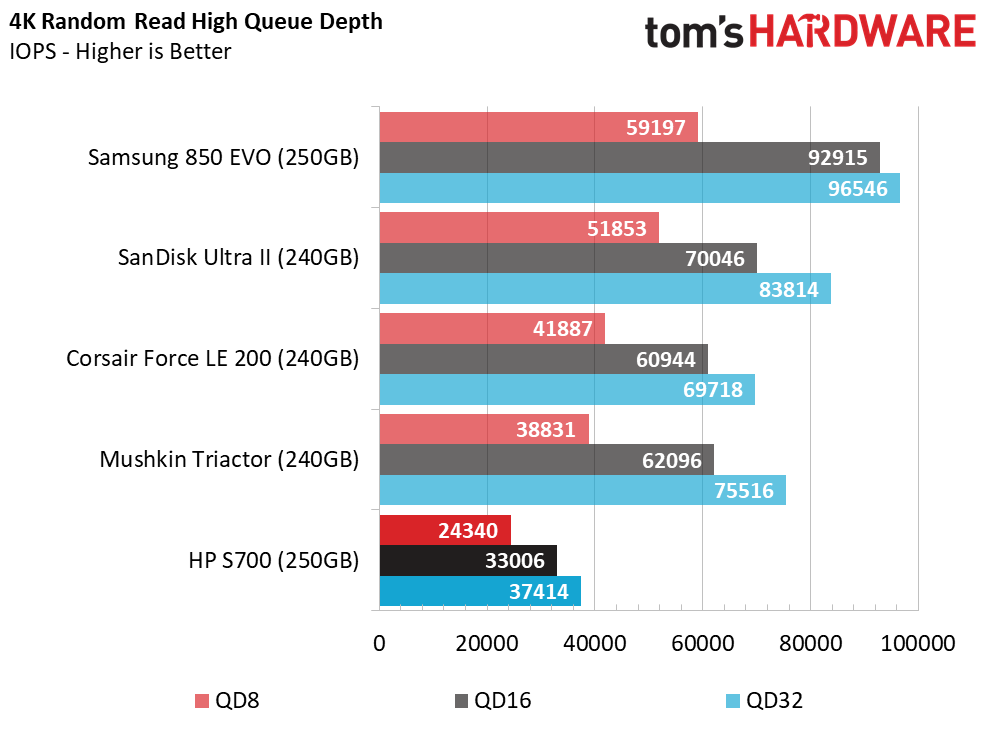
Random read performance is still the weak point for the S700, and that doesn't change with the smaller capacity. Random reads are directly related to system responsiveness when you load applications.
Random Write Performance
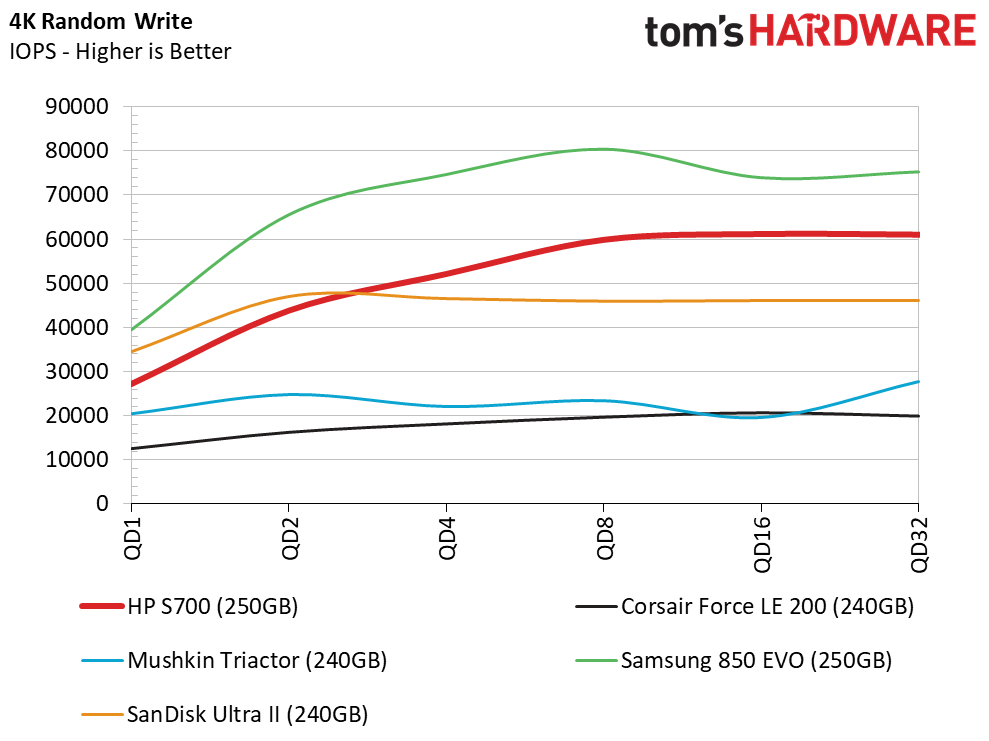
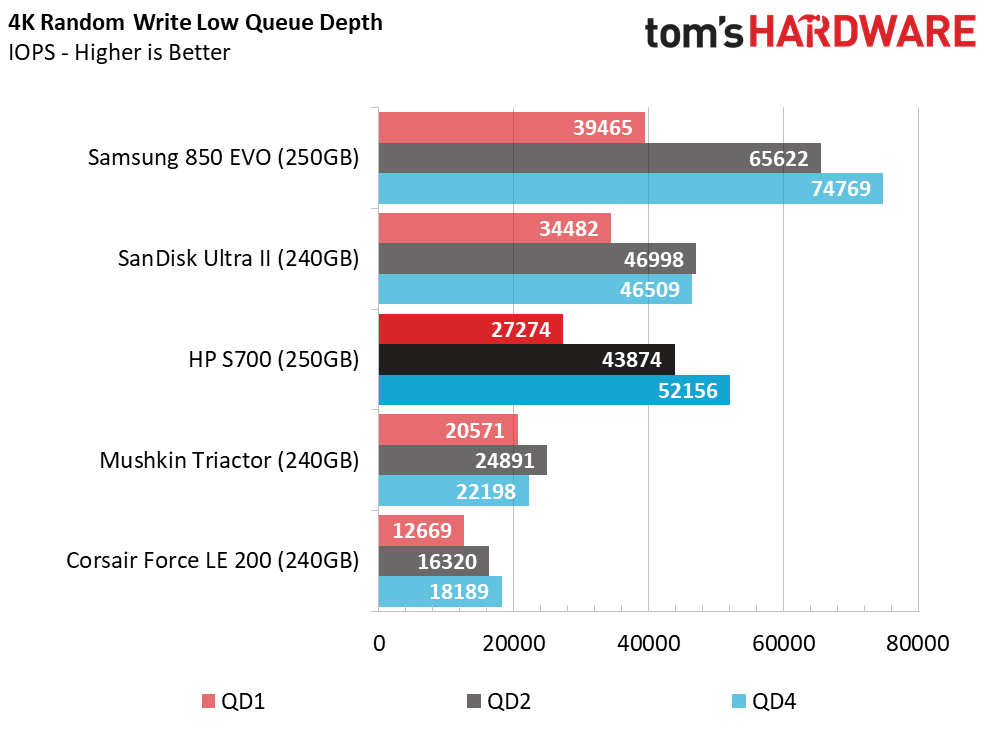
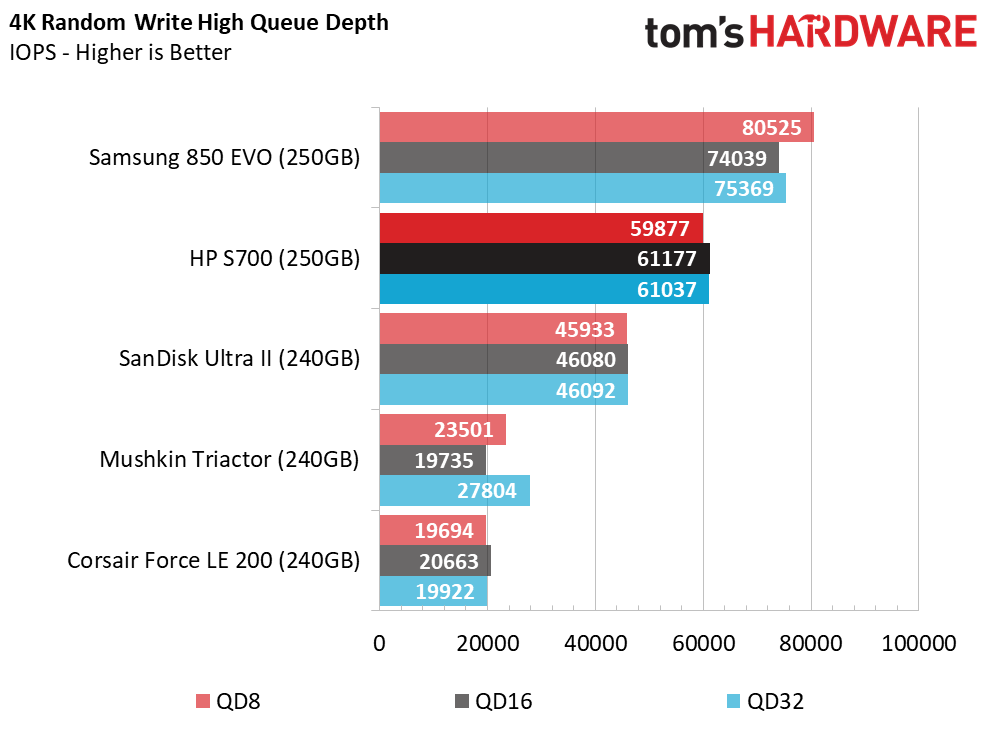
The S700 250GB delivers better random write performance than what you might expect from an entry-level DRAMless SSD. It outperforms both the Mushkin Triactor and Corsair Force LE 200.
80 Percent Mixed Sequential Workload
We describe our mixed workload testing in detail here and describe our steady state tests here.
Again, we see very little scaling from the DRAMless SSDs as we increase workload intensity. The S700 250GB is still competitive in this test compared to the other popular models.
80 Percent Mixed Random Workload
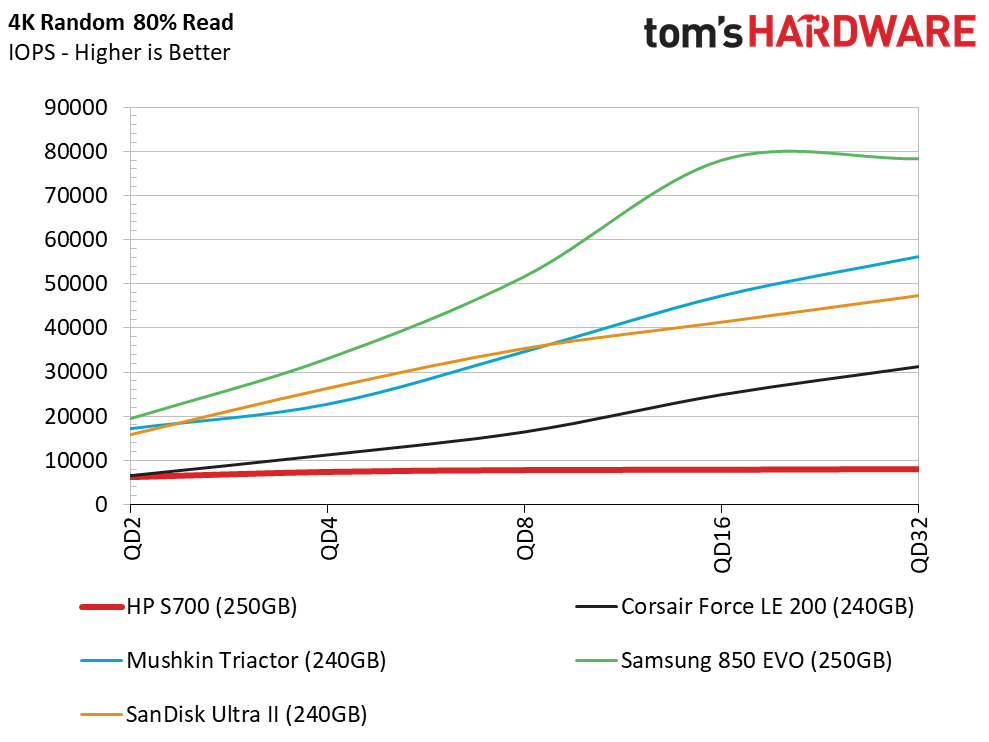
We can't say the same with mixed random performance. The S700 falls flat with roughly 9,000 IOPS. Performance doesn't increase with workload intensity. Instead, it goes down slightly.
Sequential Steady-State
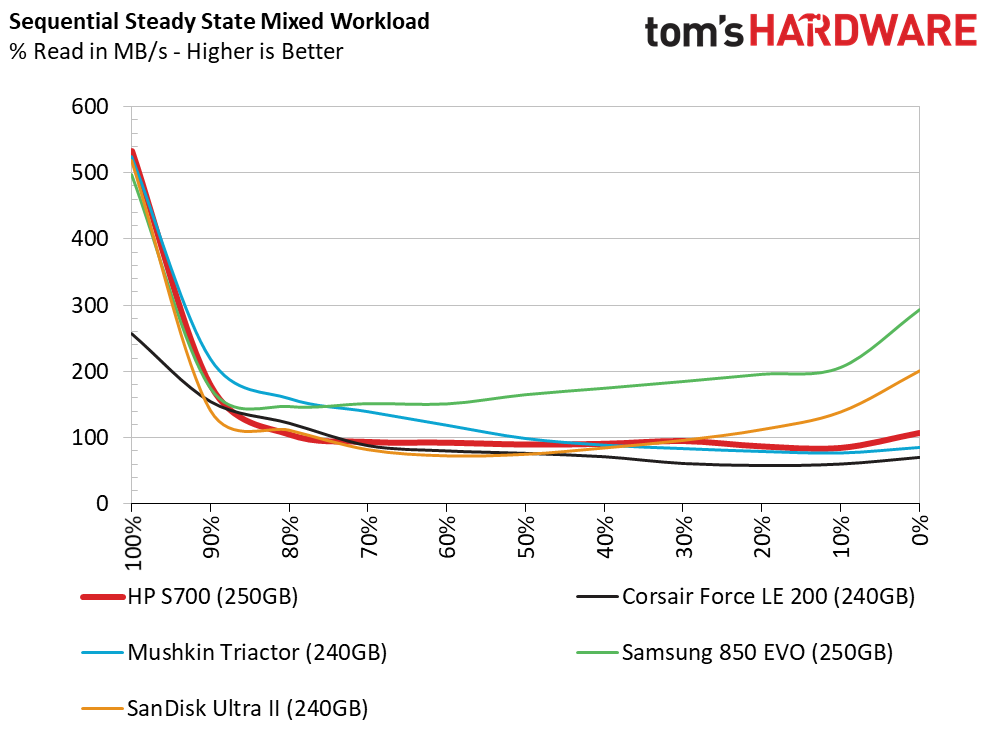
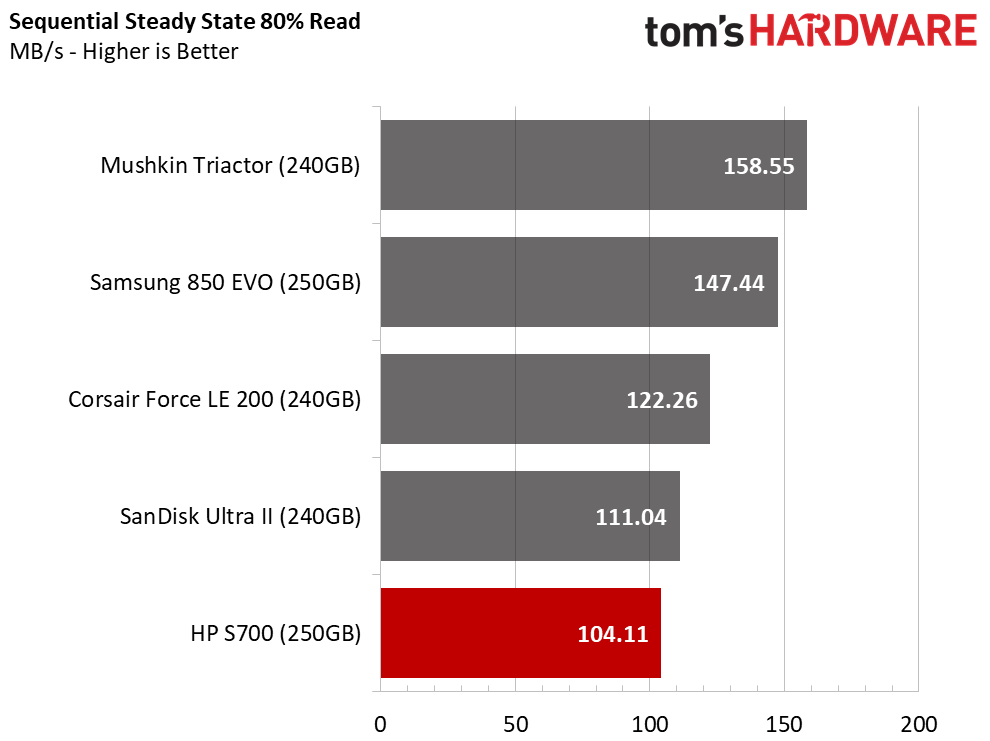
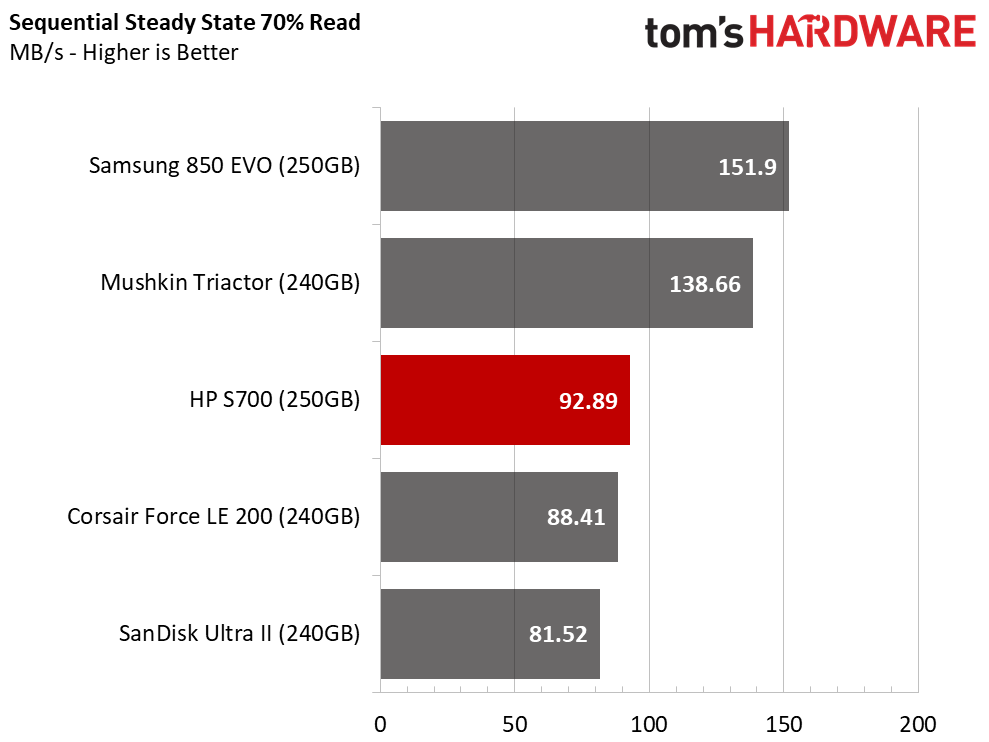
The S700's sequential-steady state performance is similar to what we see from most TLC-based drives. There is very little improvement during the heavy write portion of the test (right side of the chart). There is also a large drop off from 100% reads and 90% reads.
Random Steady-State
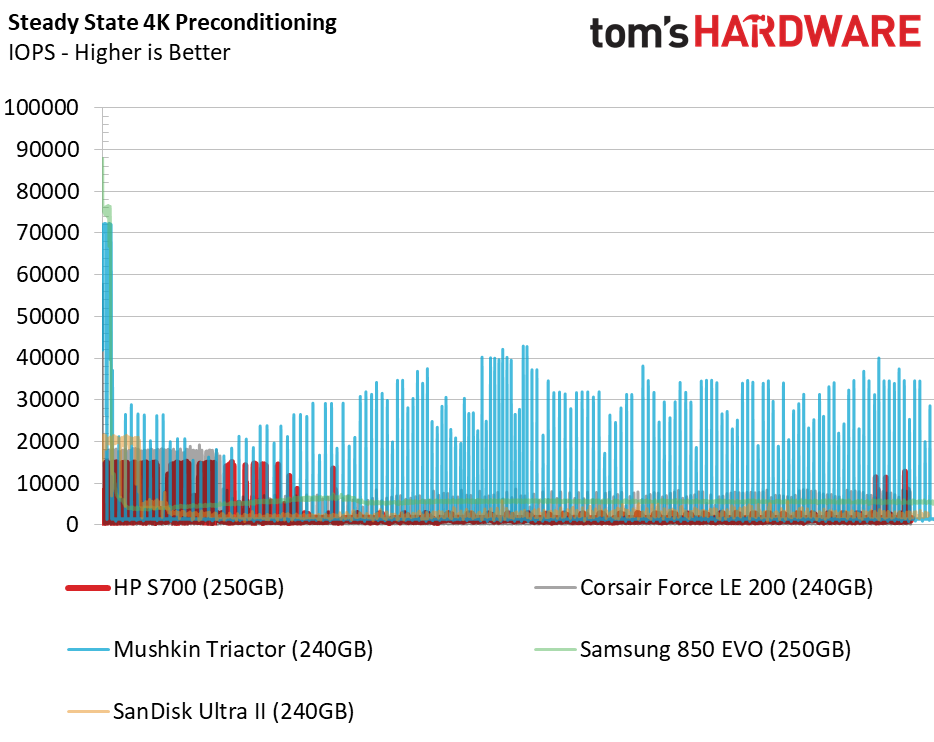
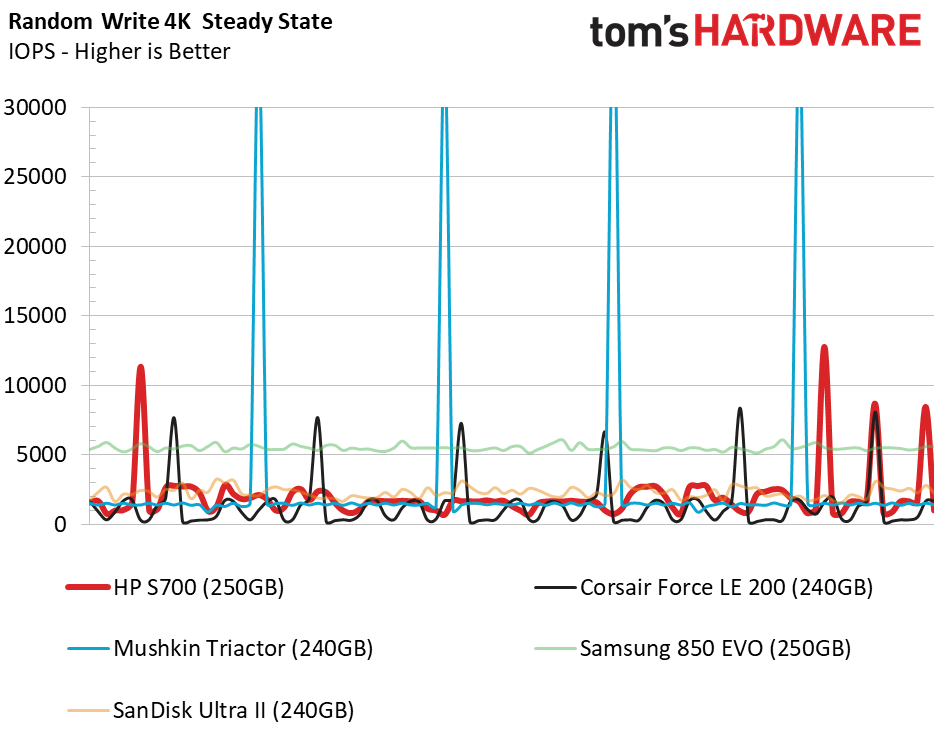
All the TLC-based drives provide low performance in a steady state. The Samsung 850 EVO 250GB still musters a little over 5,000 IOPS and shows why it's the fastest TLC SATA SSD on the market.
The HP S700 250GB actually delivers more IOPS than the larger 500GB model in this workload.
PCMark 8 Real-World Software Performance
For details on our real-world software performance testing, please click here.
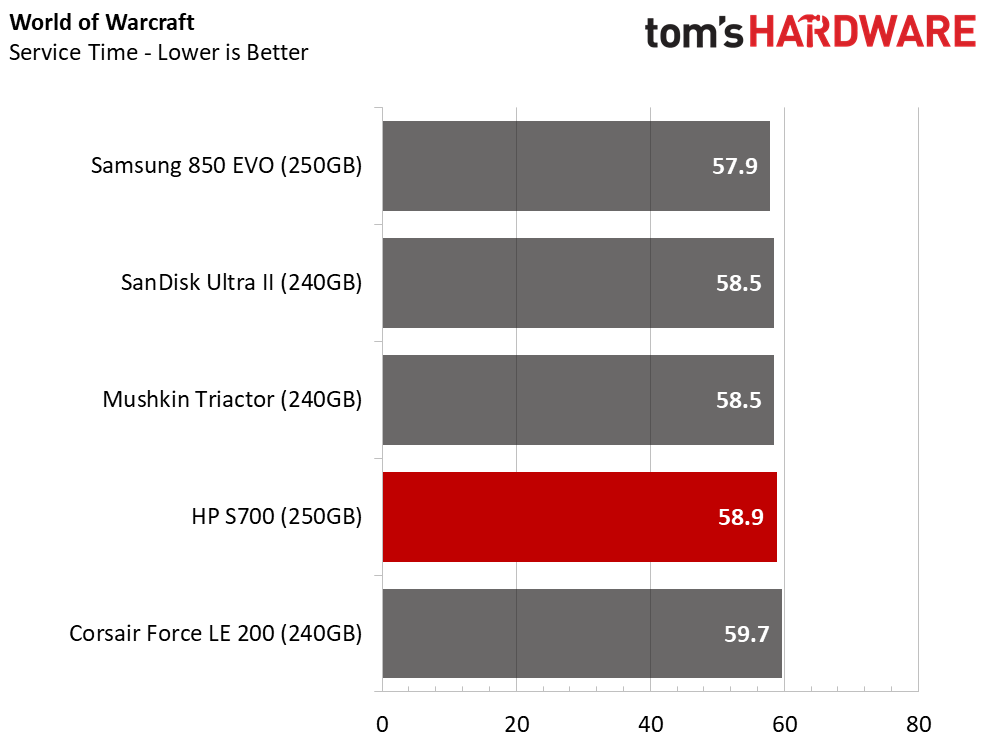
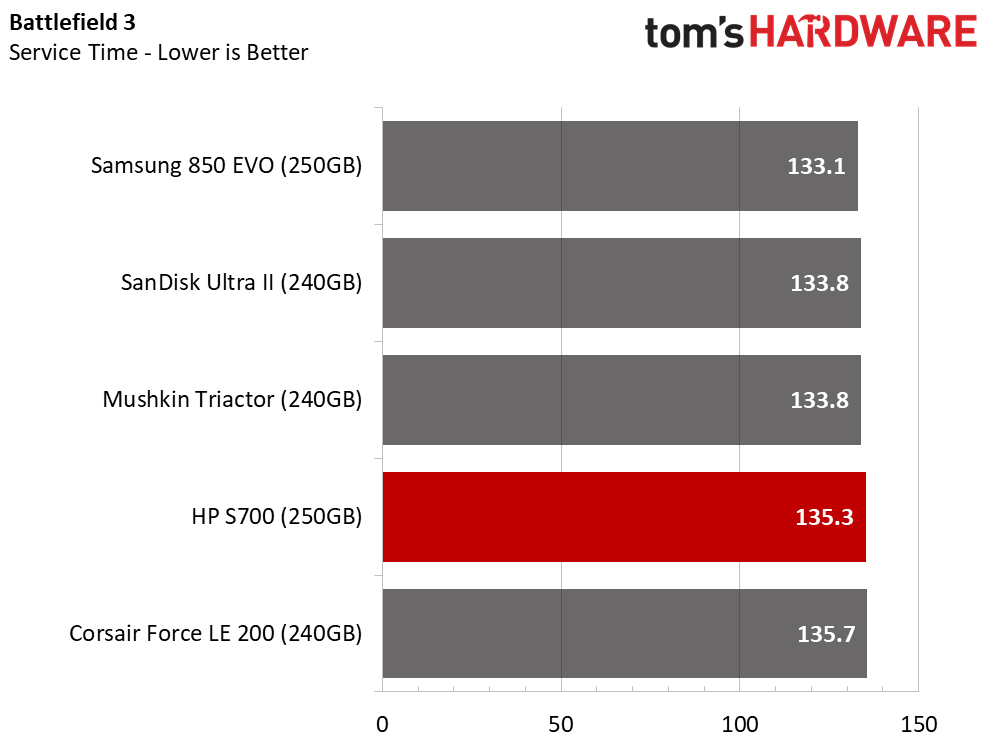
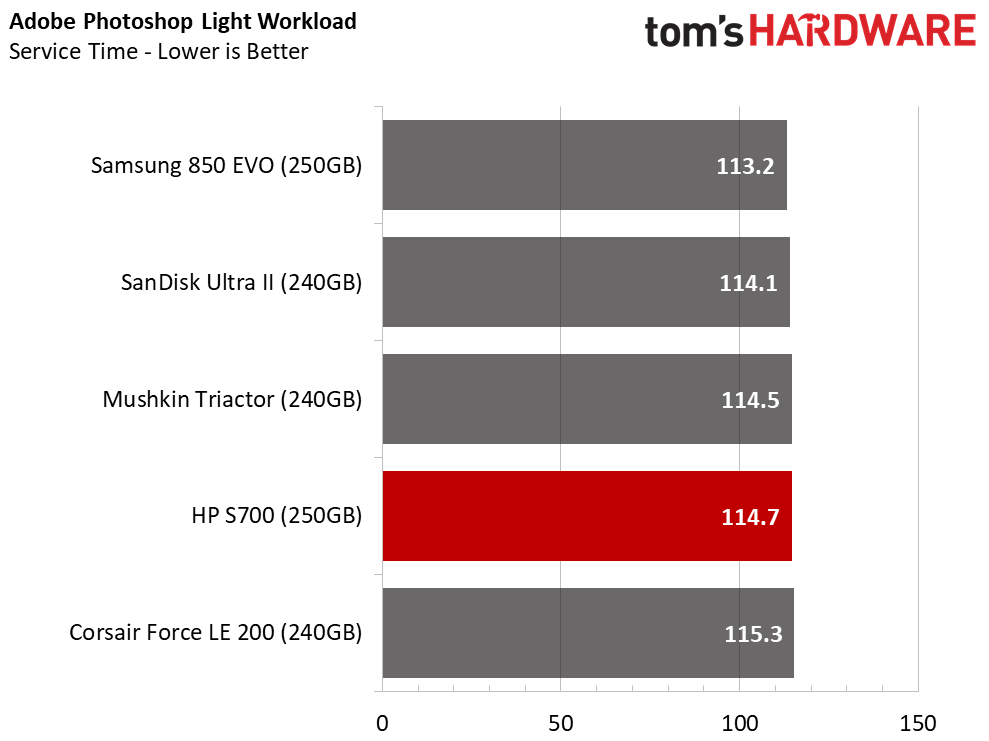
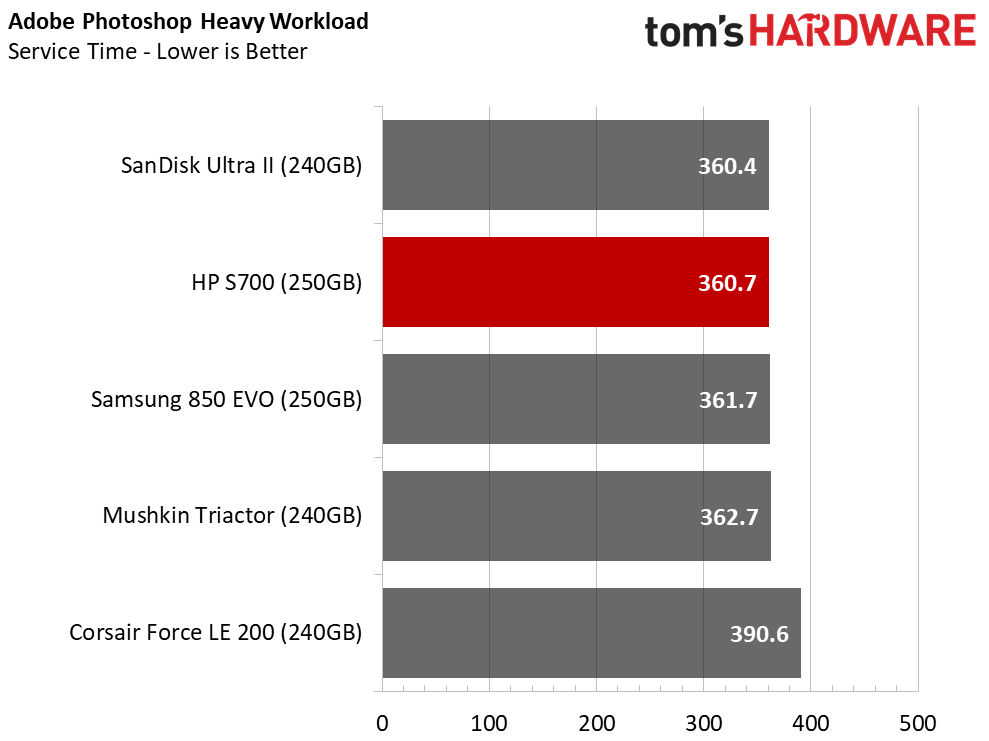
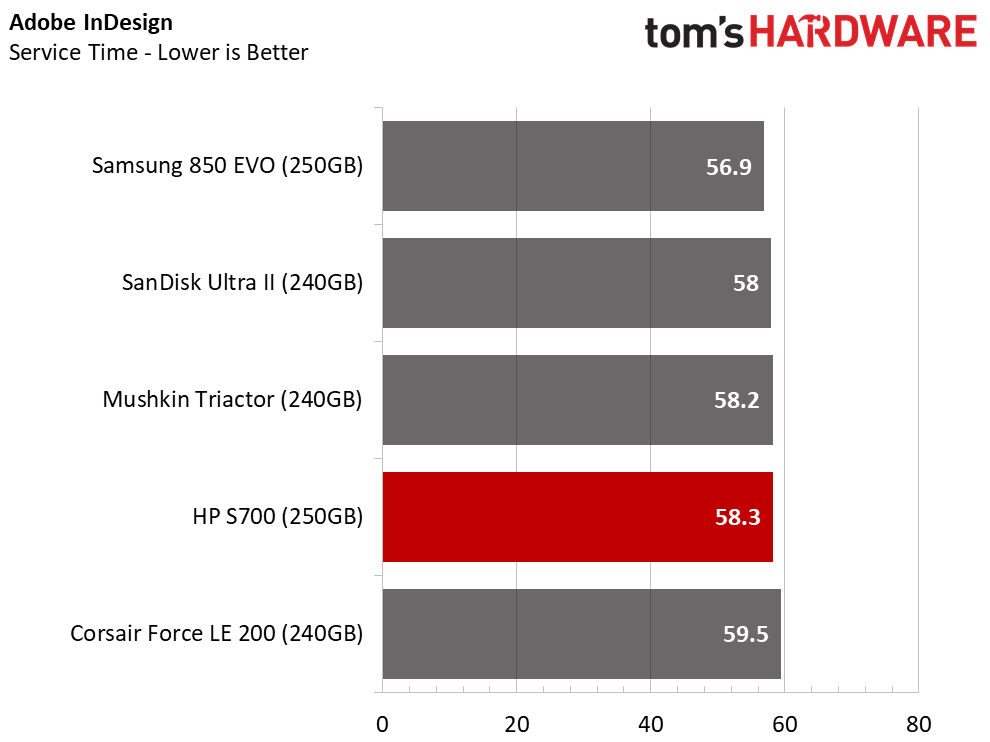
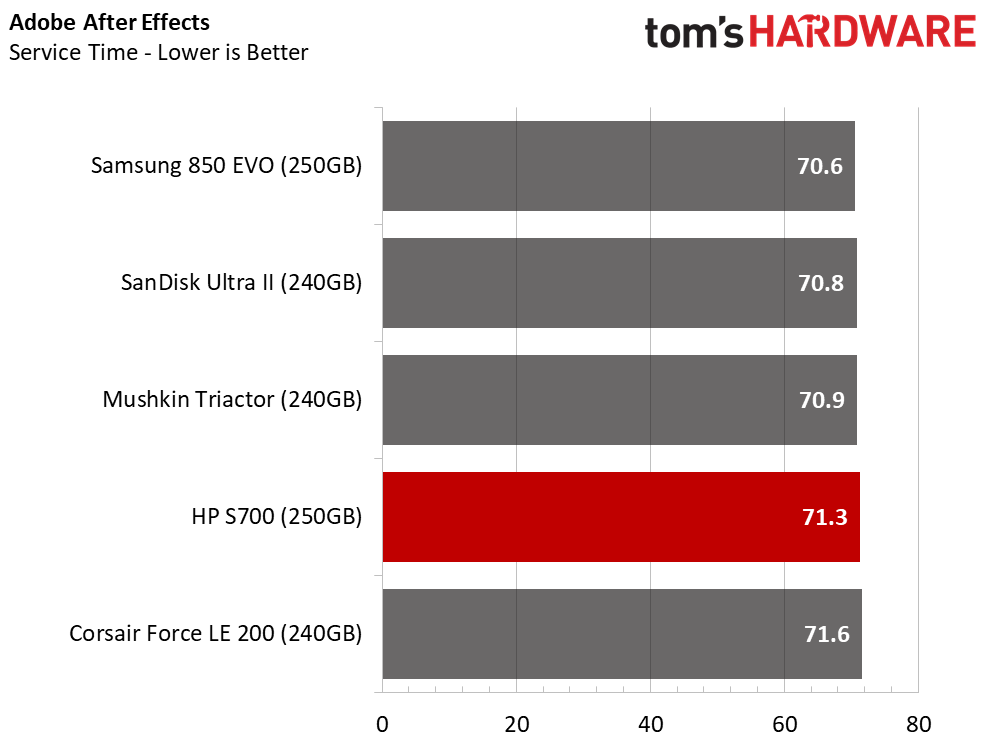
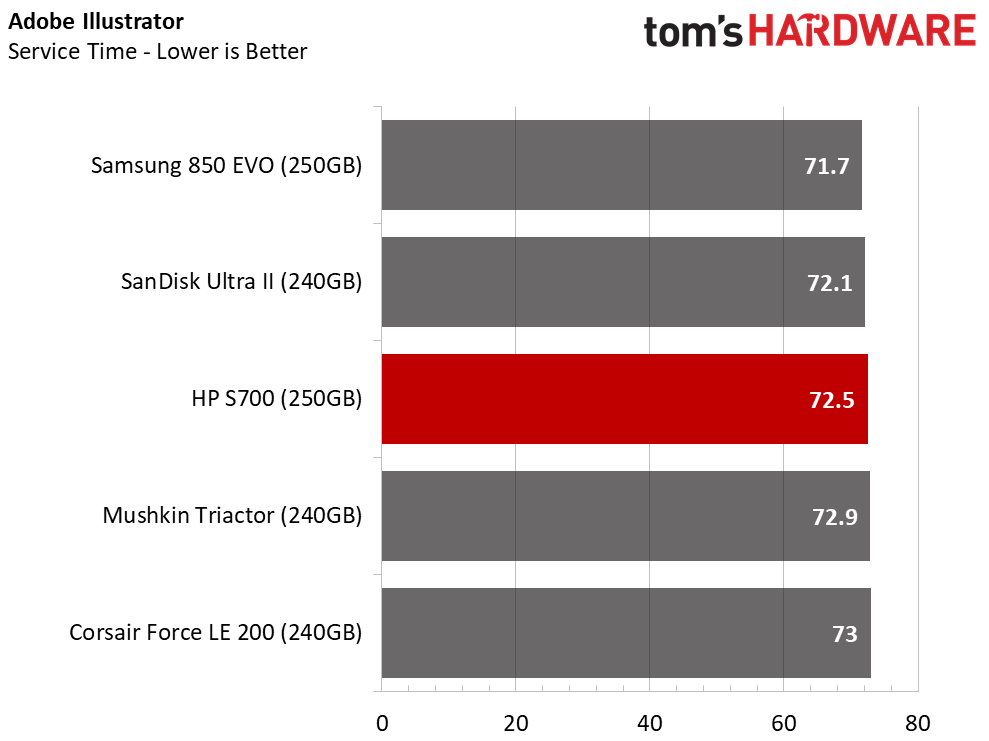
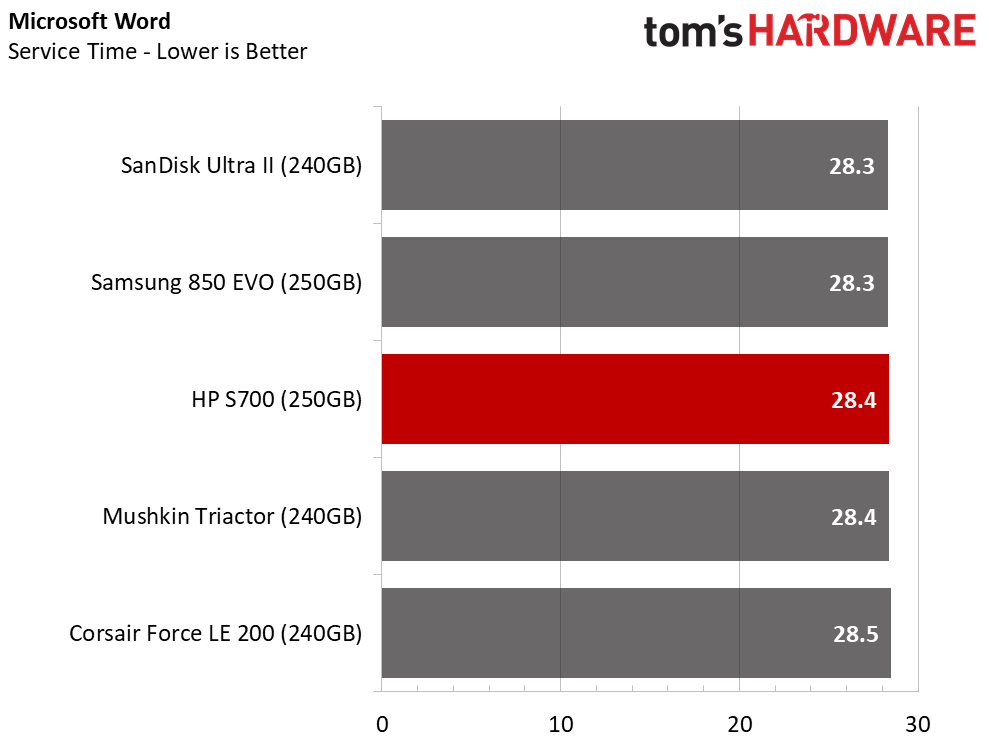
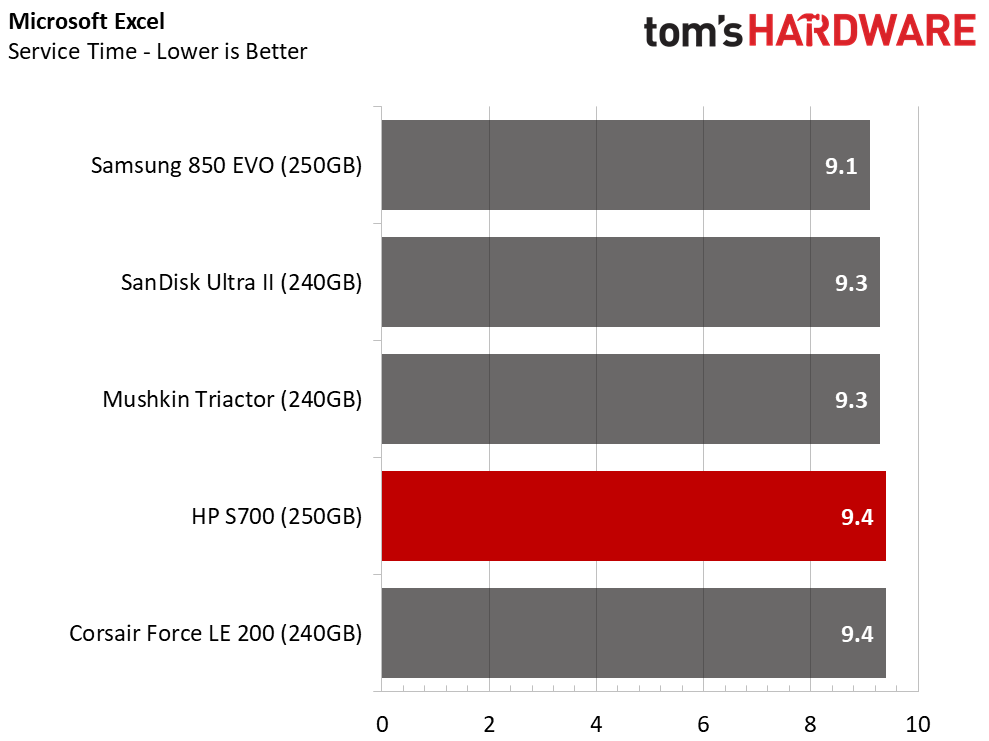
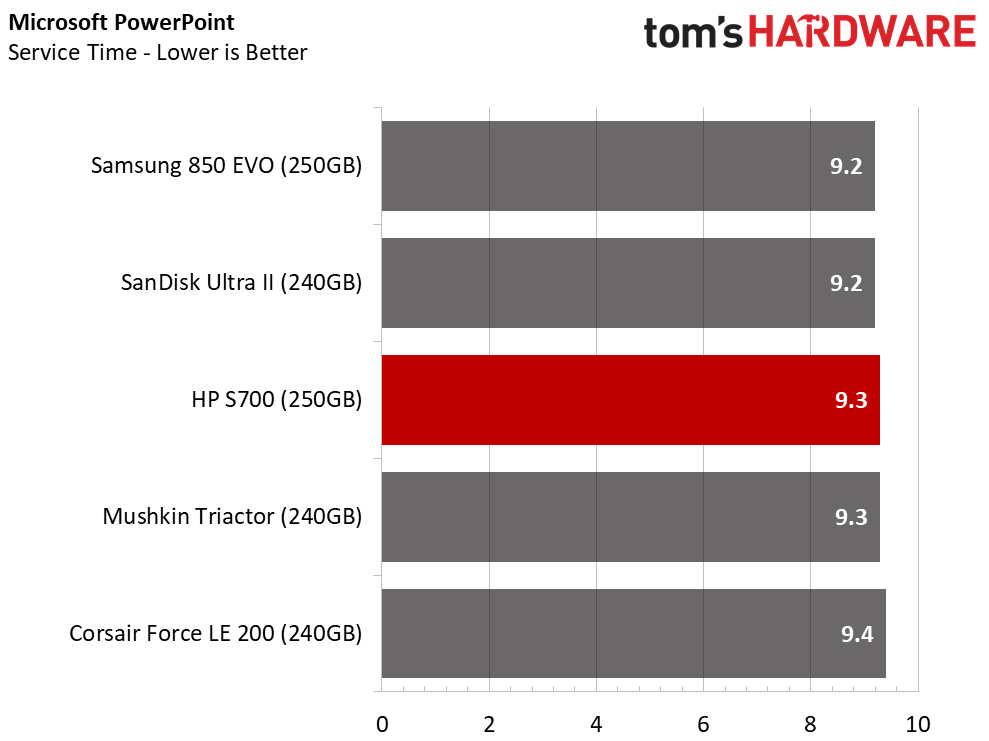
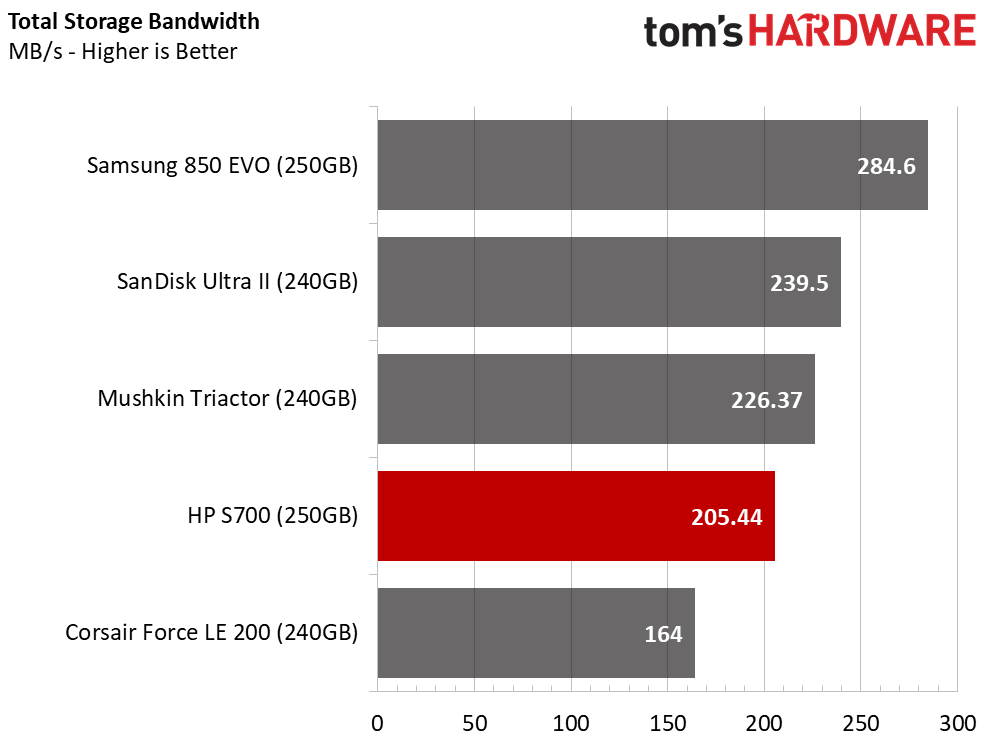
The S700 250GB compares much better to similar products than the larger 500GB model. The performance simply doesn't match the price of either model we tested, though.
Application Storage Bandwidth
With common applications, the S700 250GB is only slightly slower than the 500GB. In contrast, the 850 EVO's performance drops much more between these two capacities.
PCMark 8 Advanced Workload Performance
To learn how we test advanced workload performance, please click here.
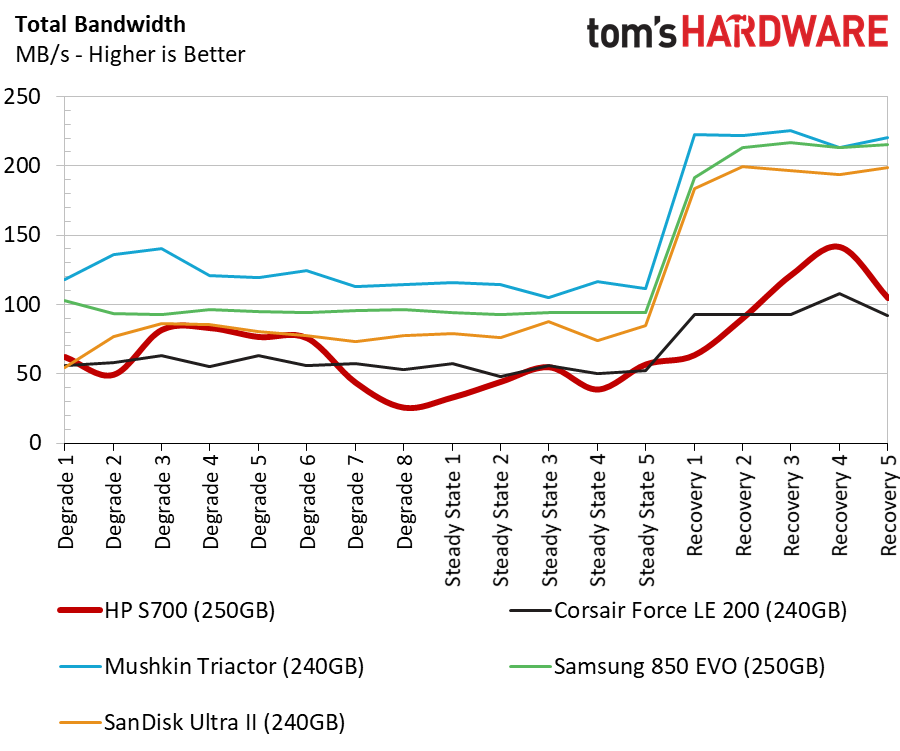
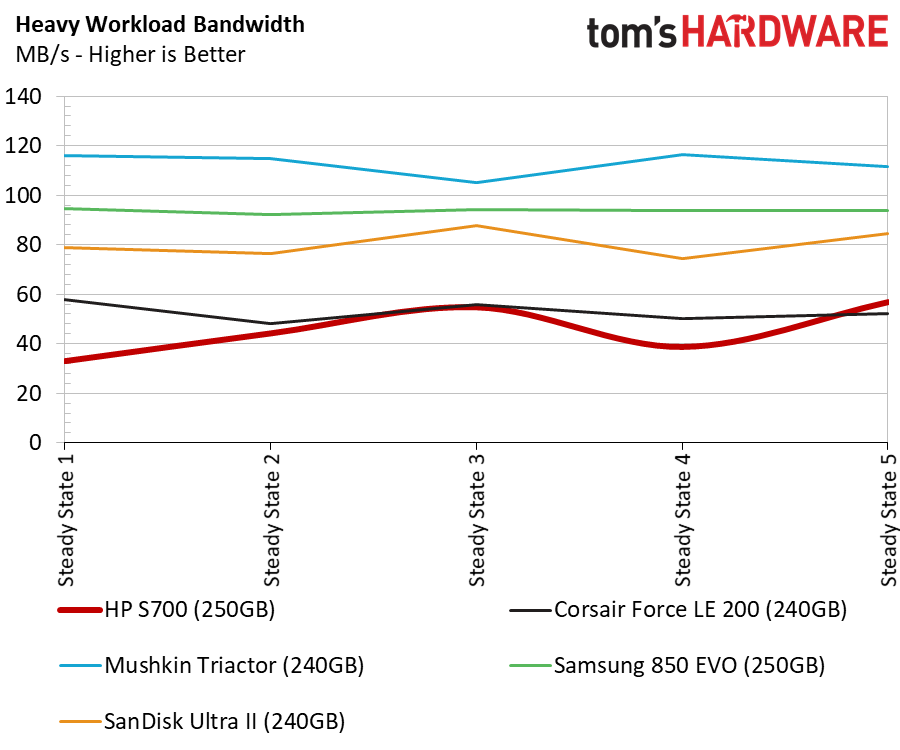
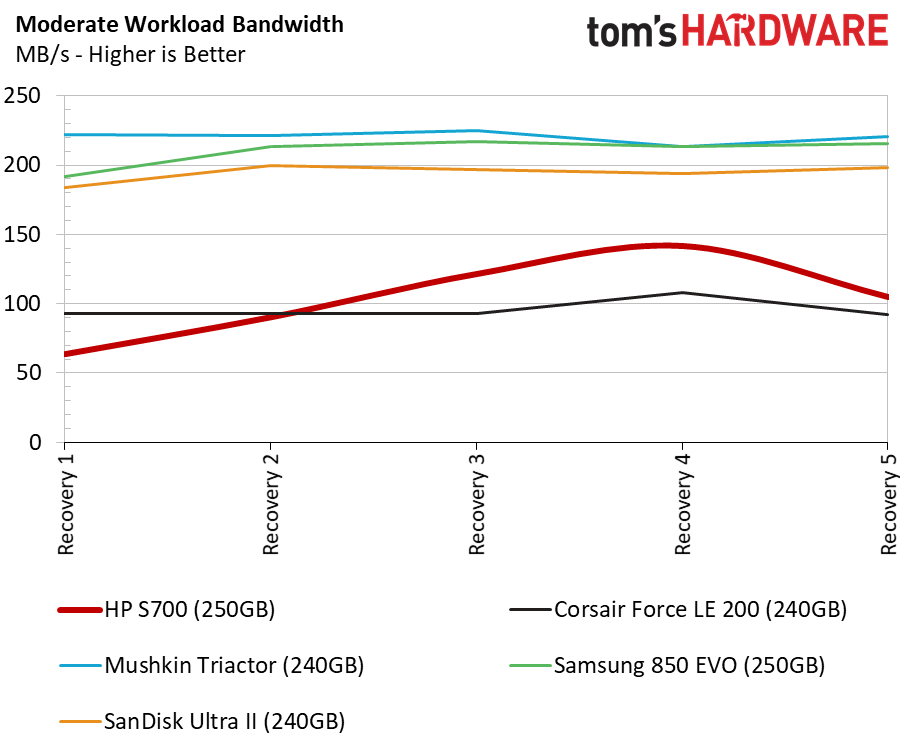
The HP S700 with its advanced programming and 3D NAND flash still doesn't close the gap with DRAMless SSDs. The performance is only slightly faster than the DRAMless SSDs we tested with planar NAND earlier in the year. Performance needs to improve, and prices need to decrease for DRAMless SSDs to thrive.
Total Service Time
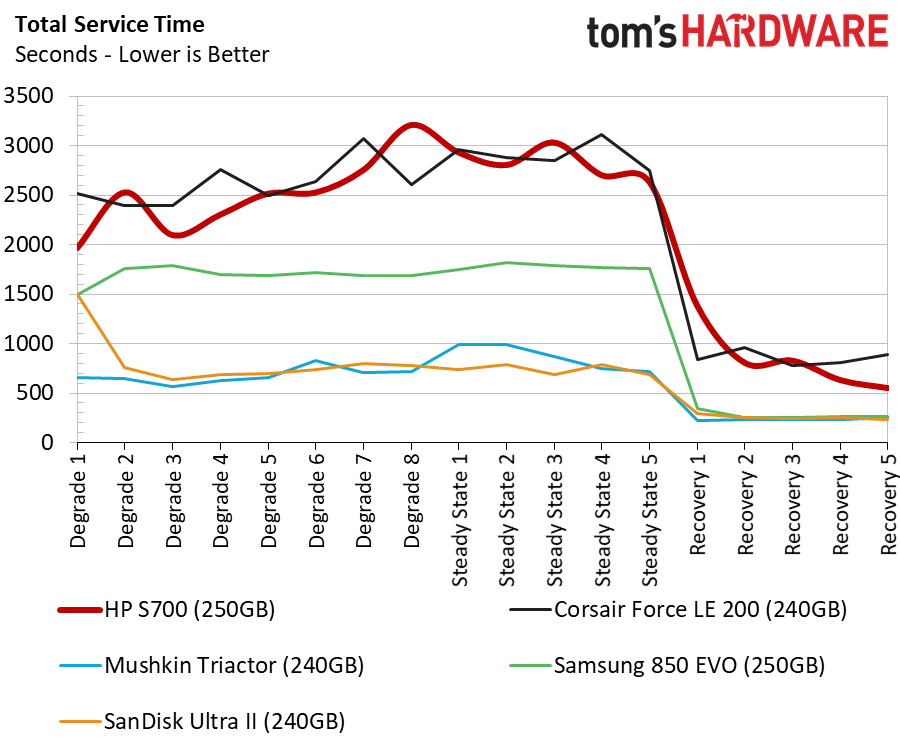
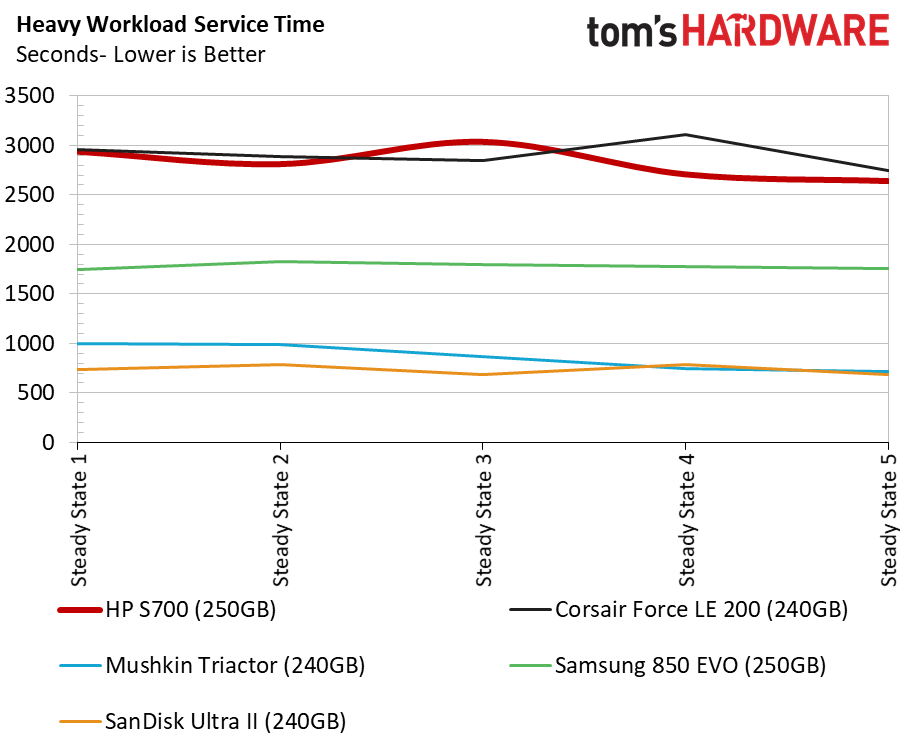
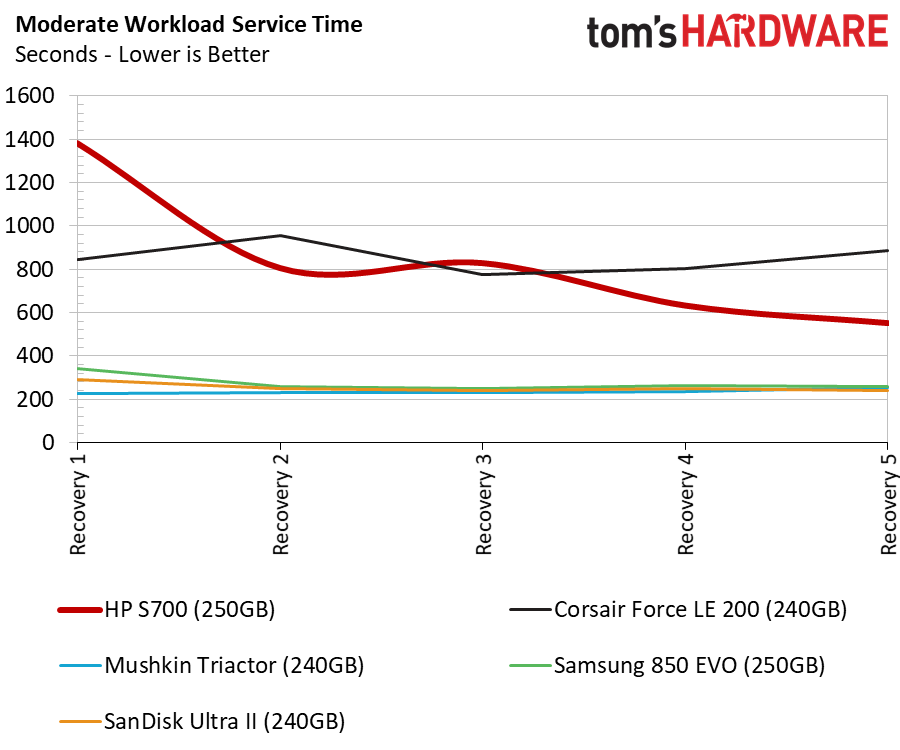
The service time tests show an unreasonable amount of latency. People buy SSDs to avoid this excessive latency, and there is technology available to utilize the flash in a better manner without unnecessarily increasing production or component costs.
Disk Busy Time
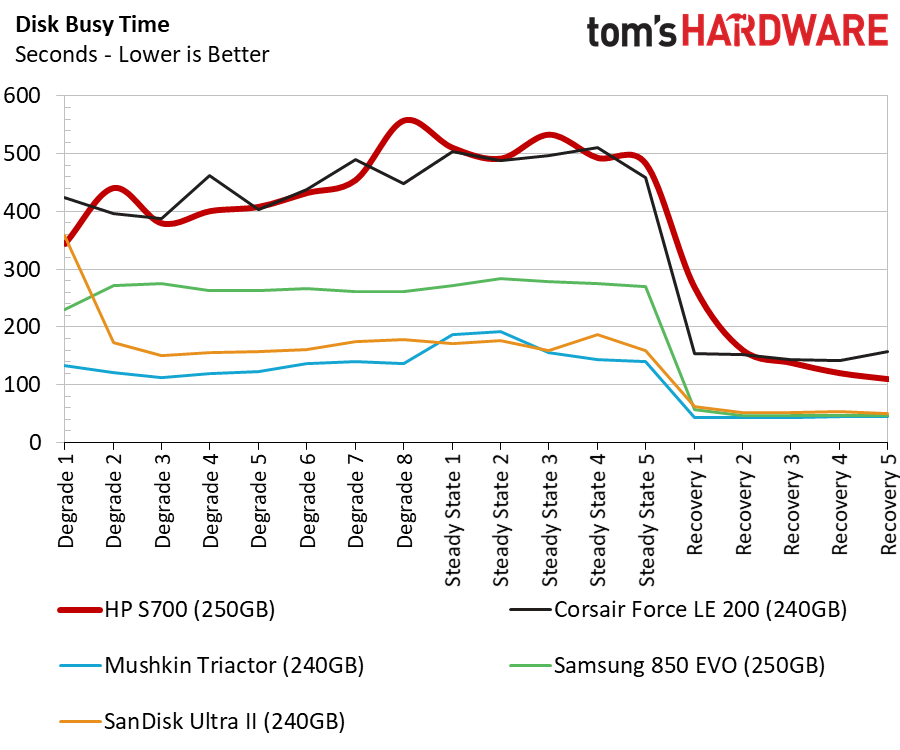
The two DRAMless SSDs suffer the highest levels of disk busy time. The correlation isn't by chance. All of the DRAMless products take longer to complete the workload.
Responsiveness Test
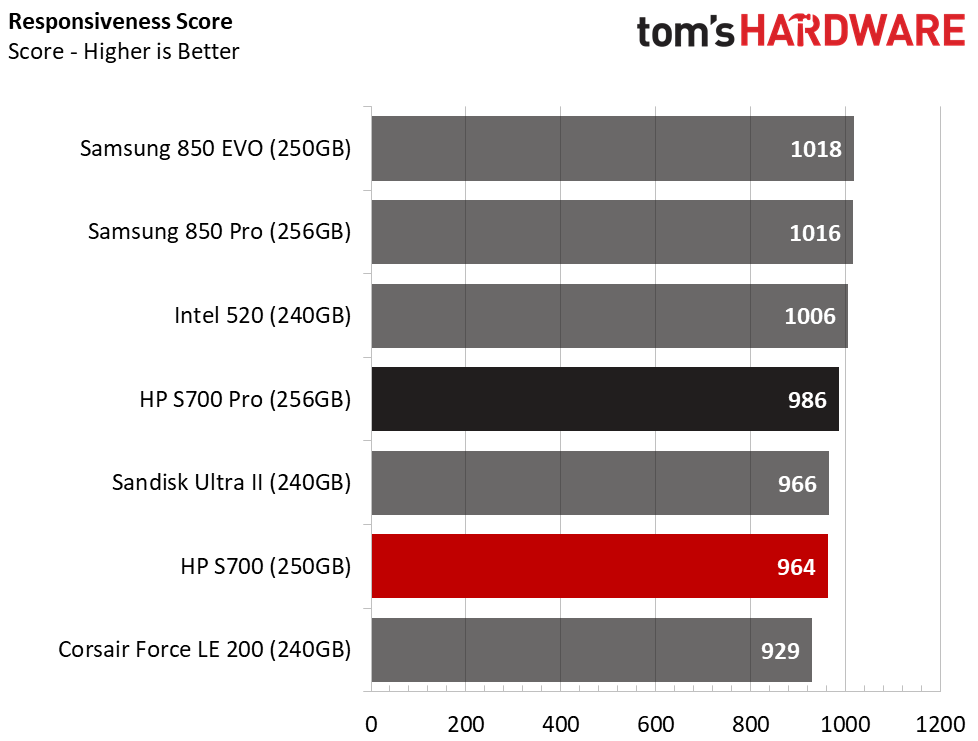
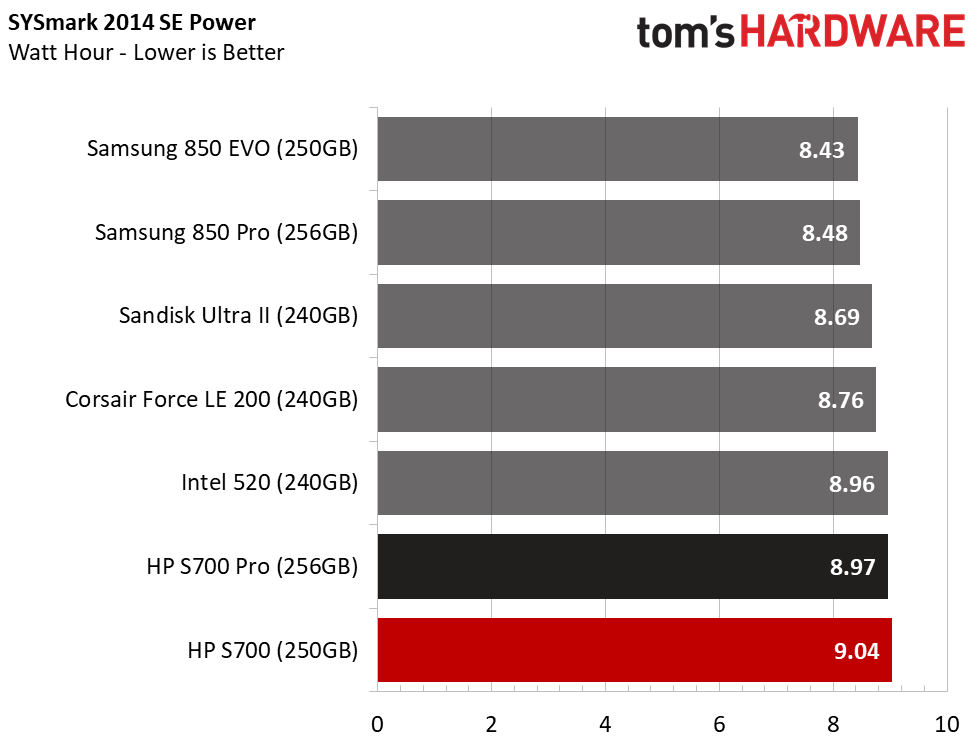
We included the HP S700 Pro 256GB with the S700 250GB to show the loss of responsiveness and increased power consumption. We've also included the Intel SSD 520 Series with a SandForce SF-2281 controller, which is the most popular DRAMless SSD ever made.
The S700 250GB outperforms the Phison S11-based Corsair Force LE 200 240GB, but it doesn't compete with the much older Intel SSD.
Notebook Battery Life
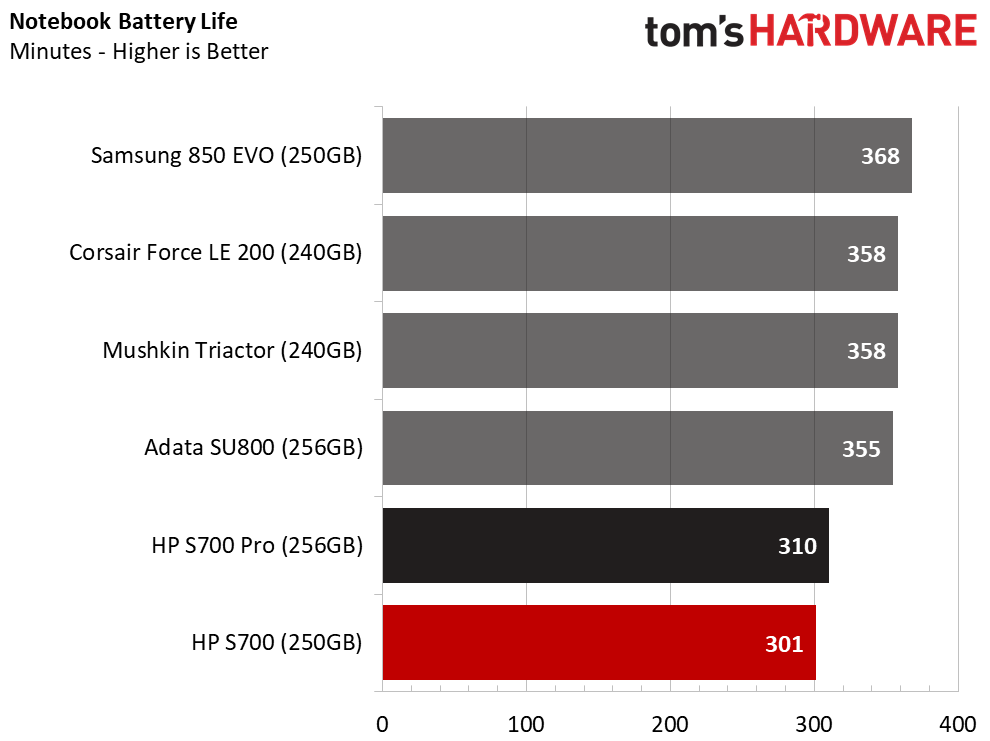
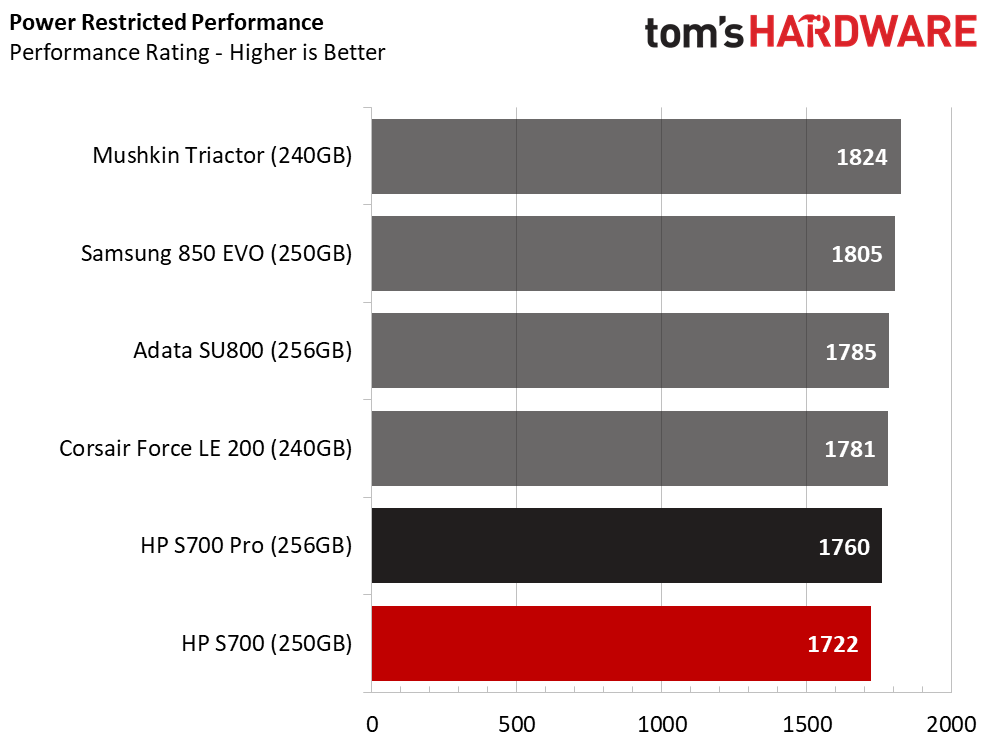
The HP S700 Pro lowered the bar for notebook battery life under real-world conditions. The only way HP could use more power is to take away the DRAM so the drive has to work much longer to complete the tasks for the test. The longer a drive has to work, the less time it spends in a low-power idle state.
MORE: Best SSDs
MORE: How We Test HDDs And SSDs
MORE: All SSD Content

Chris Ramseyer was a senior contributing editor for Tom's Hardware. He tested and reviewed consumer storage.
-
mapesdhs Still the non-zero-origin graph for the sequential read results; really needs fixing. Other than that, thanks for the review!Reply -
mapesdhs PS. The forum mechanism is *completely* broken. Took ages to get the page in a logged-in state to post the above (forum link doesn't work properly); I wanted to edit my message but the .co.uk site keeps redirecting incorrectly, both sites fail to remember login details, the comment submission button often produces in invalid form error... it just goes on and on. Why is the toms forum system such a mess?Reply -
derekullo Reply20408892 said:PS. The forum mechanism is *completely* broken. Took ages to get the page in a logged-in state to post the above (forum link doesn't work properly); I wanted to edit my message but the .co.uk site keeps redirecting incorrectly, both sites fail to remember login details, the comment submission button often produces in invalid form error... it just goes on and on. Why is the toms forum system such a mess?
Yeah, the Tom's new forums reminds me of the Intellilink episode of south park...
http://southpark.cc.com/clips/pcqo6r/intellilink-is-amazing
-
Zaporro whats the point of even listing interface speed if devices dont make full use of it? interface type sure, thats important but speed is meaninglessReply
"oh look at our drive, its 6Gb/s interface speed, and lest completely forget that we are bottlenecked at controller speed (SSD) or plate speed (HDD) maybe customer is too stupid to find out"
for HDD even SATAI was enough for most of them
when SSD started appearing SATAIII was a standard already and just, it seems that fastests SSD's in 2.5" factor form reach ~550MB/s which still has plenty of headroom in SATA3 theoretical 750MB/s
the "Technical specification" table should list actual read/write speeds first before the useless interface speed, that what an user would expect from a serious technical review site... -
mapesdhs Reply20409992 said:... it seems that fastests SSD's in 2.5" factor form reach ~550MB/s which still has plenty of headroom in SATA3 theoretical 750MB/s
Ten seconds in a search engine would find the answer. To quote MariusMatutiae from howtogeek.com:
"While data is actually sent at 6 Gb/s, it is encoded to counteract two common defects in telecommunications, DC Bias and Clock Recovery. This is often accomplished using a specific coding algorithm called 8b/10b Encoding. It is not the only encoding algorithm which has been devised to this end (there is also a Manchester encoding), but it has become the de facto standard for SATA data transfer.
In 8b/10b encoding, eight bits of signal are replaced by 10 bits of (signal + code). This means that, out of the 6 Gb the channel sends in a second, only 8/10 (4/5) are signal. 4/5’s of 6 Gb is 4.8 Gb, which in turn equals 600 MB. This is what degrades the 6 Gb/s channel into a mere(?) 600 MB/s channel.
The advantages obtained by compensating for DC bias and allowing for Clock Recovery more than compensate for this slight degradation."
In reality, with other overhead issues factored in aswell, SATA3 tops out at around 550MB/sec, as confirmed by PCIe models based on the same technology as their SATA3 counterparts.
Ian.
-
WyomingKnott "It's not a heart-racing combination, but it's still faster than a hard disk drive under most workloads." Under most workloads? They've managed to slow SSDs down to the speed of hard drives?Reply -
mapesdhs Reply20421269 said:"... They've managed to slow SSDs down to the speed of hard drives?
It is kinda nuts. I bet if mainstream and good SSDs from a few years ago were included in modern test results, instead of only current models, a lot of the current products would look pretty rotten. As long as this trend continues, I just keep looking for lightly used 840 Pro and other decent models (Vector, Neutron GTX, Vertex 4, etc.)
Ian.
