Samsung 840 EVO SSD: Tested At 120, 250, 500, And 1000 GB
Last week, Samsung unveiled a successor to its wildly popular 840 at the company's Global SSD Summit in Seoul, South Korea. Stacked with a series of new features and 19 nm, three-bit-per-cell NAND, we benchmark four models and make a recommendation.
Results: Tom's Hardware Storage Bench v1.0
Storage Bench v1.0 (Background Info)
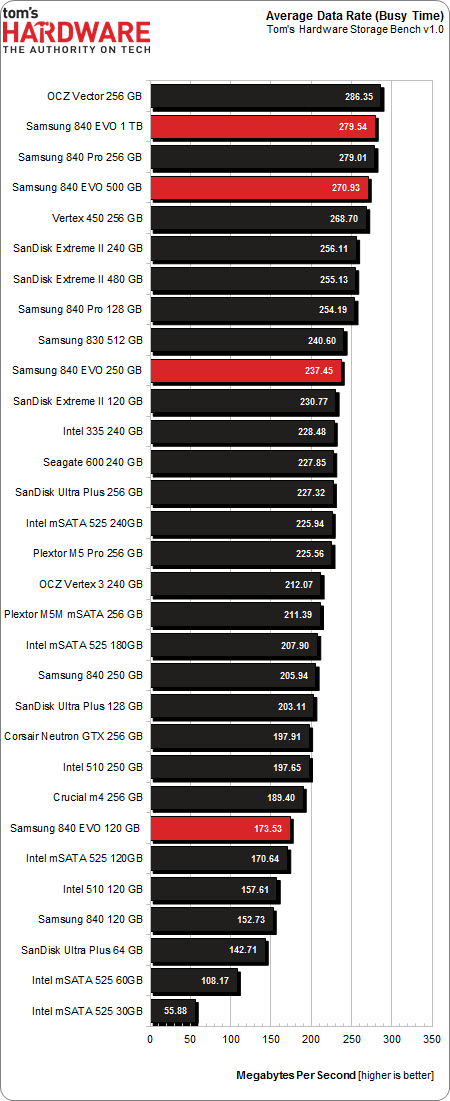
Our Storage Bench incorporates all of the I/O from a trace recorded over two weeks. The process of replaying this sequence to capture performance gives us a bunch of numbers that aren't really intuitive at first glance. Most idle time gets expunged, leaving only the duration that each benchmarked drive was actually busy working on host commands. So, by taking the ratio of that busy time and the the amount of data exchanged during the trace, we arrive at an average data rate (in MB/s) metric we can use to compare drives.
It's not quite a perfect system. The original trace captures the TRIM command in transit, but since the trace is played on a drive without a file system, TRIM wouldn't work even if it were sent during the trace replay (which, sadly, it isn't). Still, trace testing is a great way to capture periods of actual storage activity, a great companion to synthetic testing like Iometer.
Incompressible Data and Storage Bench v1.0
Also worth noting is the fact that our trace testing pushes incompressible data through the system's buffers to the drive getting benchmarked. So, when the trace replay plays back write activity, it's writing largely incompressible data. If we run our storage bench on a SandForce-based SSD, we can monitor the SMART attributes for a bit more insight.
| Mushkin Chronos Deluxe 120 GBSMART Attributes | RAW Value Increase |
|---|---|
| #242 Host Reads (in GB) | 84 GB |
| #241 Host Writes (in GB) | 142 GB |
| #233 Compressed NAND Writes (in GB) | 149 GB |
Host reads are greatly outstripped by host writes to be sure. That's all baked into the trace. But with SandForce's inline deduplication/compression, you'd expect that the amount of information written to flash would be less than the host writes (unless the data is mostly incompressible, of course). For every 1 GB the host asked to be written, Mushkin's drive is forced to write 1.05 GB.
If our trace replay was just writing easy-to-compress zeros out of the buffer, we'd see writes to NAND as a fraction of host writes. This puts the tested drives on a more equal footing, regardless of the controller's ability to compress data on the fly.
Get Tom's Hardware's best news and in-depth reviews, straight to your inbox.
Average Data Rate
The Storage Bench trace generates more than 140 GB worth of writes during testing. Obviously, this tends to penalize drives smaller than 180 GB and reward those with more than 256 GB of capacity.
The 840 EVOs crush our average data rate chart, representing read and write performance combined. Despite the perception that this is a value-oriented product, we've already shown the 840 EVO's read speeds to be as good as any other SSD, while Samsung's Turbo Write feature augments write performance. The 1 TB and 500 GB 840 EVOs take second and fourth place, while the other two capacities turn in respectable performance as well.
Current page: Results: Tom's Hardware Storage Bench v1.0
Prev Page Results: 4 KB Random Writes Next Page Results: Tom's Hardware Storage Bench, Continued-
Someone Somewhere Surely it would make sense to compare it to the vanilla SSD840. Also, there's no 840 Pro in the power charts.Reply
While the 1TB drive coming down to ~65c/GB is nice, seeing the 120 GB drives get near there would be nice. Especially since this is meant to be the value king. -
drwho1 I have 2 840 pro 512 GB SSD's (1 on my notebook 1 on my PC)Reply
I got them on a sale on Newegg for around $500 for both of them. :)
A 1TB would be cool if I find it on sale....
or maybe I should try out writing a letter to someone fat in some weird red costume...
-
slomo4sho The performance gap between the 840 Evo and 840 Pro is discouraging for the lower capacity models. I understand that the Pro is the flagship product but I was expecting less of a gap in in the 120GB models since this is a newer generation product and the 840 Pro is still based on the 21nm MLC NAND. However, the 1TB model is is a great choice for mass SSD storage. Lets hope the prices drop below $0.50 per GB soon.Reply -
Someone Somewhere MLC is faster than TLC, and bigger node NAND is usually faster. Only reason to go smaller is price and power.Reply -
SteelCity1981 I wonder if samsung plans on releasing a pro evo series since the regular series evo is to replace the older non pro versions.Reply -
razor512 ripoff, high prices for triple level flash especially at 19mm, the lifespan will likely suck and their shortened warranty represents that.Reply -
master9716 Cost for performance = Very High . ofcourse its not going to perform like a Pro but for the cost im amazed its that much better than the Regular 840.Reply -
J_E_D_70 Glad this review also refutes the perception of low TLC write endurance in normal desktop workloads. Been using a 128GB 840 in a daily-use desktop for eight months now and the endurance counter hasn't decremented at all. I'll have replaced the entire rig long before it wears out.Reply -
JohnnyLucky Interesting review. I think the point to remember is that the 840 EVO is not a high end enthusiast ssd like the 840 Pro. Instead, consider the 840 EVO as a mainstream ssd suitable for most consumer and home office scenarios.Reply
