The new mainstream Radeon: The 9000 series
3D Mark 2001 Detail
In addition to the popular overall scores for 3D, the 3D Mark 2001 benchmark test also gives very detailed results in individual disciplines. This is very good for determining the strengths and weaknesses of the individual cards. However, Mad Onion's benchmark has a few downsides, which make the results for the individual tests seem a bit questionable, as is the case for the fill rate test.
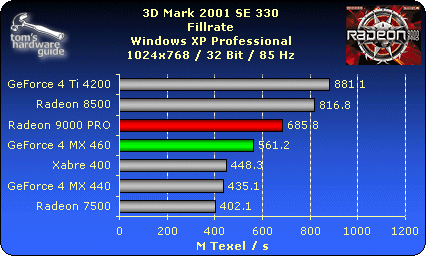
Fill Rate: Single-Texturing

This benchmark tests for speed when in single-texturing mode. Interestingly enough, the R9000 lags behind its older sibling, the R8500, despite the fact that it runs at the same clock speed. This might be caused by the use of additional alpha blending operations in the single-texturing test.
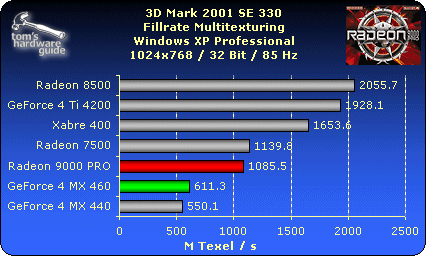
Fill Rate: Mutltitexturing

Here, the stripped-down pixel pipelines of the R9000 make themselves especially evident. The R9000 reaches almost exactly half of the performance of the R8500, and so it even places behind its predecessor, the R7500. As opposed to the single-texturing test, Mad Onion does not use additional alpha blending operations. However, the GeForce4 MX models, with their castrated pixel pipes, perform even worse than that. Noteworthy is the Xabre 400, which performs very well in this test.
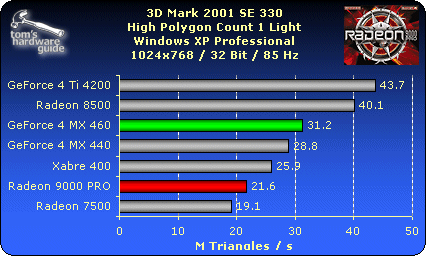
High Polygon Count - 1 Light

Even here, the R9000 PRO loses heavily compared to the R8500, ending up just before last place, which is held by the R7500.
Stay on the Cutting Edge
Join the experts who read Tom's Hardware for the inside track on enthusiast PC tech news — and have for over 25 years. We'll send breaking news and in-depth reviews of CPUs, GPUs, AI, maker hardware and more straight to your inbox.
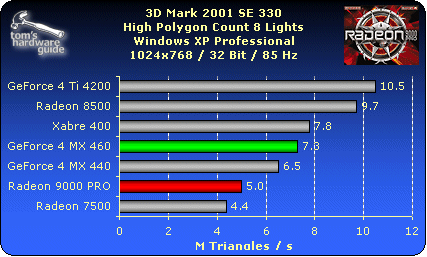
High Polygon Count - 8 Lights

In this test, the results are about the same, except that the Xabre 400 is able to overtake both of the MX models.
Most Popular

