







Why you can trust Tom's Hardware Our expert reviewers spend hours testing and comparing products and services so you can choose the best for you. Find out more about how we test.
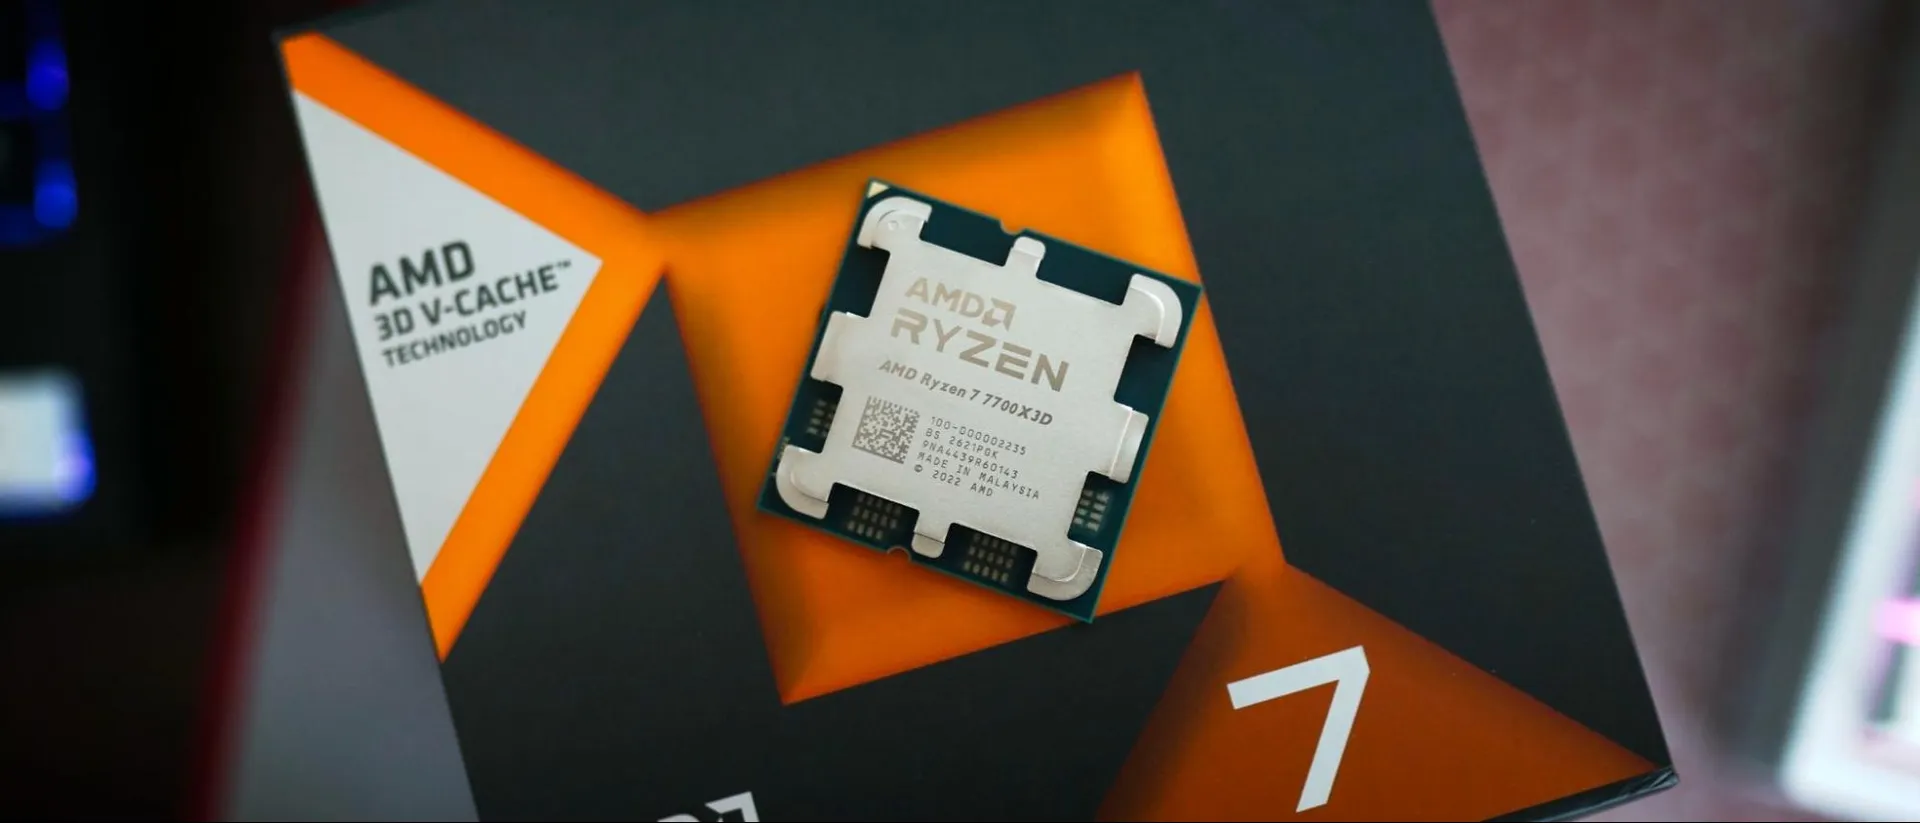
The Ryzen 7 7700X3D puts to bed any notion that clock speed is irrelevant in a modern gaming PC. The chip is sandwiched between two other X3D chips: the coveted Ryzen 7 7800X3D and the less-considered Ryzen 5 7600X3D. The 7700X3D shares its DNA with the 7800X3D, both sporting eight Zen 4 cores and 104 MB of combined L2/L3 cache. The 7700X3D just shaves 200 MHz off the base clock and 500 MHz off the boost clock.
As usual, we tested a suite of modern games at 1080p with a mixture of High and Ultra settings, and without upscaling or frame generation enabled. We use the RTX 5090 on our CPU test bench to remove any GPU bottlenecks and isolate CPU performance as much as possible.
Given that we have eight cores to play with, I expected the 7700X3D’s gaming performance to land closer to the 7800X3D, not the 7600X3D. That’s not the case. The 7800X3D is 4% faster than the 7700X3D on average in games, while the 7700X3D is just 2% faster than the 7600X3D. You don’t give up much performance with the 7700X3D compared to the 7800X3D, but on the other hand, you don’t gain much performance compared to the 7600X3D, despite a $90 to $100 difference in price.
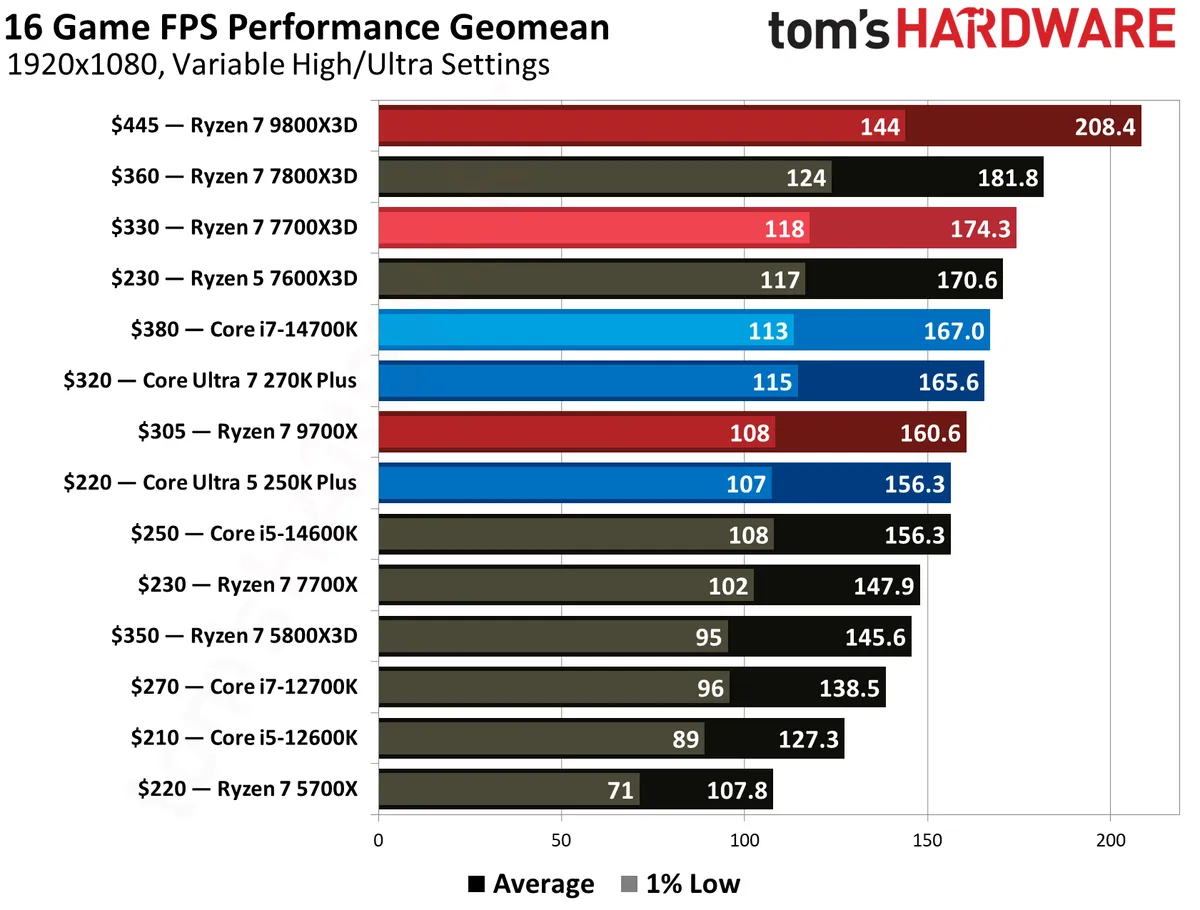
The Ryzen 7 9800X3D remains the fastest gaming CPU on the market, outside of the better-binned Ryzen 7 9850X3D, and it’s 19% ahead of the 7700X3D. Looking backwards a generation, the re-released Ryzen 7 5800X3D at $350 is in a tough spot. The 7700X3D is nearly 20% faster despite arriving on the market for $20 less. The impact of memory shortages has created some bizarre value comparisons, especially for CPUs.
Breaking out of the X3D bubble, Intel’s latest Core Ultra 7 270K Plus remains potent competition. The 7700X3D is ahead by 5%, and slightly less compared to the Core i7-14700K, which isn’t as wide of a margin as we’re used to seeing with new X3D chips. Particularly when bringing application performance into the mix, which we’ll get to next, the Core Ultra 7 270K Plus justifies a single-digit drop in gaming performance for how much it gains elsewhere; that’s assuming, of course, that you aren’t going for a pure gaming rig.
With Raptor Lake Refresh and Alder Lake chips, we tested with DDR5 memory (you can read more about our testing procedure later in this review). We tested DDR4 memory recently on these chips in our Ryzen 7 5800X3D re-review. That data is excluded here to keep the charts readable, but you shouldn’t expect miracles with DDR4. Based on our results, Raptor Lake Refresh chips with DDR4 are in the low single digits behind the Ryzen 7 5800X3D.


View Original

View Original

View Original

View Original

View Original

Outside of frame rate, you can see that the Ryzen 7 7700X3D landed squarely on 4.5 GHz in our gaming tests. Interestingly, the Ryzen 7 7800X3D locked in the same average as the 7600X3D at 4.7 GHz, despite the former boosting up to 5 GHz. The Ryzen 7 7700X3D also arrived at the lowest average power consumption, despite carrying a 120W TDP, clocking in just 0.1 W behind the 7600X3D.
Get Tom's Hardware's best news and in-depth reviews, straight to your inbox.
The power consumption figures are interesting. The 7700X3D carries the same TDP as 7800X3D, but real-world power consumption is closer to the 7600X3D, which has a 65W TDP. And that lowered power consumption helps temperatures, with the 7700X3D clocking a cozy 55-degree Celsius average.
There’s headroom here in temperatures and power consumption for AMD’s Precision Boost Overdrive (PBO) to close the gap with the 7800X3D (but, then again, that chip has access to PBO, as well). We manually disable PBO in our testing, as it can push the chip outside of AMD’s default specifications, and in turn, void your warranty. If the warranty isn’t a concern for you, however, the 7700X3D should take nicely to a PBO bump.
007 First Light Benchmarks


View Original

View Original

View Original

View Original

View Original

007 First Light is the newest game in our test suite, and despite IO Interactive’s Glacier engine taking particularly well to X3D CPUs in Hitman 3, we see a shift toward Intel here. The 270K Plus is 7.6% faster than the 7700X3D, and that’s without optimization for Intel’s new iBOT feature. We can also see slightly weaker 1% lows on the 7700X3D compared to the other Zen 4 X3D chips, though nothing that completely changes the perceived smoothness.
Baldur’s Gate 3 Benchmarks


View Original

View Original

View Original

View Original

View Original

Baldur’s Gate 3, on the other hand, sees a nice boost with 3D V-Cache, as evidenced by the fact that the 5800X3D nearly matches the much newer 9700X (though with worse 1% low performance). The 7700X3D is in lockstep with the 7600X3D, and just shy of 6% behind the 7800X3D. Compared to the 270K Plus, the 7700X3D handily earns a victory with a 16.7% lead in average performance.
Looking at clock speeds, you can see Baldur’s Gate 3 gets much more out of these chips than First Light, all without an increase in power consumption. That leads to some exceptional efficiency results, with the 7700X3D offering two and a half frames for every watt consumed.
Crimson Desert Benchmarks AMD Ryzen 7 7700X3D


View Original

View Original

View Original

View Original

View Original

Crimson Desert is another recent addition to our test suite, and it shows remarkable CPU scaling in our benchmark of the dense city streets in the Hernand town center. Breaking from our other results, the 7700X3D is 6.9% ahead of the 7600X3D here, and just 1.3% behind the 7800X3D. The efficiency here is second to none at nearly three frames per watt. The 7700X3D is offering 7800X3D-like performance at 7600X3D-like power, which is the best-case scenario for this CPU.
Counter-Strike 2 Benchmarks


View Original

View Original

View Original

View Original

View Original

Counter-Strike 2 offers a closer look at the importance of 1% low performance, with our averages exceeding 600 FPS across most of the test pool. The 7700X3D is just 1.1% faster than the Core i7-14700K on average, but we can see a 24.7% jump in 1% low performance. That’s a common theme among all the X3D chips we tested in this game. That smoothness is important here. With such high average frame rates, swinging 100 FPS (or more) in either direction isn’t uncommon.
Cyberpunk 2077 Benchmarks


View Original

View Original

View Original

View Original

View Original

Cyberpunk 2077 shows a much tighter contest in average performance. Here, the 7700X3D is in lockstep with the Core Ultra 7 270K Plus and 14700K. Interestingly, the 7600X3D is a little faster here, though by less than a frame compared to the 7700X3D. Flipping over to our clock speed geomean, we can see what’s going on. Most of the chips in our test pool pushed up toward their maximum boost clock in this game, leaving the tame boost clock of the 7700X3D behind.
We’re looking at very tame power usage here, with an average of just 67 watts, and plenty of thermal headroom. PBO would help the 7700X3D push out a small lead over the Intel competition.
Doom: The Dark Ages Benchmarks


View Original

View Original

View Original

View Original

View Original

Doom: The Dark Ages is the only game in our suite using the Vulkan API, and it features always-on ray tracing. However, we still see CPU scaling even with such a GPU-focused pipeline. The 270K Plus squeezes out a marginal lead over the 7700X3D, but AMD’s chip is a bit more consistent in 1% low performance. The 250K Plus is especially impressive here, offering average performance on the level of $300+ CPUs for just $220.
As we can see from our clock speed results, the CPUs we tested ran comfortably below maximum boost clocks, suggesting the game is heavily threaded. As a result, the 7700X3D claims a clean 5% lead over the 7600X3D, nearly matching the 7800X3D.
F1 2024 Benchmarks


View Original

View Original

View Original

View Original

View Original

F1 2024 is an interesting benchmark because it provides yet another example of the 7600X3D outclassing the 7700X3D. The performance is close enough to call it identical, but I ran five passes on this game on both the 7600X3D and 7700X3D, and came away with the same results. Regardless, F1 2024 shows a massive advantage toward X3D chips, with even the lowly Ryzen 7 5800X3D beating every non-X3D chip in our test pool.
Far Cry 6 Benchmarks
Far Cry 6 mirrors what we saw in Doom, with the 7700X3D, 7600X3D, and 270K Plus all arriving around the same average frame rate. We don’t see an upper ceiling like in Doom, however, allowing the 7800X3D to claim a lead of 6.9%, and the 9800X3D shooting ahead to a 30% lead.
The power use for the 7700X3D here is especially low, falling behind the 7600X3D by about 6%. There’s probably some small, untapped optimization here that would help the 7700X3D close the gap with the 7800X3D.
Final Fantasy XIV Benchmarks


View Original

View Original

View Original

View Original

View Original

Final Fantasy XIV is another title that loves 3D V-Cache, and even among X3D CPUs, the game shows big jumps for newer architectures. The 7700X3D is 21% ahead of the 270K Plus here, but all of the Zen 4 X3D chips are tightly grouped between 175 and 180 FPS. In a blind shootout, it’d be impossible to tell between them.
Once again, the efficiency of the 7700X3D is remarkable at over three frames per watt consumed. The chip drew just 55.7 watts on average during our test, 32% lower than the 270K Plus and in line with the 7600X3D.
Flight Simulator 2024 Benchmarks


View Original

View Original

View Original

View Original

View Original

The Ryzen 7 7700X3D slips in the rankings in Flight Simulator 24, clocking in a frame behind the 250K Plus and 4.6% behind the 270K Plus. The Ryzen 7 9800X3D enjoys a comfortable lead, but there’s very little difference between AMD’s Zen 4 X3D offerings. They remain the most efficient of the bunch, however, with average power consumption below 60W.
Hogwarts Legacy Benchmarks


View Original

View Original

View Original

View Original

View Original

The 7700X3D once again trails Intel in Hogwarts Legacy, with the 270K Plus offering a 9% bump in average performance. The 7700X3D is a marginal 1.5% faster than the 7600X3D in this game, and it trails the 7800X3D by 3.8%. The 9800X3D, meanwhile, is a staggering 29% faster than the 7700X3D.
Marvel Rivals Benchmarks


View Original

View Original

View Original

View Original

View Original

The Unreal Engine 5-based Marvel Rivals remains the most popular hero shooter on Steam, but despite its technical backbone, the game shows clear CPU scaling at 1080p. As expected, the 7700X3D is marginally faster than the 7600X3D, and 5.1% behind the 7800X3D. Similar to Hogwarts Legacy, Intel holds an advantage with Arrow Lake refresh, though at significantly higher power draw and worse efficiency as a result.
Minecraft RTX Benchmarks


View Original

View Original

View Original

View Original

View Original

Minecraft is easily the most difficult benchmark for Intel. We’ve seen consistently low performance out of Arrow Lake CPUs in this test. Note that our Minecraft test uses a render chunk distance of 96, specifically stressing the CPU and memory chain to it.
Spider-Man 2 Benchmarks


View Original

View Original

View Original

View Original

View Original

Spider-Man 2 shows the 270K Plus once again besting the 7700X3D, this time by 4.9%. The 7800X3D also offers around a 5% jump. We can again see clock speed acting as a big influence in this test, but that extra clock speed comes at the cost of increased power draw, with the 270K Plus nearly doubling the average wattage of the 7700X3D in this test.
Starfield Benchmarks


View Original

View Original

View Original

View Original

View Original

Starfield is one of the few examples where we can see a clear benefit of the 7700X3D over the 7600X3D, with the former posting a 6% lead. The 270K Plus is slightly ahead of the 7700X3D, with a 3.6% lead, while the 7800X3D pushes further with a 6.7% jump in average performance.
The Last of Us Part One Benchmarks


View Original

View Original

View Original

View Original

View Original

Rounding out our game suite is The Last of Us Part One, where both the 270K Plus and 7800X3D are around 6% faster than the 7700X3D. AMD’s latest CPU is 5% faster than the base Ryzen 7 7700X, and 4% faster than the 7600X3D. You can see AMD’s non-X3D chips running into a performance wall, with the 7700X and 9700X posting virtually identical results.
This is one of the few games where the 7700X3D consumed more power than the 7600X3D, though only with a 5% bump to average wattage. Still, that’s enough for the 7600X3D to steal the top slot in efficiency away from the 7700X3D, which sits at the top of the efficiency rankings in most other titles.
- MORE: Best CPU for gaming
- MORE: CPU Benchmark Hierarchy
- MORE: Intel vs AMD
- MORE: How to Overclock a CPU
Current page: AMD Ryzen 7 7700X3D Gaming Benchmarks
Prev Page A day late, a buck short Next Page AMD Ryzen 7 7700X3D productivity benchmarks
Jake Roach is the Senior CPU Analyst at Tom’s Hardware, writing reviews, news, and features about the latest consumer and workstation processors.
-
usertests The market will correct the price... possibly by raising the 7800X3D price.Reply
It's good and efficient out of the box. -
-Fran- Another swing and miss from AMD!Reply
Like... Why even release this CPU in this market AMD? Why not just stock pile it and sell it later when it makes more sense?
You're barely moving the 7800X3D at really good prices, how do you expect to move this thing at a worse P/P ratio? HOW?
Regards. -
vinay2070 Reply
Maybe they were not clocking as good as a 7800X3D and AMD still wanted to sell them? So they waited till they had enough of them and then started selling?-Fran- said:Another swing and miss from AMD!
Like... Why even release this CPU in this market AMD? Why not just stock pile it and sell it later when it makes more sense?
Why sell later though, there would be 9700X3D piling up which AMD may want to sell later. -
Why_Me PCPartPicker Part ListReply
CPU: *AMD Ryzen 7 7700X3D 4 GHz 8-Core Processor ($279.99 @ Newegg)
Total: $279.99
Prices include shipping, taxes, and discounts when available
*Lowest price parts chosen from parametric criteria
Generated by PCPartPicker 2026-07-17 01:14 EDT-0400
PCPartPicker Part List
CPU: *AMD Ryzen 7 7800X3D 4.2 GHz 8-Core Processor ($348.99 @ Amazon)
Total: $348.99
Prices include shipping, taxes, and discounts when available
*Lowest price parts chosen from parametric criteria
Generated by PCPartPicker 2026-07-17 01:15 EDT-0400 -
ohio_buckeye What’s funny is they reference a potential future Ryzen 5 7500x3d in the future. However that cpu already exists and has for a while as that’s the cpu currently in my pc.Reply
Anyway what stands out to me at least is I was watching a video review on the 7700x3d and of course they were using a 5090 and had various x3d CPUs shown including the 7800x3d and 9800x3d etc.
As someone who already owns a 7500x3d I personally don’t see a need to even upgrade to a 9800x3d for example. I mean yeah I’d get a little better fps but when they’re showing these paired up to a 5090 and running at 1080p, who’s doing that unless you are benchmarking or you are a professional gamer with money to burn and that’s all you’re doing all day every day? If you are an average person with say a 9070xt and you’ve got say a 7500x3d, I don’t see that when a 9800x3d is a meaningful upgrade. Really in those conditions even a normal 7700x is likely plenty.
In my case a 7500x3d is pretty close to a 7600x3d which I think is nipping at the heels of this 7700x3d. With the current prices on ram and ssds and given the price of what you can get a 7800x3d for, and rumors of zen 6 right around the corner with zen 7 in a year or so possibly being on am5, I think personally I’m going to just hold where I’m at. I personally have the 7500x3d with 32gb ddr5 and an rx 6950xt at 3440x1440. So in my case I think I’m waiting for next gen gpus and see if there are any that are interesting enough to jump to. After that I think I may hold to see if zen 7 will be am5 compatible and if so then at sooner point grab one of the better x3d cpus from zen 7 and I’ll be set for another 2-3 years or more.
Seems like with the 7800x3d at the price it is they need to lower prices on the 7700x3d. If they were selling for $259 or $275 then yeah they’d have a winner. But the 7700x3d feels proved too closely to the faster cpu. Honestly, I think the 5800x3d is in the neighborhood of the 7500/7600x3d. If you’re someone on am4 still with 32gb or 64gb of ram or higher and gaming is your thing, you might be better off to bite the bullet and pick up the 5800x3d and call it a day as opposed to going for a 7700x3d at least at this price when you factor in memory etc. -
-Fran- Reply
Why ignore the paragraph where I explain the reasoning? It's ok to disagree with it, but don't omit it?vinay2070 said:Maybe they were not clocking as good as a 7800X3D and AMD still wanted to sell them? So they waited till they had enough of them and then started selling?
Why sell later though, there would be 9700X3D piling up which AMD may want to sell later.
Weird habit for some...
Regards. -
Neilbob Reply
Well put. When looking at these reviews, it's very important for people to remember that, in the vast majority of cases, these margins will not be applicable for the sorts of GPUs they are very likely to possess. I understand perfectly why the reviews are conducted this way, but they don't help at all to reflect a realistic setup or use case except for a token few.ohio_buckeye said:Good summary
Also applies to the 5800X3D, which I hope to one day acquire at a hopefully slightly lower price, then a new GPU would follow after, but one most likely in the 9060/5060 tier on the (seemingly remote) chance that those prices become a bit less insane too (no splurging right now). That combination would tide me over for a very long time, and might even be the last system I own before I check out. -
vinay2070 Reply
I didnt have to, the dude above your original post already gave the reason - the market will correct it. My main point was 9700X3D has to be released at some point in time. There is no point in releasing both the 7700X3D and 9700X3D at the same time as they are both on AM5.-Fran- said:Why ignore the paragraph where I explain the reasoning? It's ok to disagree with it, but don't omit it?
Weird habit for some...
Regards. -
helper800 My problem with the 7700X3D is that its barely a stones throw away from the 270k plus in gaming performance, and anything not gaming the 270K plus meets and likely beats it into the ground. At least with the 7800X3D there is a much higher performance uplift from the 270k plus, so its more understanding in the same price range. Add into that the much better for cost z890 motherboards, and I do not see this competing well until about 260 dollars.Reply -
usertests Phoronix got my attention:Reply
AMD Ryzen 7 7700X3D Linux PerformanceOn a geo mean basis, the AMD Ryzen 7 7700X3D was running at 97.8% the performance of the Ryzen 7 7800X3D. But its CPU power on average was at 89% that of the 7800X3D. Or on a cost basis, the Ryzen 7 7700X3D at $329 is about 78% the cost of the Ryzen 7 7800X3D cost today at around $419.
You can often get the 7800X3D much cheaper than that, but in general, you are getting much of the performance with a decent reduction in power.
If the 7700X3D needs to become cheaper to diverge from the 7800X3D, it actually can and will. Since it's not a GPU with expensive memory inside.