Fractal Design Edison M Series 750W Power Supply Review
Why you can trust Tom's Hardware
Ripple Measurements
Ripple Measurements
To learn how we measure ripple, please click here.
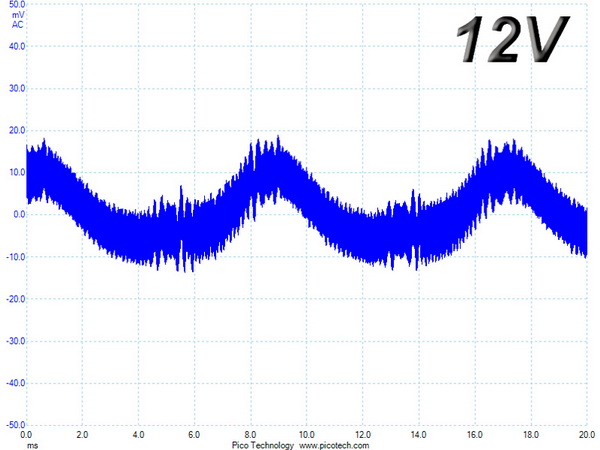
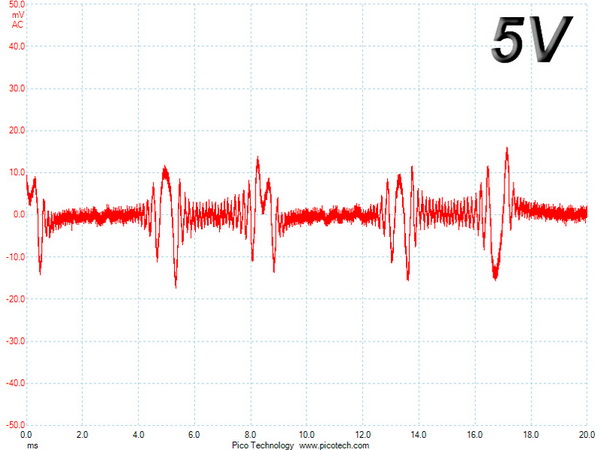
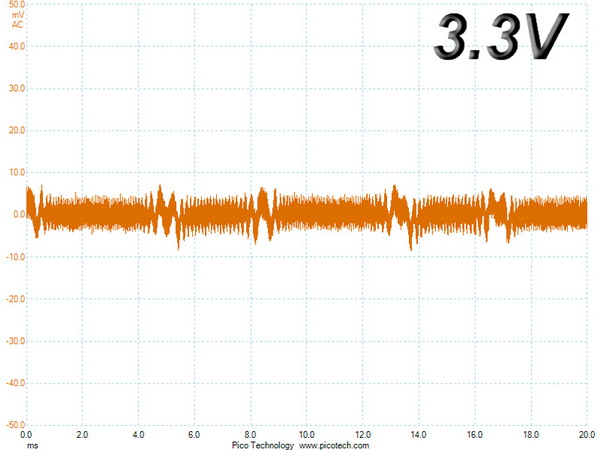
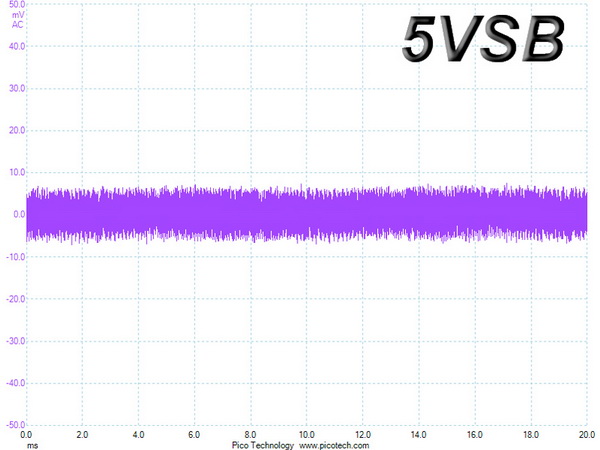
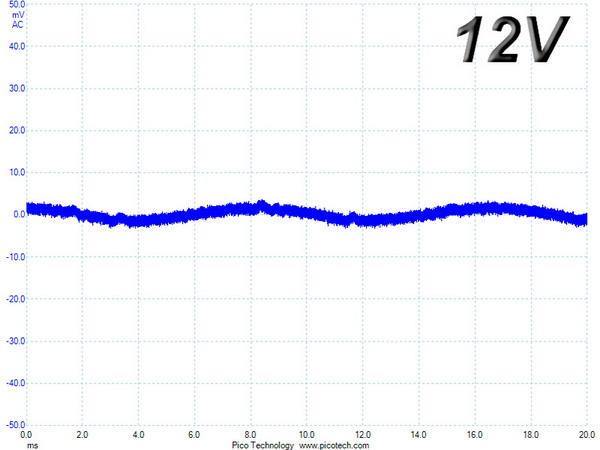
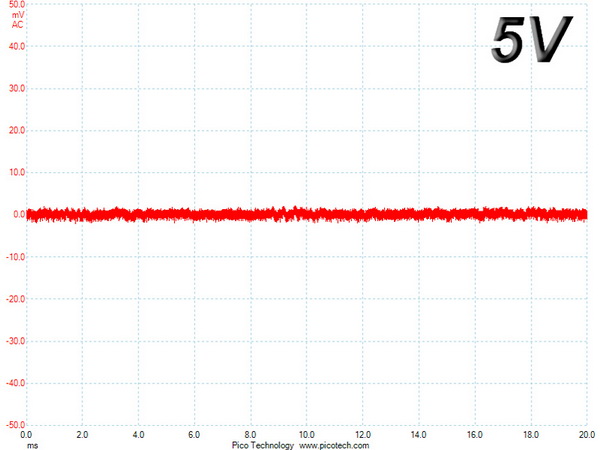
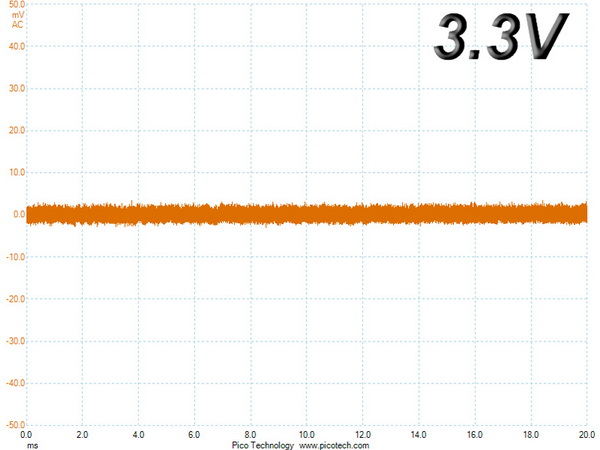
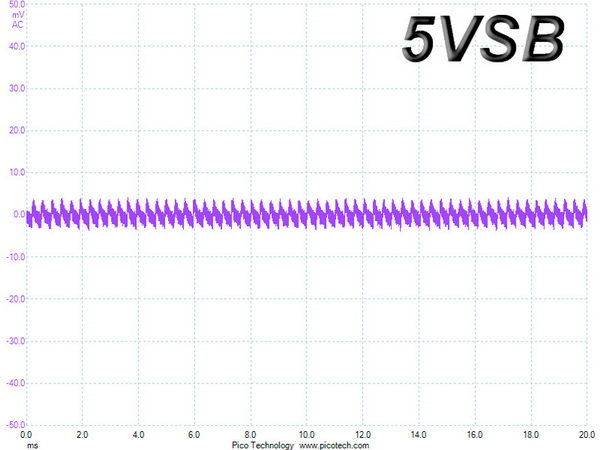
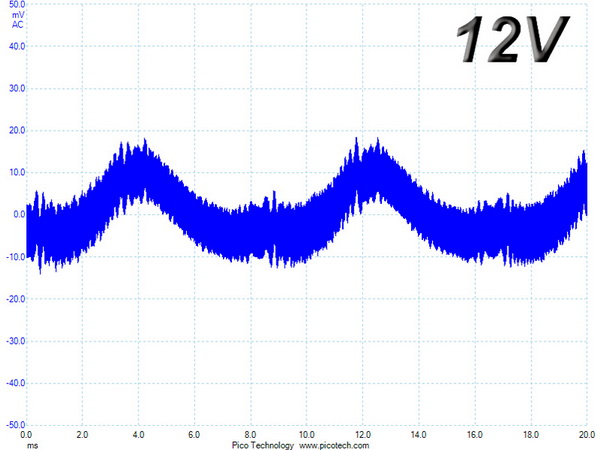
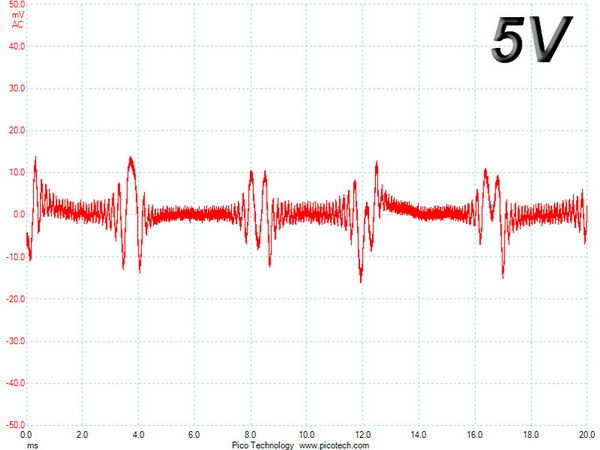
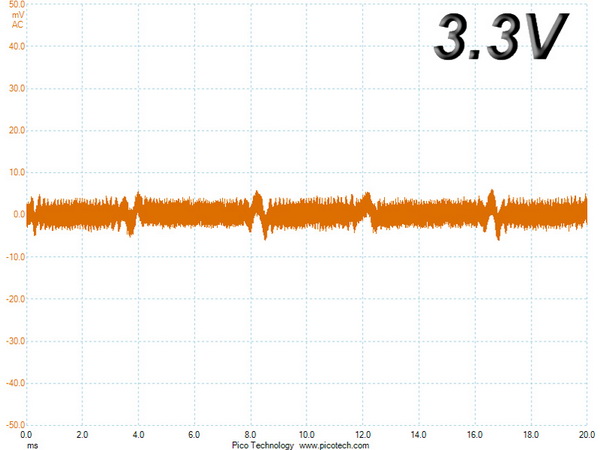
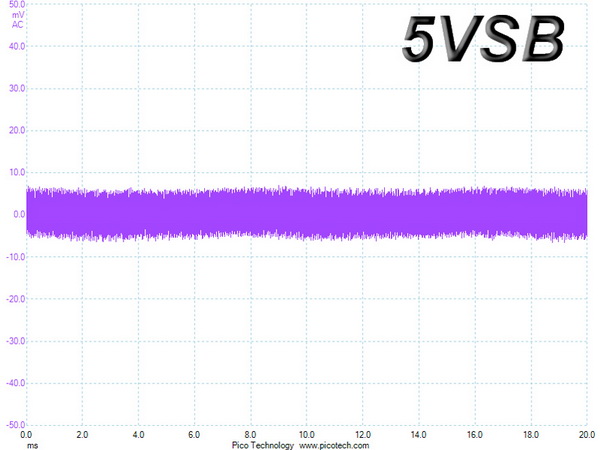
The following table includes the ripple levels we measured on the Edison M 750's rails. The limits are, according to the ATX specifications, 120mV (+12V) and 50mV (5V, 3.3V and 5VSB).
| Test | 12V (mV) | 5V (mV) | 3.3V (mV) | 5VSB (mV) | Pass/Fail |
|---|---|---|---|---|---|
| 10% Load | 6.4 | 5 | 6.3 | 5.4 | Pass |
| 20% Load | 8.8 | 4.2 | 6.4 | 6.6 | Pass |
| 30% Load | 10.8 | 5 | 6.7 | 7.6 | Pass |
| 40% Load | 13.2 | 5 | 9.6 | 8.2 | Pass |
| 50% Load | 15 | 5.6 | 10 | 9.4 | Pass |
| 60% Load | 19.1 | 5.5 | 12.3 | 10.2 | Pass |
| 70% Load | 22.5 | 11.8 | 12.7 | 11.8 | Pass |
| 80% Load | 25.7 | 35.8 | 14.2 | 12.4 | Pass |
| 90% Load | 29.9 | 34.9 | 17 | 13.9 | Pass |
| 100% Load | 34.6 | 37.6 | 19.1 | 15.2 | Pass |
| 110% Load | 40.1 | 40.7 | 19.3 | 16.2 | Pass |
| Crossload 1 | 7.7 | 5.4 | 7.4 | 11.1 | Pass |
| Crossload 2 | 33.1 | 34 | 14.2 | 14 | Pass |
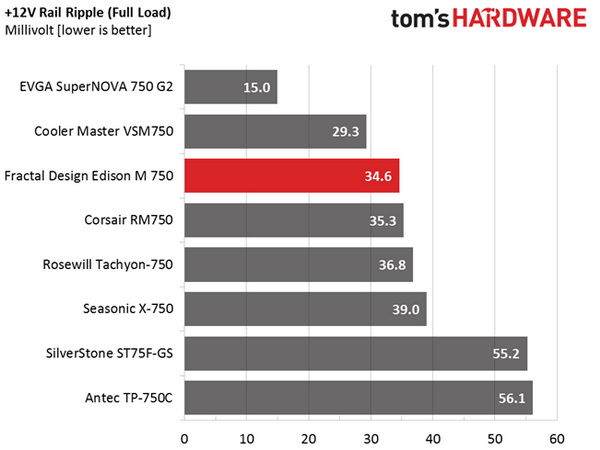
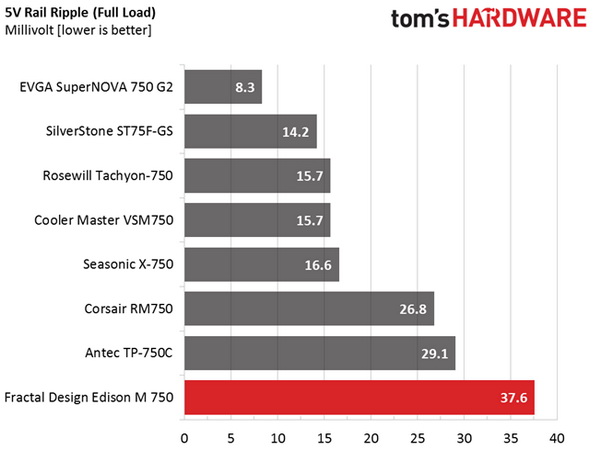
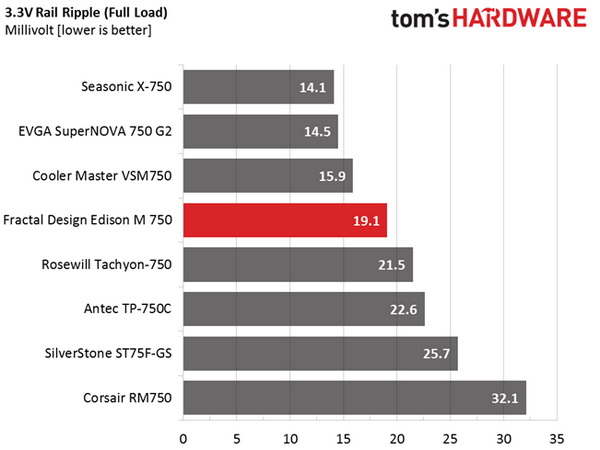
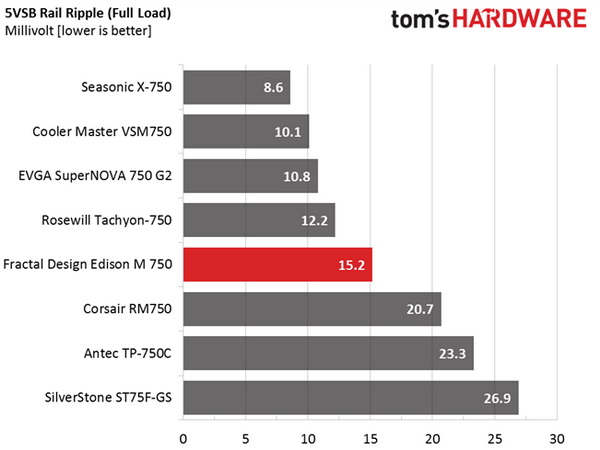
Ripple suppression on all rails (except for 5V) is very good overall. On the 5V rail, we noticed a sudden increase in ripple with 80-percent load and up. Incidentally, this was also the case with the Edison M 650W that we tested previously. We would advise Seasonic to look at the DC-DC converter that generates the 5V rail to find the source of this sudden increase at higher loads. It might not be a serious problem that could affect your system’s stability, since ripple on this rail is still lower than the ATX limit. But it's still a shame to see performance loss over this matter.
Ripple Oscilloscope Screenshots
The following oscilloscope screenshots illustrate the AC ripple and noise registered on the main rails (+12V, 5V, 3.3V and 5VSB). The bigger the fluctuations on the screen, the bigger the ripple/noise. We set 0.01V/Div (each vertical division/box equals 0.01V) as the standard for all measurements.
Ripple At Full Load
Ripple At 110-Percent Load
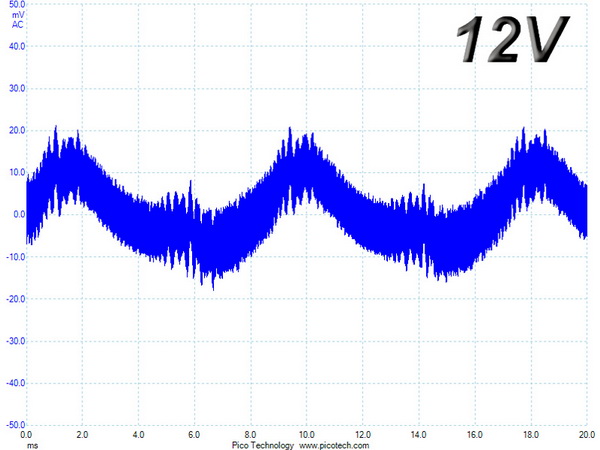
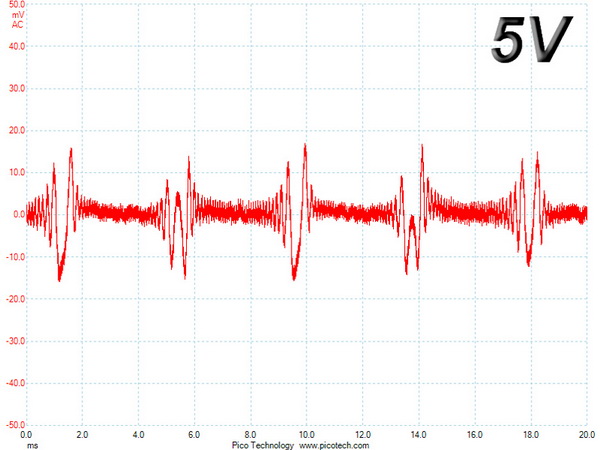
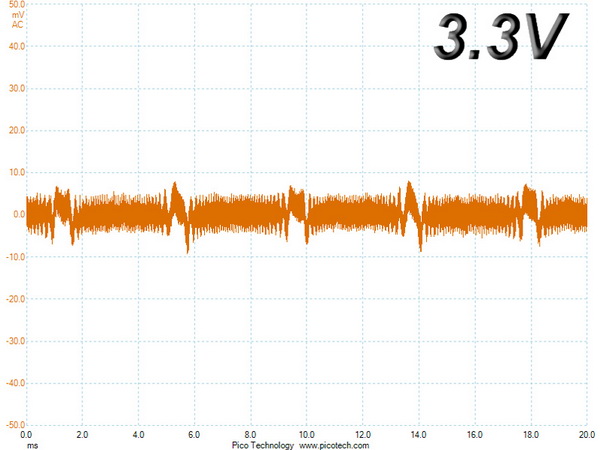
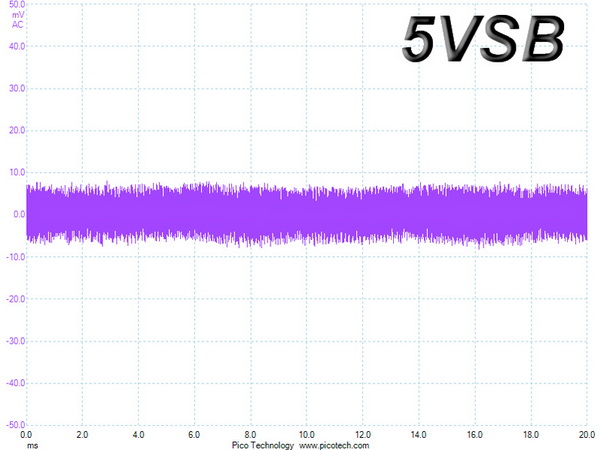
Ripple At Cross-Load 1
Ripple At Cross-Load 2
Get Tom's Hardware's best news and in-depth reviews, straight to your inbox.
Current page: Ripple Measurements
Prev Page Transient Response Tests Next Page Performance, Performance Per Dollar And Noise Ratings
Aris Mpitziopoulos is a contributing editor at Tom's Hardware, covering PSUs.
-
maxwellmelon there are several issues with there testing. first power good signal is not a good base for testing as its simple to "Cheat" the 16ms hold up.how about actually watching power good vs output voltages also. also the thermal camera scall changes every time how about using a fix scale as modifying scales leads to making things show hot that are not really that hot.Reply -
Aris_Mp First of all I measure AC loss to PWR_OK hold-up time since it is much easier to show it in my graphs and explain it. For me it is as easy to measure "AC loss to PWR_OK hold-up time" plus "PWR_OK inactive to DC loss delay" but I prefer it the way I do it.Reply
Also where do you base this? That the PG signal is simple to cheat and the manufacturers actually do this? From the moment the mainboards take seriously into account PG if this was the case then most likely there would be huge problems with lots of them. According to the ATX spec PG is de-asserted to a low state when any of the main rails falls out of 5% v. reg. Simply as that.
It just gives room for 1 ms till the PG signal sees the change at least in the ATX spec.
As for the thermal camera how it can show things hotter than it is? The scale is for this reason and from the moment the camera sees something from a different angle and a different region the scale is changing automatically. Nothing I can do about it. This is why I provide also actual temperature readings on all IR images.
-
PaulBags A quick opinion on the edison vs similar range seasonic own brand would be nice. Is it a new design, or an exact rebrand of a seasonic design? Quality of components vs?Reply -
Aris_Mp This is based on the same platform with the Seasonic G series and I state this in the "look inside" page. I haven't tested the G750 so far but I believe that since they are based on the same platform performance will be similar. Seasonic might used Enesol polymer caps (something that they usually do in their G units) instead of Chemi-Cons that Fractal chose, but both cap brands are very good so don't expect to see any real performance difference on them (although I prefer Chemi-Cons).Reply
So the design is nothing new and this is a Seasonic rebrand with minor differences at the internals (most likely the caps selection as I stated above). -
Aris_Mp Forgot to mention that besides caps the cooling fan is also different since on all Seasonic G units that I have tested so far have an ADDA double-ball bearing fan while the Edison PSU uses an FDB fan. However lately I noticed that many Seasonic units use Hong Hua FDB fans instead of ADDA double-ball bearing ones, so it is possible that this change might have affected the new bunches of G units.Reply -
Sakkura You say that you'd prefer if the unit was fully modular, but I don't really see the point.Reply
The fixed cables are the ones that will always be in use for any system using a 750W power supply, so the ability to disconnect those cables would not be beneficial. In fact it would lead to higher cost and also an extra point of failure and a slight loss of efficiency since a connector can never quite match an uninterrupted cable. -
Aris_Mp fully modular cables provide easier installation and cable management. Also you can easily change them with longer/shorter ones if you like or replace them in case there is a problem with them or simply you want something fancier.Reply
Loss of efficiency isn't a reason any more, on the contrary with bus bars or thick cables transferring power to the modular PCB energy losses can be minimized. In addition no cables block the secondary side caps, something that besides increasing their lifetime also allows for more relaxed fan profiles and better airflow inside the chassis.
Also the cost of a semi-modular to fully modular isn't high and in a 750 W PSU that costs 140 bucks already the cost reason doesn't stand (for fully modular design). -
Sakkura Reply
No they don't. The connector on the power supply end adds complexity and reduces cable flexibility.15924995 said:fully modular cables provide easier installation and cable management. Also you can easily change them with longer/shorter ones if you like or replace them in case there is a problem with them or simply you want something fancier.
You cannot easily change them because other cables are often incompatible - there is no common standard for modular PSU cables. Using incompatible cables can be downright dangerous. Here is a cautionary tale. -
Aris_Mp I didn't say that you can change them with anything, did I? Also it is common sense that every manufacturer uses their one design on modular cables. Thing is that with modular PSUs you can get an extra cable kit since most manufacturers sell one for their PSUs (e.g. Corsair, EVGA).Reply
Also I still cannot understand how the connector on the PSU end adds complexity and reduces cable flexibility! Cable flexibility depends on the gauges' thickness and not on the cables modularity design (or not).
Anyway I believe I made my opinion clear on why I prefer fully-modular PSUs.