System Builder Marathon Q3 2015: Gaming PC
This quarter, each participant can build whatever they want using the same $800 budget. Can I improve upon the gaming build of two quarters' past?
Final Word
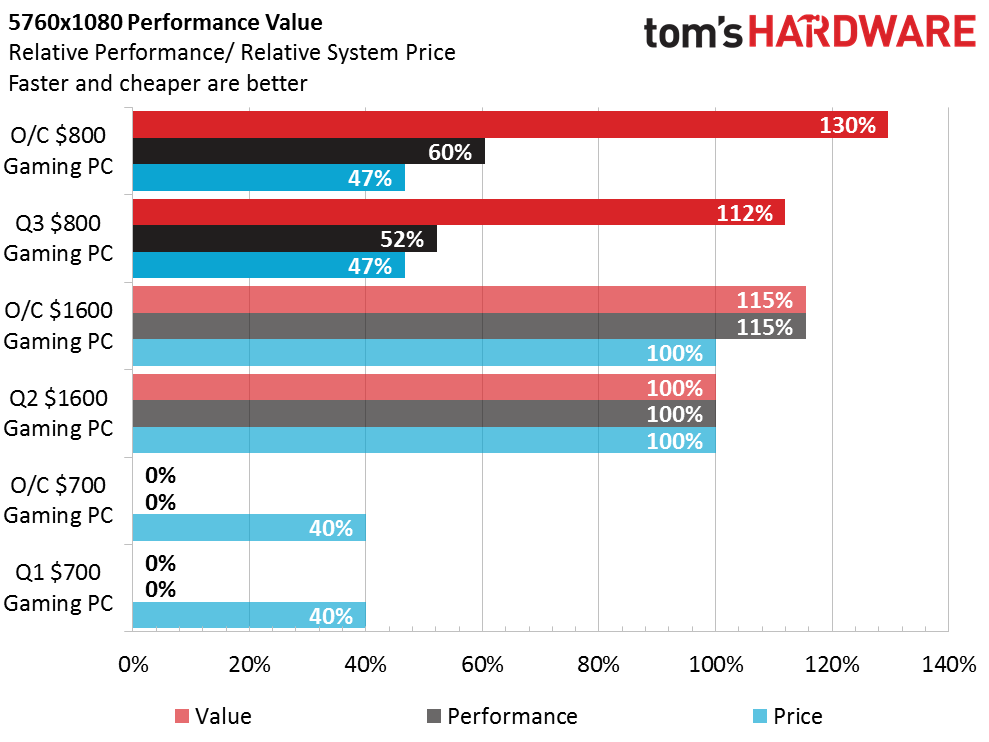
With 75 percent the performance of the $1,600 gaming PC at 50 percent of the cost, this quarter's budget build beats both of the other builds in value across all three of the major performance-per-dollar metrics. Normally, due to the frame-rate limitations in Battlefield 4 and other factors, we would defer to using the performance-per-dollar ratio of our highest-tested resolution for gaming, as it better represents the value of the higher performance configurations. However, since none of the builds share the same maximum resolution, it becomes more difficult to make that last comparison.
Although it lacks the top performance of the $1,600 build, this quarter's overclocked build still manages to come out on top value-wise, due to only costing half as much. As I briefly alluded to earlier, the Q1 build lacks statistics on value and performance in our last chart because it was never tested at the same 5760 x 1080 resolution as the others. Even though it's not the best at anything performance-wise, overall this quarter's build turned out to be a success.
MORE: Latest Systems NewsMORE: Systems in the Forums
Chris Miconi is an Associate Contributing Writer for Tom's Hardware covering Cases.
Follow Tom's Hardware on Twitter, Facebook and Google+.
Get Tom's Hardware's best news and in-depth reviews, straight to your inbox.
-
envy14tpe For gaming and for $800, this is an excellent build. As we saw in the AMD build, the 860k can limit in some games, and going i3 is a pure solid choice. Also, a 380 will max out most games at 1080p. Great choices and to hell with the whiners.Reply -
RedJaron While many H81, 87, 97, and B85 boards support unofficial overclocking, they're primarily limited to just CPU multiplier and voltage. Only Z boards let you fiddle with the BCLK to take the locked i3 any higher. The ASRock Z97M Pro4 might have been an alternative if you put the TX3 money toward it. However, you are right that a few hundred MHz more don't make a big difference in most daily computing.Reply
Also, your particular board may "technically" support CFX, but that bottom slot is only PCIe 2.0 x4 and will severely handicap any second GPU you add.
But still a good, efficient build nonetheless. Your build will definitely cream mine in the productivity benchmarks come Wednesday. -
Bossyfins The main reason the EVGA 500w get a lot of hate by users, including me, is because XFX makes a higher quality, made by seasonic to be exact, for about 10-15$ more. I would, and probably many others would choose to pay an extra mere 15$ than have a potential burn out of all components. Other than the PSU, solid part selections.Reply -
Tomtompiper Is it just me or is the System Builder Marathon Q3 2015: AMD Mini PC faster than this in most games? This would fit in with the "save on the processor and go big on the GPU philosophy. Also I believe it is time to throw in a multitasking benchmark, seldom do I encode or game an leave the machine running that one task, I'm gaming while streaming videos or encoding while surfing the web or streaming videos or both.Reply -
kinney This is good. I do love that i3 and 380 combo. Until AMD shows a rebound in their business though, I'd probably avoid them to reduce chances of ending up with unsupported product. A 970 would be ideal.Reply
A 380 or 970 is pretty much all most of us really need. The PC market is mature and has been for some time, spending on top end hardware doesn't make sense any longer. I'm waiting for KabyLake which should have enough graphics performance for my MOBA and other competitive gaming needs. Unless you're looking at buying into VR in which case a PS4+Morpheus needs to be considered. -
M515k4 This is the way I build gaming PCs for friends. Agreed with HDD vs SDD part. I would only use some smaller case.Reply -
ykki ReplyFor gaming and for $800, this is an excellent build. As we saw in the AMD build, the 860k can limit in some games, and going i3 is a pure solid choice.
Though in the AMD build you can get a cpu cooler later down the road and OC the 860k. -
filippi Reply16696672 said:For gaming and for $800, this is an excellent build. As we saw in the AMD build, the 860k can limit in some games, and going i3 is a pure solid choice.
Though in the AMD build you can get a cpu cooler later down the road and OC the 860k.
This for me is the Intel main advantage: FM2 upgrade path is a 3rd party cpu cooler + overclock.
Haswell upgrade path is an i5/i7/xeon. -
Math Geek i would love to see the amd build from yesterday overclocked just for the academics of it. give it away as is but since you don't normally have such a system in the comparisons, why not cool it right and oc it just to see how it does with the 970.Reply
again just for the academics of it more than anything. just curious how it would hold up to this i3 build.
but overall nice build, i even don't mind the evga psu. it's not as bad as folks want it ot be. it has reviewed very well and is solid for it's proper uses. though i am not so sure about it being capable of a second 380. i'd go with a bit better psu for that.
