Our CPU benchmark hierarchy provides a broad view of relative performance for the latest Intel and AMD processors. Over the last 30 years, Tom’s Hardware has been benchmarking CPUs, and we use the rankings here as the basis of our best CPUs for gaming and best budget CPU rankings. We run over 200 individual tests for each CPU we look at, and that comprehensive performance is condensed here for a high-level view of how CPUs compare across gaming, single-threaded, and multithreaded performance.
Each of our CPU benchmarks helps expose different aspects of performance, from heavily-threaded code compilation and data science workloads to lightly-threaded web apps and audio encoding. We’re currently in the process of the biggest refresh to our CPU benchmarks hierarchy ever, spanning over a decade of processor releases. The results here provide the first half of that testing, focusing on DDR5 platforms that span the AMD vs Intel product lineups. As we fill out our legacy benchmarks, you’ll see more CPUs added to our rankings. If you want to check the performance of older CPUs now, you can use the second page of this article to see our legacy benchmarks.
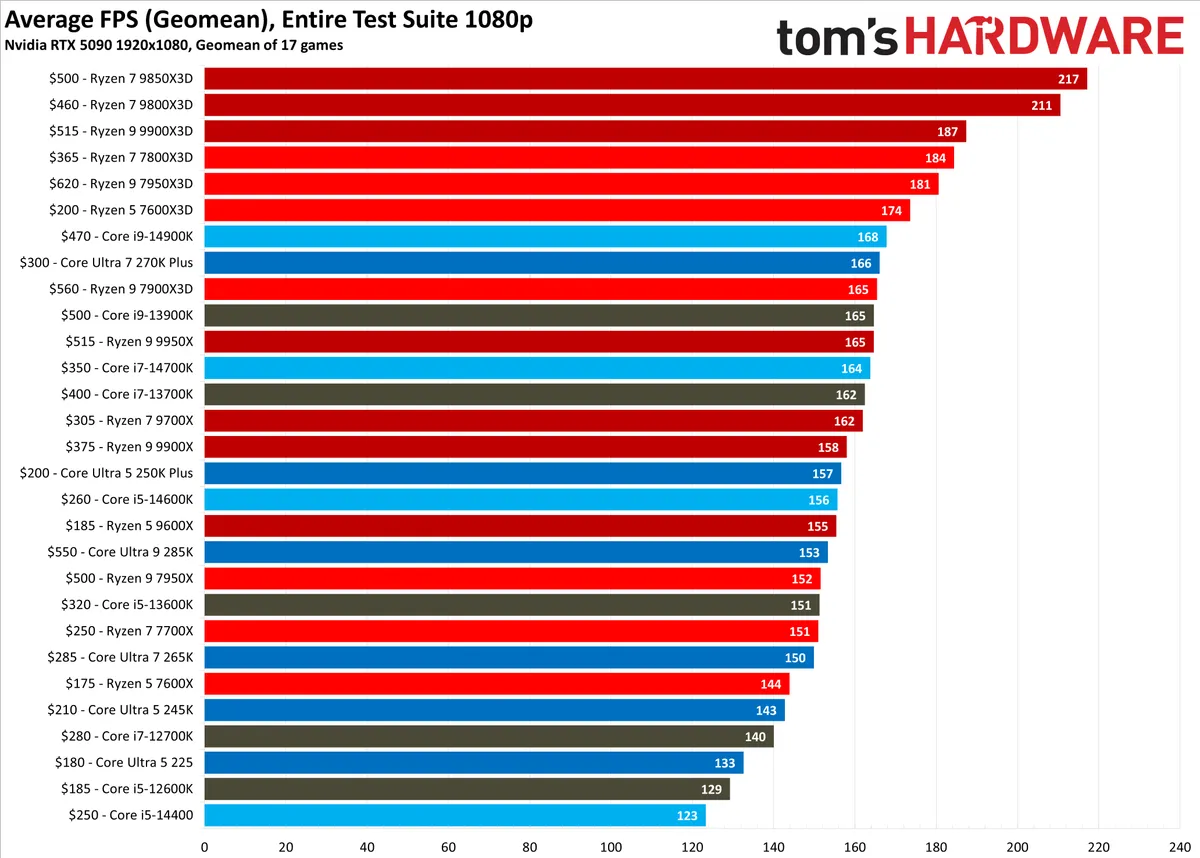
In games, AMD’s Ryzen 7 9850X3D is the fastest CPU on the market, though other Zen 5 X3D offerings like the Ryzen 9 9950X3D and Ryzen 7 9800X3D aren’t far behind. X3D chips dominate the charts for gaming at 1080p, with the other exception being the relatively unpopular (and expensive) Ryzen 9 7900X3D. Otherwise, Intel’s last-gen Core i9-14900K is the fastest offering from Team Blue, with the new Core Ultra 7 270K Plus coming in slightly behind with Intel’s new iBOT feature.
Intel pulls out strong positions in applications; however, with the Core Ultra 7 270K Plus topping the charts in single-threaded performance and coming in third in multi-threaded rankings. It’s only beaten by the Ryzen 9 9950X and its X3D variant, and only by a hair. Further, both of those CPUs cost about twice as much. AMD's recent Ryzen 9 9950X3D2 claims the top slot in overall performance, but at $900, it's too expensive for most buyers.
In each section below, we’ll show you the rankings for each CPU, as well as reveal what tests went into creating the rankings. We’ll also give you some pointers for benchmarking your own CPU to see how much performance an upgrade or overclock netted you, along with some common, easy-to-run benchmarks you can perform yourself.
CPU Benchmarks Rankings 2026
In the album above, you can see our master charts for gaming, single-threaded, and multi-threaded performance for CPUs. For games, all of our testing was done with an Nvidia RTX 5090 FE, and for applications, our testing was done with an Nvidia RTX 2080 Ti FE. For applications, no compute is actively running on the GPU; it’s a glorified display output that shares a driver with our gaming GPU. You can find a full breakdown of the test benches we used at the end of this article.
Gaming CPU Benchmarks Rankings 2026
CPU / (MSRP) | Street Price | 1080p Gaming Score | Architecture | Cores/Threads (P+E) | Base/Boost Clock (GHz) | TDP / Maximum Power |
Ryzen 7 9850X3D ($500) | 100% | Zen 5 X3D | 8 / 16 | 4.7 / 5.6 | 120W / 162W | |
Ryzen 7 9800X3D ($480) | 97% | Zen 5 X3D | 8 / 16 | 4.7 / 5.2 | 120W / 162W | |
Ryzen 9 9950X3D ($700) | 95.7% | Zen 5 X3D | 16 / 32 | 4.3 / 5.7 | 170W / 230W | |
Ryzen 9 9900X3D ($600) | 86.9% | Zen 5 X3D | 12 / 24 | 4.4 / 5.5 | 120W / 230W | |
Ryzen 7 7800X3D ($450) | 85.6% | Zen 4 X3D | 8 / 16 | 4.2 / 5 | 120W / 162W | |
Ryzen 9 7950X3D ($700) | 83.9% | Zen 4 X3D | 16 / 32 | 4.2 / 5.7 | 120W / 162W | |
Ryzen 5 7600X3D ($300) | 80.6% | Zen 4 X3D | 6 / 12 | 4.1 / 4.7 | 65W / 88W | |
Core i9-14900K ($550) | 78.2% | Raptor Lake Refresh | 24 / 32 (8+16) | 3.2 / 6 | 125W / 253W | |
Core Ultra 7 270K Plus ($300) | 77.5% | Arrow Lake Refresh | 24 / 24 (8+16) | 3.7 / 5.5 | 125W / 250W | |
Ryzen 7 7900X3D ($600) | Out of Stock | 77.1% | Zen 4 X3D | 12 / 24 | 4.4 / 5.6 | 120W / 162W |
Ryzen 9 9950X ($650) | 76.9% | Zen 5 | 16 / 32 | 4.7 / 5/7 | 170W / 230W | |
Core i9-13900K ($590) | Out of Stock | 76.8% | Raptor Lake | 24 / 32 (8+16) | 3 / 5.8 | 125W / 253W |
Core i7-14700K ($410) | 76.4% | Raptor Lake Refresh | 20 / 28 (8+12) | 3.4 / 5.6 | 125W / 253W | |
Core i7-13700K ($410) | Out of Stock | 75.8% | Raptor Lake | 16 / 24 (8+8) | 3.4 / 5.4 | 125W / 253W |
Ryzen 9 9900X ($500) | 73.9% | Zen 5 | 12 / 24 | 4.4 / 5.6 | 120W / 162W | |
Core Ultra 5 250K Plus ($200) | 73.3% | Arrow Lake Refresh | 18 / 18 (6+12) | 4.2 / 5.3 | 125W / 159W | |
Core i5-14600K ($320) | 72.8% | Raptor Lake Refresh | 14 / 20 (6+8) | 3.5 / 5.3 | 125W / 181W | |
Ryzen 5 9600X ($280) | 72.6% | Zen 5 | 6 / 12 | 3.9 / 5.4 | 65W / 88W | |
Core Ultra 9 285K ($590) | 71.8% | Arrow Lake | 24 / 24 (8+16) | 3.7 / 5.7 | 125W / 250W | |
Ryzen 9 7950X ($700) | Out of Stock | 71% | Zen 4 | 16 / 32 | 4.5 / 5.7 | 170W / 230W |
Core i5-13600K ($320) | 70.9% | Raptor Lake | 14 / 20 (6+8) | 3.5 / 5.1 | 125W / 181W | |
Ryzen 7 7700X ($400) | 70.6% | Zen 4 | 8 / 16 | 4.5 / 5.4 | 105W / 142W | |
Core Ultra 7 265K ($400) | 70.3% | Arrow Lake | 20 / 20 (8+12) | 3.9 / 5.5 | 125W / 250W | |
Ryzen 9 7900X ($550) | 69.2% | Zen 4 | 12 / 24 | 4.7 / 5.6 | 170W / 230W | |
Ryzen 5 7600X ($300) | 67.3% | Zen 4 | 6 / 12 | 4.7 / 5.3 | 105W / 142W | |
Core Ultra 5 245K ($320) | 67.1% | Arrow Lake | 14 / 14 (6+8) | 4.2 / 5.2 | 125W / 159W | |
Core i7-12700K ($410) | 65.8% | Alder Lake | 12 / 20 (8+4) | 3.6 / 5 | 125W / 190W | |
Core Ultra 5 225 ($183) | 62.5% | Arrow Lake | 10 / 10 (6+4) | 3.3 / 4.9 | 65W / 121W | |
Core i5-12600K ($290) | 60.8% | Alder Lake | 10 / 16 (6+4) | 3.7 / 4.9 | 125W / 150W | |
Core i5-14400 ($220) | 58% | Raptor Lake | 10 / 16 (6+4) | 2.5 / 4.7 | 65W / 154W |
You can see the relative score for AMD and Intel CPUs above, measured against the Ryzen 7 9850X3D, which is the fastest gaming CPU on the market, per our testing. So, the Ryzen 7 9800X3D offers 97.04% of the performance of the Ryzen 7 9850X3D, while the Ryzen 9 7900X offers 69.28% of the performance. You can set any CPU as a baseline for comparison with Bench, which is available in Tom’s Hardware Premium.
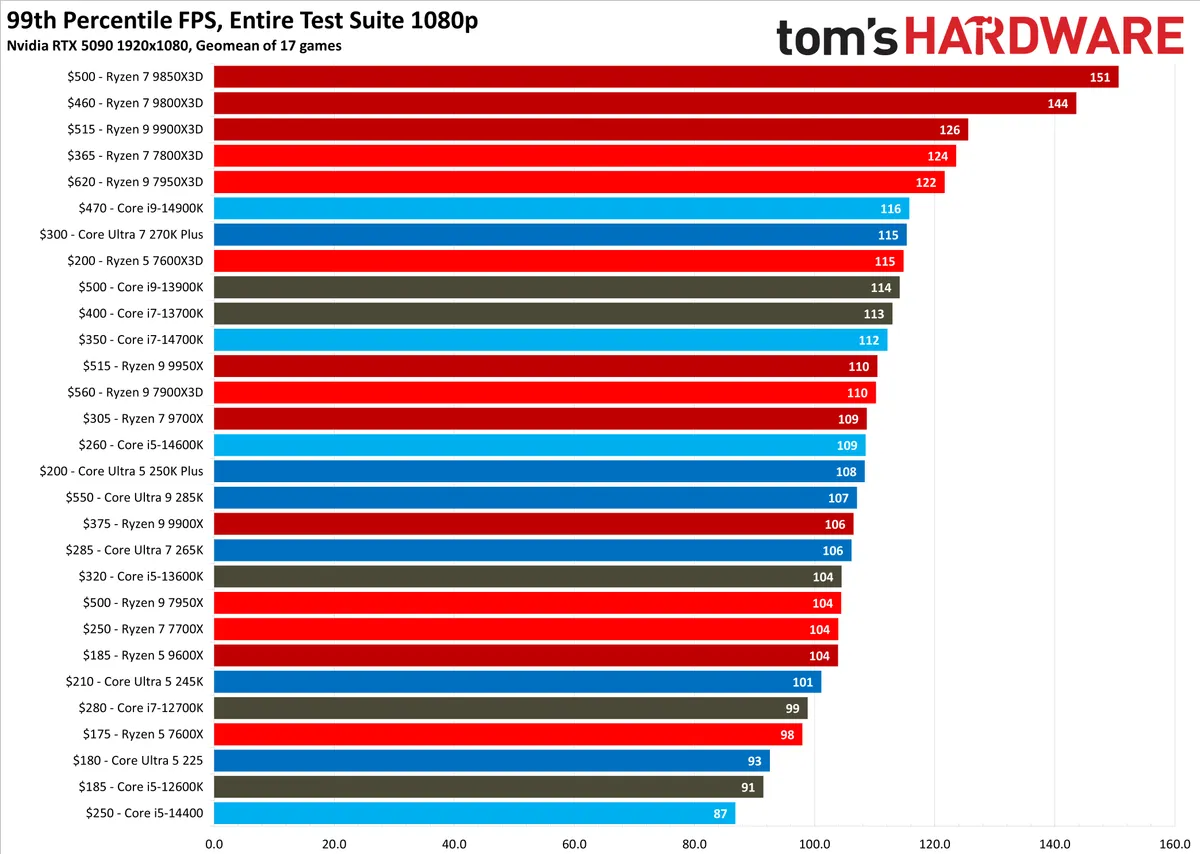
All of our gaming tests were run with the RTX 5090 FE at 1080p with a mixture of High and Ultra settings. We run each test multiple times — usually between three and five — and pick the median result. In other words, the results we use are real, recorded runs, not an average of several different runs. This is important as some games, such as Far Cry 6, show great CPU scaling but are otherwise inconsistent run-to-run.
In addition to consistent hardware (test benches at the end of this article), we use a consistent test image between platforms. That means the same GPU driver, the same Windows install, the game version, etc. We also tested with Virtualization-Based Security (VBS) turned off, Resizable BAR turned on, and automatic overclocking features disabled. That includes the Intel Extreme power profile and AMD’s PBO, both of which aren’t covered under standard warranty.
For this refresh, we tested 17 games and then calculated a geometric mean of the results. A simple average would provide skewed results with such a large test pool. A geomean provides a more realistic view of how each CPU compares to the others.
Here are the games that we used for testing:
- Counter-Strike 2
- The Last of Us Part One
- Cyberpunk 2077
- Starfield
- A Plague Tale: Requiem
- Hogwarts Legacy
- F1 24
- Marvel’s Spider-Man 2
- Baldur’s Gate 3
- Monster Hunter: Wilds
- Final Fantasy XIV
- Microsoft Flight Simulator 2024
- Doom: The Dark Ages
- Oblivion Remastered
- Far Cry 6
- Hitman 3
- Minecraft RTX
We’re constantly evaluating new games to include in our test suite — see our recent stories on Resident Evil Requiem CPU scaling and Crimson Desert CPU scaling — but we maintain a list of tried-and-true benchmarks for our hierarchy rankings. We want to avoid including brand-new titles, which may see many updates, to keep our rankings as true to reality as possible. If you want more about the rationale behind our game choices, see our behind the scenes look at our CPU hierarchy testing.
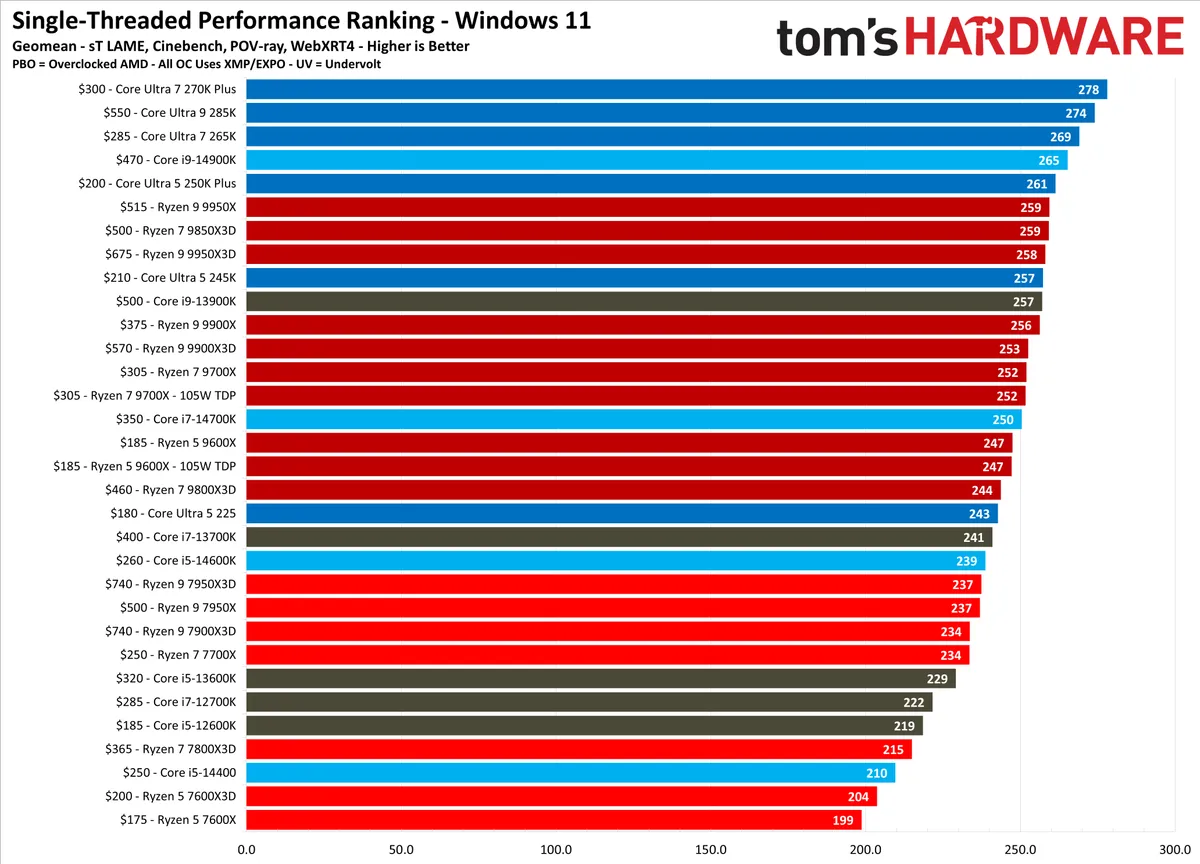
Single-Threaded CPU Benchmarks Rankings 2026
| Row 0 - Cell 0 | Single-Threaded App Score | Architecture | Cores/Threads (P+E) | Base/Boost Clock (GHz) | TDP / Maximum Power |
Core Ultra 7 270K Plus | 100% | Arrow Lake Refresh | 24 / 24 (8+16) | 3.7 / 5.5 | 125W / 250W |
Core Ultra 9 285K | 98.5% | Arrow Lake | 24 / 24 (8+16) | 3.7 / 5.7 | 125W / 250W |
Core Ultra 7 265K | 96.8% | Arrow Lake | 20 / 20 (8+12) | 3.9 / 5.5 | 125W / 250W |
Core i9-14900K | 95.4% | Raptor Lake Refresh | 24 / 32 (8+16) | 3.2 / 6 | 125W / 253W |
Core Ultra 5 250K Plus | 94% | Arrow Lake Refresh | 18 / 18 (6+12) | 4.2 / 5.3 | 125W / 159W |
Ryzen 9 9950X | 93.3% | Zen 5 | 16 / 32 | 4.7 / 5/7 | 170W / 230W |
Ryzen 7 9850X3D | 93.2% | Zen 5 X3D | 8 / 16 | 4.7 / 5.6 | 120W / 162W |
Ryzen 9 9950X3D | 92.8% | Zen 5 X3D | 16 / 32 | 4.3 / 5.7 | 170W / 230W |
Core Ultra 5 245K | 92.5% | Arrow Lake | 14 / 14 (6+8) | 4.2 / 5.2 | 125W / 159W |
Core i9-13900K | 92.4% | Raptor Lake | 24 / 32 (8+16) | 3 / 5.8 | 125W / 253W |
Ryzen 9 9900X | 92.2% | Zen 5 | 12 / 24 | 4.4 / 5.6 | 120W / 162W |
Ryzen 9 9900X3D | 90.8% | Zen 5 X3D | 12 / 24 | 4.4 / 5.5 | 120W / 230W |
Ryzen 9 9700X / 105W TDP | 90.6% / 90.5% | Zen 5 | 8 /16 | 3.8 / 5.5 | 65W / 88W |
Core i7-14700K | 90.1% | Raptor Lake Refresh | 20 / 28 (8+12) | 3.4 / 5.6 | 125W / 253W |
Ryzen 5 9600X / 105W TDP | 89% / 88.9% | Zen 5 | 6 / 12 | 3.9 / 5.4 | 65W / 88W |
Ryzen 7 9800X3D | 87.6% | Zen 5 X3D | 8 / 16 | 4.7 / 5.2 | 120W / 162W |
Core Ultra 5 225 | 87.3% | Arrow Lake | 10 / 10 (6+4) | 3.3 / 4.9 | 65W / 121W |
Core i7-13700K | 86.7% | Raptor Lake | 16 / 24 (8+8) | 3.4 / 5.4 | 125W / 253W |
Core i5-14600K | 85.8% | Raptor Lake Refresh | 14 / 20 (6+8) | 3.5 / 5.3 | 125W / 181W |
Ryzen 9 7950X3D | 85.4% | Zen 4 X3D | 16 / 32 | 4.2 / 5.7 | 120W / 162W |
Ryzen 9 7950X | 85.2% | Zen 4 | 16 / 32 | 4.5 / 5.7 | 170W / 230W |
Ryzen 9 7900X3D | 84% | Zen 4 X3D | 12 / 24 | 4.4 / 5.6 | 120W / 162W |
Ryzen 7 7700X | 84% | Zen 4 | 8 / 16 | 4.5 / 5.4 | 105W / 142W |
Core i5-13600K | 82.4% | Raptor Lake | 14 / 20 (6+8) | 3.5 / 5.1 | 125W / 181W |
Core i7-12700K | 79.7% | Alder Lake | 12 / 20 (8+4) | 3.6 / 5 | 125W / 190W |
Core i5-12600K | 78.6% | Alder Lake | 10 / 16 (6+4) | 3.7 / 4.9 | 125W / 150W |
Ryzen 7 7800X3D | 77.3% | Zen 4 X3D | 8 / 16 | 4.2 / 5 | 120W / 162W |
Core i5-14400 | 75.4% | Raptor Lake | 10 / 16 (6+4) | 2.5 / 4.7 | 65W / 154W |
Ryzen 5 7600X3D | 73.2% | Zen 4 X3D | 6 / 12 | 4.1 / 4.7 | 65W / 88W |
Ryzen 5 7600X | 71.5% | Zen 4 | 6 / 12 | 4.7 / 5.3 | 105W / 142W |
We run hundreds of tests for each CPU, but only a small subset of those tests factor into our single-threaded rankings. We use the mp3 encoder LAME with a single thread (both standard and extended), Cinebench 2026 and 2024’s single-threaded test, the ray-traced renderer POV-ray, and WebXRT4, which runs a series of browser-based applications written in various languages.
The fastest chip in the pool here is the Core Ultra 7 270K Plus, which scores 100%, with every other chip scored relative to it. The Core i9-14900K offers 95.4% of the single-threaded performance of the Core Ultra 7 270K Plus, the Ryzen 5 9600X offers 89% of the performance, and so on.
Most real-world workloads aren’t strictly single-threaded, which is why we include it on a subset of the total tests we run. The goal is to see what relative performance looks like in lightly-threaded applications, as well as look into the overall architecture of different CPUs. Single-threaded performance exposes a lot about the architecture in a way that heavily-threaded applications tend to mask.
We’re, of course, looking at performance on a single core, favoring high clock speeds and IPC (instructions per cycle). However, single-threaded performance also says a lot about what’s going on elsewhere inside the CPU, from the speed of the IMC (integrated memory controller) to the fabric/ring speed. That’s why we see things like the Core Ultra 7 270K Plus outperforming the Core Ultra 9 285K, despite the latter sporting higher clock speeds.
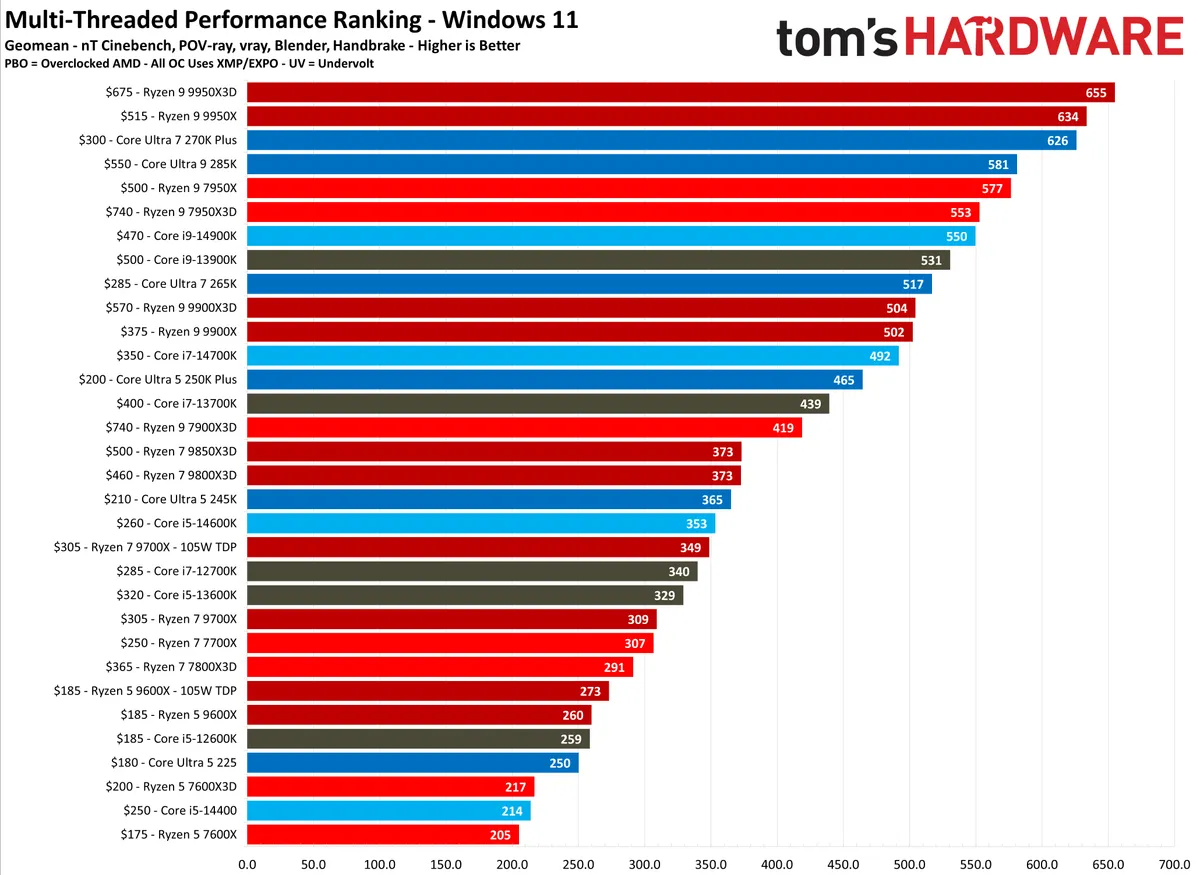
Multi-Threaded CPU Benchmarks Rankings 2026
| Row 0 - Cell 0 | Single-Threaded App Score | Architecture | Cores/Threads (P+E) | Base/Boost Clock (GHz) | TDP / Maximum Power |
Ryzen 9 9950X3D | 100% | Zen 5 X3D | 16 / 32 | 4.3 / 5.7 | 170W / 230W |
Ryzen 9 9950X | 96.8% | Zen 5 | 16 / 32 | 4.7 / 5/7 | 170W / 230W |
Core Ultra 7 270K Plus | 95.6% | Arrow Lake Refresh | 24 / 24 (8+16) | 3.7 / 5.5 | 125W / 250W |
Core Ultra 9 285K | 88.7% | Arrow Lake | 24 / 24 (8+16) | 3.7 / 5.7 | 125W / 250W |
Ryzen 9 7950X | 88% | Zen 4 | 16 / 32 | 4.5 / 5.7 | 170W / 230W |
Ryzen 9 7950X3D | 84.4% | Zen 4 X3D | 16 / 32 | 4.2 / 5.7 | 120W / 162W |
Core i9-14900K | 83.9% | Raptor Lake Refresh | 24 / 32 (8+16) | 3.2 / 6 | 125W / 253W |
Core i9-13900K | 81% | Raptor Lake | 24 / 32 (8+16) | 3 / 5.8 | 125W / 253W |
Core Ultra 7 265K | 78.9% | Arrow Lake | 20 / 20 (8+12) | 3.9 / 5.5 | 125W / 250W |
Ryzen 9 9900X3D | 77% | Zen 5 X3D | 12 / 24 | 4.4 / 5.5 | 120W / 230W |
Ryzen 9 9900X | 76.7% | Zen 5 | 12 / 24 | 4.4 / 5.6 | 120W / 162W |
Core i7-14700K | 75.1% | Raptor Lake Refresh | 20 / 28 (8+12) | 3.4 / 5.6 | 125W / 253W |
Core Ultra 5 250K Plus | 70.9% | Arrow Lake Refresh | 18 / 18 (6+12) | 4.2 / 5.3 | 125W / 159W |
Core i7-13700K | 67.1% | Raptor Lake | 16 / 24 (8+8) | 3.4 / 5.4 | 125W / 253W |
Ryzen 9 7900X3D | 63.9% | Zen 4 X3D | 12 / 24 | 4.4 / 5.6 | 120W / 162W |
Ryzen 7 9850X3D | 57% | Zen 5 X3D | 8 / 16 | 4.7 / 5.6 | 120W / 162W |
Ryzen 7 9800X3D | 56.9% | Zen 5 X3D | 8 / 16 | 4.7 / 5.2 | 120W / 162W |
Core Ultra 5 245K | 55.8% | Arrow Lake | 14 / 14 (6+8) | 4.2 / 5.2 | 125W / 159W |
Core i5-14600K | 53.9% | Raptor Lake Refresh | 14 / 20 (6+8) | 3.5 / 5.3 | 125W / 181W |
Core i7-12700K | 51.9% | Alder Lake | 12 / 20 (8+4) | 3.6 / 5 | 125W / 190W |
Core i5-13600K | 50.3% | Raptor Lake | 14 / 20 (6+8) | 3.5 / 5.1 | 125W / 181W |
Ryzen 7 9700X / 105W TDP | 47.2% / 53.2% | Zen 5 | 8 /16 | 3.8 / 5.5 | 65W / 88W |
Ryzen 7 7700X | 46.8% | Zen 4 | 8 / 16 | 4.5 / 5.4 | 105W / 142W |
Ryzen 7 7800X3D | 44.5% | Zen 4 X3D | 8 / 16 | 4.2 / 5 | 120W / 162W |
Ryzen 5 9600X / 105W TDP | 39.7% / 41.7% | Zen 5 | 6 / 12 | 3.9 / 5.4 | 65W / 88W |
Core i5-12600K | 39.5% | Alder Lake | 10 / 16 (6+4) | 3.7 / 4.9 | 125W / 150W |
Core Ultra 5 225 | 38.5% | Arrow Lake | 10 / 10 (6+4) | 3.3 / 4.9 | 65W / 121W |
Ryzen 5 7600X3D | 33.1% | Zen 4 X3D | 6 / 12 | 4.1 / 4.7 | 65W / 88W |
Core i5-14400 | 32.7% | Raptor Lake | 10 / 16 (6+4) | 2.5 / 4.7 | 65W / 154W |
Ryzen 5 7600X | 31.3% | Zen 4 | 6 / 12 | 4.7 / 5.3 | 105W / 142W |
Similar to single-threaded rankings, we use a subset of the total tests we run for CPU reviews in ranking multithreaded performance. Cinebench and POV-ray show up here again, this time using as many threads as possible, alongside VRay, four Blender tests, and Handbrake using various codecs. Although most applications will leverage multiple threads these days, we’re specifically looking at applications that will take as many threads as possible to maximize compute.
Compared to single-threaded workloads, heavily-threaded tasks are less concerned with clock speed and put a greater emphasis on interconnects and core-to-core latency. Core count is obviously important, as well, though it’s been somewhat undermined by Intel’s hybrid architectures over the last several generations.
Given that we’re spanning multiple nodes, core count alone isn’t indicative of higher multithreaded performance. Yes, higher core counts within the same generation will usually provide higher multithreaded performance, but a slew of other factors can increase performance, as well, from all-core and uncore frequencies to higher transistor density. Because of the wide swath of factors, you can see much more aggressive scaling with our multithreaded rankings compared to single-threaded rankings.
Integrated GPU Gaming CPU Benchmarks Rankings 2026


| 1280x720 | 1920x1080 |
Ryzen 7 5700G B550-E | 100% | 100% |
Ryzen 5 5600G | 96.3% | 96% |
Ryzen 7 4750G | 92.9% | 94.1% |
Ryzen 3 5300G | 85.8% | 87.2% |
Ryzen 5 3400G | 83.5% | 84.1% |
Ryzen 3 3200G | 77.1% | 78.1% |
Intel UHD Graphics 750 32 EU (11600K, 11700K) | 58.3% | ~48.9% |
Intel UHD Graphics 730 24 EU (i5-11400) | 51.7% | 42.9% |
Intel UHD Graphics 630 24 EU (10600K) | 36.0% | 34.4% |
Here's our list of gaming performance with integrated graphics on several of the leading APUs available. We've split this into two different price ranges, so be sure to flip through all of the performance charts. For a bit of commentary and analysis of these results, head to our Ryzen 7 5700G, Ryzen 5 5600G, and Ryzen 3 5300G reviews. The most powerful chip gets a 100, and all others are scored relative to it.
How to Benchmark your CPU
It’s important to know how to benchmark your CPU. It gives you a way to compare performance after an overclock or a CPU upgrade, and it allows you to check if you’re getting the full performance out of your system. Maybe a poor CPU cooler mount is limiting your performance, or maybe your BIOS settings aren’t optimal. Using benchmarks to compare your results lets you see where your rig stacks up, not only for leaderboard purposes, but also basic troubleshooting.
The key to benchmarking your CPU is consistency. The only variable that should change is your CPU, be it a new CPU or an overclock/undervolt. Before starting, make sure to close any applications running in the background. That’s not only to net peak performance, but also to avoid any inconsistencies between runs. Background apps can gobble up threads inconsistently, making it difficult to compare your results from run to run.
If you want more consistency, you can optionally run the following command before benchmarking in an elevated command prompt:
Rundll32.exe advapi32.dll,ProcessIdleTasks
This will force Windows to perform the background tasks it normally does when your PC is idle. It’s not essential, but it’s a good sanity check to make sure there’s nothing interfering with your results.
For applications, you want to test the apps you actually use. If you use the Adobe suite, for example, you can download and use PugetBench for free and compare your results with Puget’s database. A lot of apps don’t have these easy-to-use benchmarking tools and databases, so you need to find a proxy. For instance, Procyon Office measures Microsoft Office performance, but a license costs nearly $1,600 per year. PCMark 10 Basic, which is free, measures open-source office applications. Below, we have some of our favorite free benchmarks for comparing CPU performance.
In games, you can take two approaches: manual or automated. Some modern games include built-in benchmarking tools, such as Cyberpunk 2077 and Doom: The Dark Ages, and although they aren’t perfect, they’re easy to run and highly repeatable. The best way to measure CPU gaming performance, however, is manual benchmarking.
That involves finding a scene where you can go over a specific path repeatedly. That could be starting from a specific checkpoint that you can reload or resorting to a manual save where you start from the exact same position. Regardless, it’s important to avoid randomness in your testing. Keep the path consistent — for example, a walking path through a town — and try not to swing the camera around.
For measuring performance in games, you’ll need a performance monitoring tool. There are simple apps like Nvidia’s FrameView, which logs a ton of information but is a little cumbersome to deal with; it exports data to spreadsheets. CapFrameX is a good alternative, which uses the same backend as FrameView (Intel’s PresentMon), but comes with a user-friendly GUI and extra features like the ability to generate charts right in the app.
After you run your benchmarks, you need a comparison point. Databases like Puget are your best resources on that front. If you’re comparing results to reviews, forum threads, or other systems, keep in mind the variables that can influence performance. It’s not a good idea to compare performance with uncontrolled variables unless you have a wide swath of comparison points.
Best CPU Benchmarks You Can Run
- Cinebench 2026 – Cinebench is the quintessential CPU benchmark, used almost universally in reviews, and it’s completely free to download and use.
- Geekbench 6 – Geekbench has a number of issues, but it offers a massive database for comparing your system against other similar systems. And it’s free to download and run.
- Blender – Blender has a benchmarking utility with a GUI that’s free to download, as well as a large database of results.
- PCMark 10 Basic – The main PCMark 10 benchmark is free to use with the Basic edition, allowing you to test productivity performance with open-source office apps, as well as compare your scores with UL’s database.
- Handbrake – Handbrake is a powerful, free, and open-source video transcoding tool, and it’s easy to run benchmarks with. Use any video file, make sure your settings are the same, and start a stopwatch to measure the time encoding takes. Lower is better.
- WebXPRT 5 – WebXPRT runs a variety of web applications directly in your browser, for free, and with a database to compare results to. It takes a while to run, however.
- JetStream 2 – JetStream is a faster browser-based benchmark, though it doesn’t have a database of results.
- CPU-Z – CPU-Z isn’t a reliable benchmark for real-world performance, but it includes single- and multithreaded tests, it’s easy to run, and you’ll find results online almost as commonly as Cinebench results.
- Y-cruncher – This test calculates Pi with digit extraction, and it’s accelerated with SIMD instructions like AVX. You can only run it from a command line, but it’s relatively straightforward.
- PugetBench – Puget includes benchmarks for the biggest apps in the Adobe suite, as well as DaVinci Resolve. The benchmark itself is free, and Puget maintains a large database. You’ll need a license for the applications it tests, however.
2026 CPU Benchmarks Test System and Configuration
Intel LGA 1851 (Arrow Lake and Refresh) | Row 0 - Cell 1 |
Motherboard | |
RAM | |
Intel LGA 1700 (Raptor Lake, Alder Lake) | Row 3 - Cell 1 |
Motherboard | |
RAM | |
AMD AM5 (Zen 5, Zen 4) | Row 6 - Cell 1 |
Motherboard | MSI MPG X870E Carbon Wi-Fi, Gigabyte Aorus X870E Elite X3D ICE |
RAM | |
All Systems | Row 9 - Cell 1 |
Gaming CPU | Nvidia GeForce RTX 5090 Founder’s Edition |
Application GPU | Nvidia GeForce RTX 2080 Ti Founder’s Edition |
Cooler | Corsair iCue Link H150i RGB |
Storage | 2TB Sabrent Rocket 4 Plus |
PSU | |
Other | Arctic MX-4 TIM, Windows 11 Pro, Alamengda open test bench |
- AMD Ryzen 7 7800X3D vs Intel Core i9-13900K vs Core i7-13700K: Big Gaming Punch, Smaller Price Tag
- AMD Ryzen 9 7950X3D vs Intel Core i9-13900K Faceoff: Battle of the Gaming Flagships
- Intel Core i5-13600K vs AMD Ryzen 7 7700X and Ryzen 5 7600X Face Off
- AMD Ryzen 9 7950X vs Intel Core i9-13900K Face Off
- Ryzen 7 5800X3D vs Core i7-12700K and Core i9-12900K Face-Off: The Rise of 3D V-Cache
- Intel Core i9-12900K vs Ryzen 9 5900X and 5950X: Alder Lake and Ryzen 5000 Face Off
- Intel Core i5-12600K vs AMD Ryzen 5 5600X and 5800X Face Off: Ryzen Has Fallen
- Intel Core i7-12700K vs AMD Ryzen 9 5900X and 5800X Face Off: Intel Rising
- Intel Core i5-12400 vs AMD Ryzen 5 5600X Face-Off: The Gaming Value Showdown
- MORE: Best CPUs for Gaming
- MORE: AMD vs Intel
- MORE: 13th-Gen Raptor Lake All We Know
- MORE: Zen 4 Ryzen 7000 All We Know
- MORE: How to Overclock a CPU
- MORE: How to check CPU Temperature
- MORE: All CPUs Content