
Why you can trust Tom's Hardware Our expert reviewers spend hours testing and comparing products and services so you can choose the best for you. Find out more about how we test.
To learn more about our PSU tests and methodology, please check out How We Test Power Supply Units.


Primary Rails And 5VSB Load Regulation
The following charts show the main rails' voltage values recorded between a range of 40W up to the PSU's maximum specified load, along with the deviation (in percent). Tight regulation is an important consideration every time we review a power supply because it facilitates constant voltage levels despite varying loads. Tight load regulation also, among other factors, improves the system’s stability, especially under overclocked conditions and, at the same time, it applies less stress to the DC-DC converters that many system components utilize.


Load regulation is within 1% on all major rails, so it is tight enough.
Hold-Up Time
Put simply; hold-up time is the amount of time that the system can continue to run without shutting down or rebooting during a power interruption.


The hold-up time is below 17ms, because of the low capacity bulk cap. The power-ok signal is accurate, but the delay is lower than 1ms, which is the minimum time that the ATX spec requires.
Inrush Current
Inrush current, or switch-on surge, refers to the maximum, instantaneous input current drawn by an electrical device when it is first turned on. A large enough inrush current can cause circuit breakers and fuses to trip. It can also damage switches, relays, and bridge rectifiers. As a result, the lower the inrush current of a PSU right as it is turned on, the better.


Inrush current is low with 115V and at normal levels with 230V.
Leakage Current
In layman's terms, leakage current is the unwanted transfer of energy from one circuit to another. In power supplies, it is the current flowing from the primary side to the ground or the chassis, which in the majority of cases is connected to the ground. For measuring leakage current, we use a GW Instek GPT-9904 electrical safety tester instrument.
The leakage current test is conducted at 110% of the DUT's rated voltage input (so for a 230-240V device, we should conduct the test with 253-264V input). The maximum acceptable limit of a leakage current is 3.5 mA and it is defined by the IEC-60950-1 regulation, ensuring that the current is low and will not harm any person coming in contact with the power supply's chassis.

Leakage current is low.
10-110% Load Tests
These tests reveal the PSU's load regulation and efficiency levels under high ambient temperatures. They also show how the fan speed profile behaves under increased operating temperatures.
| Test | 12V | 5V | 3.3V | 5VSB | DC/AC (Watts) | Efficiency | Fan Speed (RPM) | PSU Noise (dB[A]) | Temps (In/Out) | PF/AC Volts |
| 10% | 3.590A | 1.988A | 1.97A | 0.985A | 64.998 | 86.401% | 738 | 21.3 | 40.67°C | 0.955 |
| Row 2 - Cell 0 | 12.086V | 5.03V | 3.351V | 5.078V | 75.229 | Row 2 - Cell 6 | Row 2 - Cell 7 | Row 2 - Cell 8 | 44.78°C | 115.1V |
| 20% | 8.198A | 2.983A | 2.957A | 1.184A | 129.929 | 90.098% | 739 | 21.4 | 40.81°C | 0.973 |
| Row 4 - Cell 0 | 12.079V | 5.028V | 3.348V | 5.07V | 144.208 | Row 4 - Cell 6 | Row 4 - Cell 7 | Row 4 - Cell 8 | 45.21°C | 115.1V |
| 30% | 13.162A | 3.482A | 3.451A | 1.383A | 194.94 | 91.259% | 741 | 21.5 | 41.44°C | 0.979 |
| Row 6 - Cell 0 | 12.071V | 5.026V | 3.346V | 5.062V | 213.613 | Row 6 - Cell 6 | Row 6 - Cell 7 | Row 6 - Cell 8 | 46.21°C | 115.1V |
| 40% | 18.137A | 3.98A | 3.947A | 1.583A | 260.025 | 91.433% | 742 | 21.5 | 41.61°C | 0.981 |
| Row 8 - Cell 0 | 12.065V | 5.024V | 3.344V | 5.053V | 284.387 | Row 8 - Cell 6 | Row 8 - Cell 7 | Row 8 - Cell 8 | 46.69°C | 115.1V |
| 50% | 22.767A | 4.978A | 4.937A | 1.784A | 325.025 | 91.14% | 744 | 21.6 | 42°C | 0.982 |
| Row 10 - Cell 0 | 12.058V | 5.022V | 3.342V | 5.045V | 356.62 | Row 10 - Cell 6 | Row 10 - Cell 7 | Row 10 - Cell 8 | 47.59°C | 115.1V |
| 60% | 27.360A | 5.976A | 5.928A | 1.986A | 389.495 | 90.719% | 747 | 21.8 | 42.61°C | 0.981 |
| Row 12 - Cell 0 | 12.050V | 5.02V | 3.34V | 5.036V | 429.343 | Row 12 - Cell 6 | Row 12 - Cell 7 | Row 12 - Cell 8 | 49.17°C | 115.1V |
| 70% | 32.029A | 6.976A | 6.921A | 2.188A | 454.824 | 89.395% | 1185 | 35.5 | 43.05°C | 0.979 |
| Row 14 - Cell 0 | 12.042V | 5.018V | 3.338V | 5.027V | 508.78 | Row 14 - Cell 6 | Row 14 - Cell 7 | Row 14 - Cell 8 | 50.36°C | 115.1V |
| 80% | 36.715A | 7.978A | 7.915A | 2.291A | 519.633 | 88.717% | 1517 | 42.2 | 43.85°C | 0.98 |
| Row 16 - Cell 0 | 12.031V | 5.015V | 3.335V | 5.022V | 585.72 | Row 16 - Cell 6 | Row 16 - Cell 7 | Row 16 - Cell 8 | 52.16°C | 115.1V |
| 90% | 41.808A | 8.48A | 8.401A | 2.393A | 585.059 | 88.038% | 1739 | 45.2 | 44°C | 0.981 |
| Row 18 - Cell 0 | 12.020V | 5.013V | 3.333V | 5.016V | 664.554 | Row 18 - Cell 6 | Row 18 - Cell 7 | Row 18 - Cell 8 | 53.42°C | 115.1V |
| 100% | 46.834A | 8.982A | 8.917A | 2.496A | 649.813 | 87.364% | 1740 | 45.3 | 45.96°C | 0.982 |
| Row 20 - Cell 0 | 12.012V | 5.011V | 3.331V | 5.009V | 743.803 | Row 20 - Cell 6 | Row 20 - Cell 7 | Row 20 - Cell 8 | 56.04°C | 115.1V |
| 110% | 51.595A | 9.985A | 10.004A | 2.499A | 715.242 | 86.51% | 1741 | 45.3 | 46.89°C | 0.983 |
| Row 22 - Cell 0 | 12.005V | 5.009V | 3.328V | 5.004V | 826.78 | Row 22 - Cell 6 | Row 22 - Cell 7 | Row 22 - Cell 8 | 58.2°C | 115.1V |
| CL1 | 0.116A | 11.999A | 11.883A | 0A | 101.315 | 85.138% | 750 | 21.9 | 43.42°C | 0.968 |
| Row 24 - Cell 0 | 12.086V | 5.018V | 3.34V | 5.09V | 119.001 | Row 24 - Cell 6 | Row 24 - Cell 7 | Row 24 - Cell 8 | 48.77°C | 115.12V |
| CL2 | 0.116A | 19.958A | 0A | 0A | 101.423 | 83.217% | 754 | 22.1 | 41.51°C | 0.969 |
| Row 26 - Cell 0 | 12.090V | 5.012V | 3.352V | 5.094V | 121.878 | Row 26 - Cell 6 | Row 26 - Cell 7 | Row 26 - Cell 8 | 48.94°C | 115.12V |
| CL3 | 0.116A | 0A | 19.785A | 0A | 67.388 | 77.718% | 739 | 21.4 | 40.54°C | 0.958 |
| Row 28 - Cell 0 | 12.086V | 5.034V | 3.335V | 5.091V | 86.708 | Row 28 - Cell 6 | Row 28 - Cell 7 | Row 28 - Cell 8 | 49.81°C | 115.12V |
| CL4 | 54.045A | 0A | 0A | 0A | 649.703 | 88.287% | 1742 | 45.3 | 45.75°C | 0.982 |
| Row 30 - Cell 0 | 12.021V | 5.026V | 3.342V | 5.075V | 735.905 | Row 30 - Cell 6 | Row 30 - Cell 7 | Row 30 - Cell 8 | 57.07°C | 115.11V |
Despite the 40°C rating, the PSU didn't have a problem delivering full load, and even more, at 47°C. We would like to see higher PF readings, though, especially ay higher loads.
20-80W Load Tests
In the following tests, we measure the PSU's efficiency at loads significantly lower than 10% of its maximum capacity (the lowest load the 80 PLUS standard measures). This is important for representing when a PC is idle with power-saving features turned on.
| Test | 12V | 5V | 3.3V | 5VSB | DC/AC (Watts) | Efficiency | Fan Speed (RPM) | PSU Noise (dB[A]) | Temps (In/Out) | PF/AC Volts |
| 20W | 1.228A | 0.497A | 0.492A | 0.196A | 19.994 | 73.477% | 732 | 20.9 | 37.45°C | 0.841 |
| Row 2 - Cell 0 | 12.082V | 5.033V | 3.354V | 5.1V | 27.211 | Row 2 - Cell 6 | Row 2 - Cell 7 | Row 2 - Cell 8 | 40.53°C | 115.08V |
| 40W | 2.705A | 0.695A | 0.689A | 0.294A | 39.996 | 83.039% | 733 | 21.1 | 38.06°C | 0.924 |
| Row 4 - Cell 0 | 12.084V | 5.033V | 3.353V | 5.096V | 48.165 | Row 4 - Cell 6 | Row 4 - Cell 7 | Row 4 - Cell 8 | 41.41°C | 115.09V |
| 60W | 4.182A | 0.894A | 0.886A | 0.393A | 59.995 | 86.637% | 734 | 21.2 | 38.16°C | 0.95 |
| Row 6 - Cell 0 | 12.083V | 5.032V | 3.352V | 5.093V | 69.249 | Row 6 - Cell 6 | Row 6 - Cell 7 | Row 6 - Cell 8 | 41.9°C | 115.09V |
| 80W | 5.654A | 1.093A | 1.083A | 0.491A | 79.942 | 88.683% | 735 | 21.2 | 39.53°C | 0.96 |
| Row 8 - Cell 0 | 12.082V | 5.032V | 3.352V | 5.089V | 90.143 | Row 8 - Cell 6 | Row 8 - Cell 7 | Row 8 - Cell 8 | 43.59°C | 115.09V |
Efficiency is high at light loads and the fan's speed is kept low.
2% or 10W Load Test
From July 2020, the ATX spec requires 70% and higher efficiency with 115V input. The applied load is only 10W for PSUs with 500W and lower capacities, while for stronger units, we dial 2% of their max-rated capacity.
| 12V | 5V | 3.3V | 5VSB | DC/AC (Watts) | Efficiency | Fan Speed (RPM) | PSU Noise (dB[A]) | Temps (In/Out) | PF/AC Volts |
| 0.920A | 0.205A | 0.205A | 0.043A | 13.024 | 62.293% | 712 | 20.1 | 24.08°C | 0.779 |
| Row 2 - Cell 0 | 12.049V | 5.03V | 3.352V | 5.106V | 20.908 | Row 2 - Cell 6 | Row 2 - Cell 7 | 25.54°C | 115.12V |
It is a great shame that the PSU cannot deliver more than 70% load with a 2% load.
Efficiency & Power Factor
Next, we plotted a chart showing the PSU's efficiency at low loads and loads from 10 to 110% of its maximum rated capacity. The higher a PSU’s efficiency, the less energy goes wasted, leading to a reduced carbon footprint and lower electricity bills. The same goes for Power Factor.
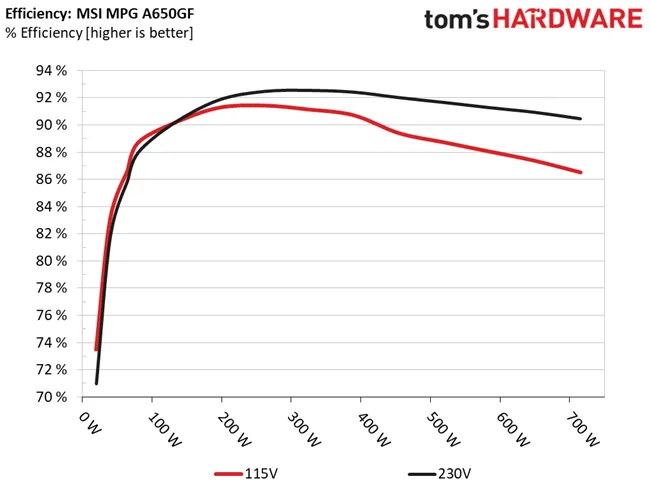


Efficiency is high on all load ranges but with 2%. PF readings are low, though, especially with 230V input.
5VSB Efficiency
| Test # | 5VSB | DC/AC (Watts) | Efficiency | PF/AC Volts |
| 1 | 0.1A | 0.511W | 75.694% | 0.065 |
| Row 2 - Cell 0 | Row 2 - Cell 1 | 5.105V | 0.675W | 115.12V |
| 2 | 0.25A | 1.276W | 78.735% | 0.147 |
| Row 4 - Cell 0 | Row 4 - Cell 1 | 5.102V | 1.621W | 115.12V |
| 3 | 0.55A | 2.803W | 79.965% | 0.265 |
| Row 6 - Cell 0 | Row 6 - Cell 1 | 5.095V | 3.505W | 115.12V |
| 4 | 1A | 5.085W | 77.742% | 0.367 |
| Row 8 - Cell 0 | Row 8 - Cell 1 | 5.084V | 6.541W | 115.12V |
| 5 | 1.5A | 7.609W | 77.51% | 0.423 |
| Row 10 - Cell 0 | Row 10 - Cell 1 | 5.072V | 9.817W | 115.11V |
| 6 | 2.5A | 12.624W | 76.172% | 0.472 |
| Row 12 - Cell 0 | Row 12 - Cell 1 | 5.049V | 16.572W | 115.11V |


The 5VSB rail has decent efficiency.
Power Consumption In Idle And Standby
| Mode | 12V | 5V | 3.3V | 5VSB | Watts | PF/AC Volts |
| Idle | 12.065V | 5.029V | 3.352V | 5.108V | 4.514 | 0.314 |
| Row 2 - Cell 0 | Row 2 - Cell 1 | Row 2 - Cell 2 | Row 2 - Cell 3 | Row 2 - Cell 4 | Row 2 - Cell 5 | 115.11V |
| Standby | Row 3 - Cell 1 | Row 3 - Cell 2 | Row 3 - Cell 3 | Row 3 - Cell 4 | 0.047 | 0.005 |
| Row 4 - Cell 0 | Row 4 - Cell 1 | Row 4 - Cell 2 | Row 4 - Cell 3 | Row 4 - Cell 4 | Row 4 - Cell 5 | 115.11V |


Vampire power is low.
Fan RPM, Delta Temperature, And Output Noise
All results are obtained between an ambient temperature of 37 to 47 degrees Celsius (98.6 to 116.6 degrees Fahrenheit).


The fan speed profile is not so aggressive, under high operating temperatures. It could probably help if fan speed was higher at mid loads, for a more linear increase at high loads.
The following results were obtained at 30 to 32 degrees Celsius (86 to 89.6 degrees Fahrenheit) ambient temperature.


As expected, at normal operating temperatures close to 30 degrees Celsius, the PSU has a more relaxed fan speed profile than high temperatures.
MORE: Best Power Supplies
MORE: How We Test Power Supplies
MORE: All Power Supply Content
