Toshiba TR200 SSD Review
Why you can trust Tom's Hardware
512GB SSD Performance
Comparison Products
The TR200 480GB should be more competitive than the larger 1TB model. All three TR200 SSDs use the same controller, so they have the same amount of SRAM. Toshiba doesn't disclose how much embedded memory is inside the controller, but SRAM is expensive and consumes valuable die area. You can think of it like L1 cache on CPUs -- a little bit goes a long way.
The TR200 480GB costs just $10 less than the Samsung 850 EVO 500GB, which has established itself as the performance standard that all SATA SSDs are compared to. We added the 850 EVO, Crucial BX300, Intel 540s, and the MX300 for this series of tests. All these drives feature 3D NAND flash. The Mushkin Triactor, Sk Hynix SL308 and OCZ (Toshiba) Trion 150 also made the list.
The Trion 150 went through a couple of rebrands. You can find it listed online as the TR150 under both the OCZ and Toshiba brands. The new Toshiba TR200 is the successor to the Trion 150.
Sequential Read Performance
To read about our storage tests in-depth, please check out How We Test HDDs And SSDs. We cover four-corner testing on page six of our How We Test guide.


The TR200 480GB provides nearly the same sequential read performance as the larger 960GB model, but the comparison products have lost a little speed. That makes the TR200 480GB appear a bit faster. Sequential read performance isn't what ails this series.
Sequential Write Performance


The TR200 480GB delivers around 100 MB/s less sequential write performance than the model twice its size. If we write compressible data to the drive, and to clean flash, it delivers a large performance increase. But most of your sequential transfers consist of data that is already compressed.
Random Read Performance


In relation to the comparison drives, the TR200 480GB looks good for an entry-level SSD. The drive delivers around 1,400 IOPS more performance at QD1 than the model it replaces.
Random Write Performance


Random performance is still a problem with the TR200. We've had this problem with most of the DRAMless products we've tested over the last three years. We hoped the introduction of 3D flash would fix the random write hole, but it hasn't.
80% Mixed Sequential Workload
We describe our mixed workload testing in detail here and describe our steady state tests here.
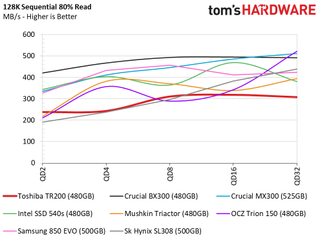
The TR200 480GB didn't get faster at mixed workloads than the 960 GB model, but the other drives also lose performance in this capacity. The TR200 is in the mix (so to speak), but it's still on the lower end of the performance scale.
80% Mixed Random Workload
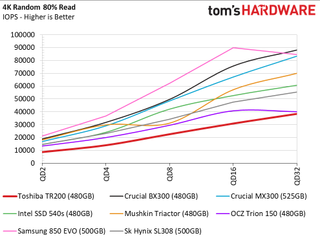
The mixed random test shows that the 20% write workload reduces overall performance. If Toshiba priced the TR200 like a true entry-level SSD this level of performance wouldn't be that big of a deal, but what you get for your dollar is out of balance.
Sequential Steady-State


None of the entry-level and mainstream drives in the charts were designed for strenuous workstation-class workloads. We still like to run the drives through this test to look for a standout that may cross over. This test also measures performance when the drives are nearly full of data, which hampers SSD performance.
Random Steady-State


Like the higher capacity TR200, the 480GB model skims the bottom of the charts with low random IOPS performance under steady-state conditions. These are worst-case scenario random numbers, but they tell a pretty damning story about the TR200 under these conditions.
PCMark 8 Real-World Software Performance
For details on our real-world software performance testing, please click here.


The 480GB TR200 drive catches up to the comparison drives and even outperforms a few of the other products in some tests.
Application Storage Bandwidth
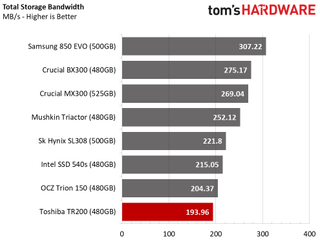
The average results provide a condensed view of performance. The new TR200 with BiCS NAND is slower than the product it replaces in the Toshiba line up.
PCMark 8 Advanced Workload Performance
To learn how we test advanced workload performance, please click here.


The PCMark 8 Extended Storage Test is widely regarded as the best way to measure long-term performance. Entry-level products are considered light-use devices, and we measure their performance during the recovery phases of the test. The TR200 does recover some of its lost performance, but it is well off the pace of the other products.
Total Service Time


The service time results show that the TR200 simply needs more time to complete the workloads than the other products.
Disk Busy Time
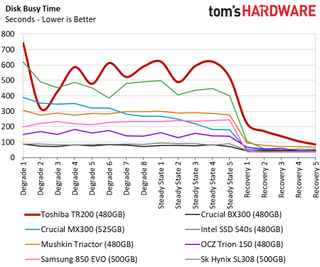
The disk busy time result shows how long each drive is active. This removes any CPU processing time associated with loading the data.
Responsiveness Test


The Toshiba TR200 480GB delivers the least responsive user experience of all the drives tested in this capacity class. The mid-capacity model is more efficient than the largest capacity, but it still consumes quite a bit of power.
Notebook Battery Life


We already explained the power consumption issues that plague DRAMless SSDs. The mid-capacity drive performs quite a bit better than the 960GB in our test with a Lenovo Y700-17, but it still trails many of the popular SSDs on the market.
MORE: Best SSDs
MORE: How We Test HDDs And SSDs
MORE: All SSD Content
Stay on the Cutting Edge
Join the experts who read Tom's Hardware for the inside track on enthusiast PC tech news — and have for over 25 years. We'll send breaking news and in-depth reviews of CPUs, GPUs, AI, maker hardware and more straight to your inbox.

Qualcomm faces benchmark cheating allegations — Snapdragon X Elite/Plus benchmarks claimed to be fraudulent

AMD-powered classic Macintosh System 1-inspired mini PC available for retail — Ayaneo's new AM01 released after a successful Indiegogo campaign

Raspberry Pi Compute Module 4S memory variants announced
-
Sakkura Why do they even bother releasing this as a retail product. Just work with the manufacturers of laptops and prebuilt desktops, who are only looking for a cheap way to put "SSD" on their spec sheet and don't care about performance.Reply -
Flying-Q ReplyWe don't think the 240GB and 480GB are not worthy of consideration at launch pricing.
Can you sort out the double negative please? -
AgentLozen It drives me crazy thinking that companies like Toshiba are filled to the brim with talented engineers and yet they still think the best route forward is with a DRAMless design. Are you telling me that not a single high level person compared their SSDs to the competition and said "These things are garbage. Let's stop wasting our money developing them."Reply
Sakkura suggested that these SSDs are meant to be put into prebuilt desktops as a cheap means of adding an SSD to the spec sheet. In the conclusion, the author states that "The results do not justify the means, even with a $10 decrease in component expense. The only price that users care about is what they pay, and DRAMless SSDs are not cheaper than products already on the market." NOBODY benefits from DRAMless SSDs even in a $450 prebuilt desktop.
The situation is frustrating to me because I would rather have big companies like Toshiba not waste their effort designing this crap. I enjoy reading about disruptive new products that shake up the market. I want to experience the Back to the Future 2 utopian future. Products like this take us backwards to a dystopia where the world is ruled by tremendous idiots and as of 2017 we STILL don't have flying cars. -
2Be_or_Not2Be I really dislike DRAM-less controllers. Put this terribly-performing Trash-200 drive on the same level as the Intel 600p - that is, things not to buy!Reply -
gjbaker003 In the "Pricing & Warranty" section it suggests that the $89.99 SSD is 120GB, but the rest of the article states that the $89.99 SSD is 240GB. I would assume at that price point, that 240GB is the correct size of the drive?Reply -
mapesdhs (non-zero origin in the sequential read graph again)Reply
I bet if they were included, the 840 Pro, Vector, Vertex 4 and Neutron GTX from five years ago would still be better than these new Toshiba models. I long for the day when something as good as the 850 EVO is available at a price the 850 EVO was 2 years ago (250GB for 53 UKP, 500GB for 113 UKP).
Whatever happened to SanDisk's promise to release 8TB SSDs for the consumer market by now? -
derekullo Some one lied to Toshiba marketing.Reply
The drive barely hits 300 megabytes a second with that wavy pattern.
It almost looks like the drive was thermal throttling with that pattern. -
HERETIC-1 So sad-with Toshiba 3D available was thinking the "Race to the bottom"Reply
was finally over.
A few dollars worth of Ram could have possibly made these a decent SSD.
Thro the controller could also be part of the poor performance........... -
kookykrazee I will consider SATA technology outdated when I can get 6-10TB drives that are reasonably priced. That will not happen for awhile, so when I got a free $200 BB gift card I got a 8TB drive for $179. This replaced 3 1.5-3TB drives. Gained a few degrees in my case, too :)Reply
