Thecus N5810 Pro NAS Review
Thecus' N5810 Pro is the only NAS in its price class with a built-in battery backup that allows the system to save your data even after the power goes out.
Why you can trust Tom's Hardware
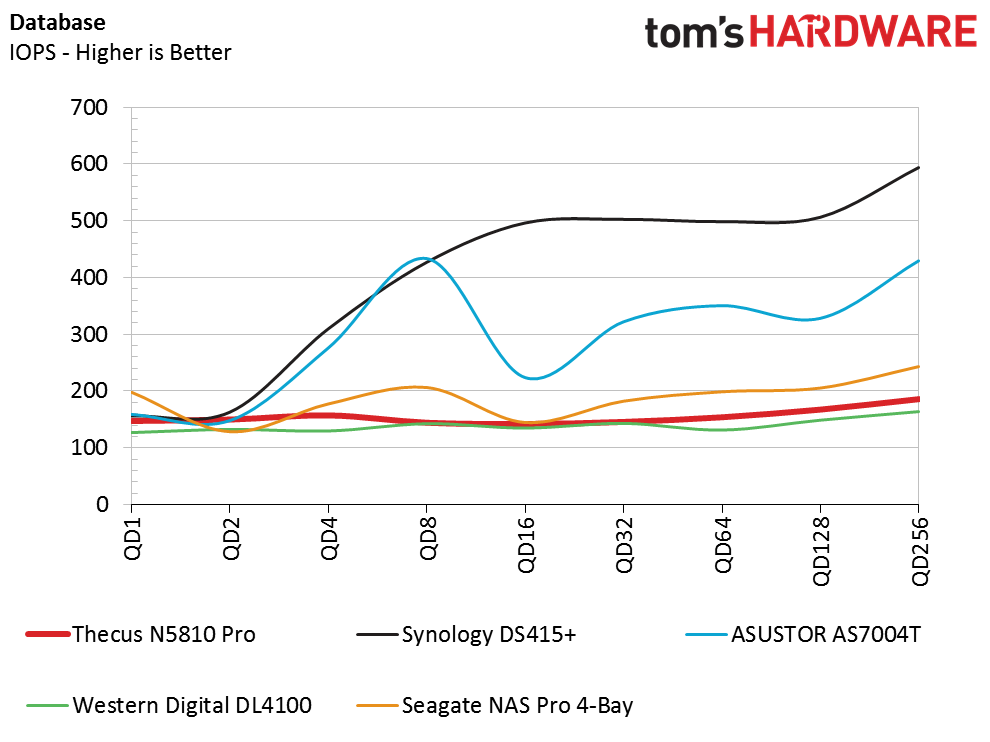
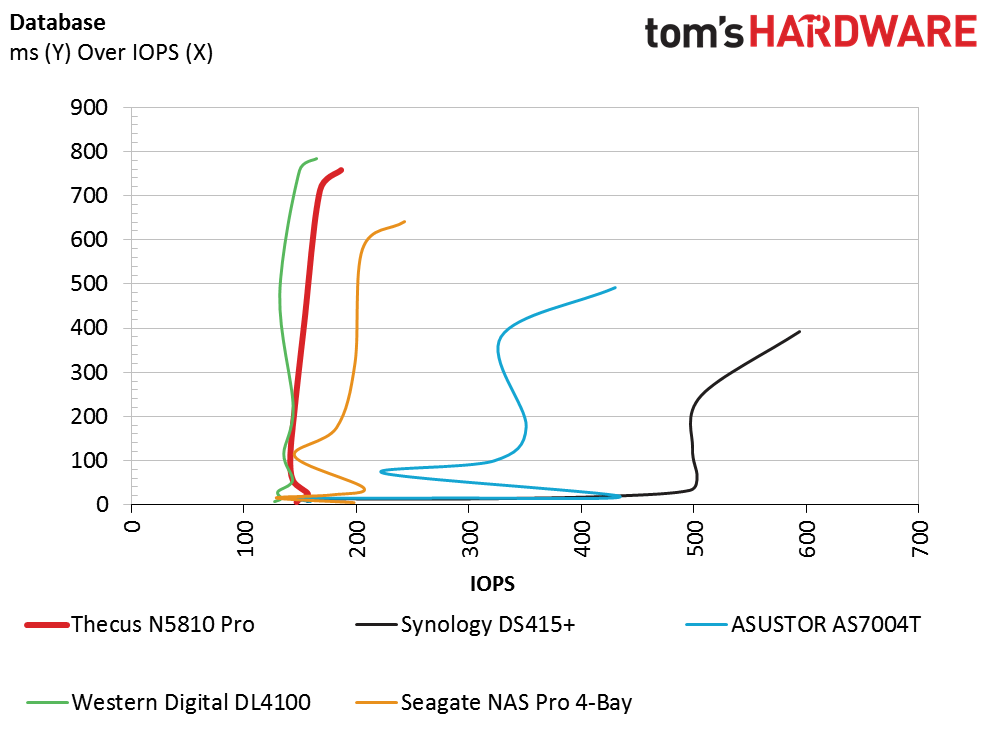
Database Server Workload
The next series of tests uses traditional server workloads. The first charts in each group show scaling performance by queue depth, while the second chart (what we call a snake chart) shows IOPS under latency. This is the amount of IOPS you can achieve before latency increases. System administrators will want to tune the workload to the highest IOPS before latency increases.


Thecus' N5810 Pro doesn't scale well as the database workload increases. The IOPS remain steady, but latency increases as the task gets more demanding.
Get Tom's Hardware's best news and in-depth reviews, straight to your inbox.
Current page: Database Server Workload
Prev Page Single Client iSCSI Workloads Next Page File Server Workload
Chris Ramseyer was a senior contributing editor for Tom's Hardware. He tested and reviewed consumer storage.
-
Lulzon Typically battery backups are SLA (sealed lead acid) which is most likely why they don't get packaged with NAS systems - they're heavy, they're a dangerous good by transportation and shipping rules, they expand and can release gasses when under load and charged. The upside? They have way more capacity than that of a lithium-ion as shown in this little unit, they (probably) cost much less, and they last longer (5+ years vs 2-3). In terms of a NAS though, the capacity isn't really an issue if the only thing the NAS is doing is shutting down to avoid data loss/corruption.Reply -
Aris_Mp 55.3W under heavy throughput and 35.1W at idle with 5x Seagate ST500DM005 HDDs and RAID 6 configuration.Reply -
TontNZ I'm not sure if I've just missed it - but: How many drives of what brand and capacity, in what raid mode were used for the testing?Reply
It would be good to single this information out into one of the section headings. It may be redundant as you presumably standardise this across NAS of a given bay capacity - but it would still be useful. -
This is an impressive device. I'd definitively give it a try for home office solutions. The only downside I can see to it is that if the internal memory were to die (flash, ram), the backups are probably gone unless they keep using the same system/setting organization and it is forward compatible with other similar systems.Reply
5 years is a long time and unless they intend to have the same product line around for a long time, it will either be EOL or replaced with an updated version.