Why you can trust Tom's Hardware
We used GPUz logging to measure the card’s power consumption with the Metro: Exodus benchmark running at 2560 x 1440 using the default Ultra settings. The tested card is warmed up prior to testing and started after settling to an idle temperature (after about 10 minutes). The benchmark is looped a total of five times which yields around 10 minutes of testing. In the charts you will see a few blips in power use which is a result of the benchmark ending one loop and starting the next.
We also use Furmark to capture worst-case power readings. Although both Nvidia and AMD consider the application to be a “power virus,” or program that deliberately taxes the components beyond normal limits, the data we can gather from it offers useful information about a card’s capabilities outside of typical gaming loads.
Power Draw

For power testing, we charted both RX 5600 XT’s, the AMD RX 5700, as well as the Nvidia RTX 2060. What sticks out in the results is the wildly varying power draw. Whereas the other three cards are within about 20W throughout, the Asus ROG Strix card spans a 60W range and ended up with a roller-coaster pattern in the chart. This appears to have had an effect on clock speeds as well--or was in fact due to them. Where other cards were within 25-40 MHz, the Asus showed around 100 MHz variance in testing. The gameplay experience did not suffer in our tested titles, but this behavior isn’t typical.
Power/clock variability aside, the Asus card averaged a mere 111W where the Sapphire reached 140W. Compared to the RTX 2060 at 158W, both 5600 XTs used less power. The reference RX 5700 runs at 140W as well, similar to the Sapphire.

Our Furmark results show a similar story here. The Asus O6G Gaming power isn’t pegged off the limit as we typically see. Again the data is showing nearly a 40W span through the test. This, in turn, caused the clocks speeds to also vary more than the other test cards.
We’ve reached out to Asus to confirm what we saw happen here is intended. But we haven’t seen such a large range in the past. If we hear back with an explanation, we’ll update this review.
Temperatures, Fan Speeds and Clock Rates
In order to see how each video card behaves, like the power testing, we use GPUz logging in one-second intervals to capture data. As with testing for power, testing for these items is also done by looping the Metro: Exodus benchmark five times at Ultra settings running at 2560x1440 resolution.
Additionally, we also used Furmark to capture some of the data below, which offers a more consistent load and uses slightly more power, regardless of the fact that the clock speeds and voltages are limited. These data sets give insight into worst-case situations along with a load other than gaming.
Gaming
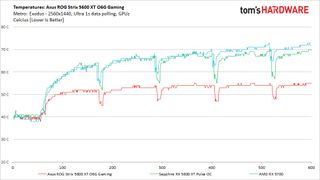
Taking a look at the temperature chart, we see the Asus ROG Strix card was, by far, the coolest. This is a direct result of the card’s power consumption being so erratic. The combination of averaging 30W less power during testing and the large cooler yielded almost a 15 degree Celsius difference between the two 5600 XTs. I’d imagine if the power use was a bit flatter, we would see results similar to the Sapphire card.
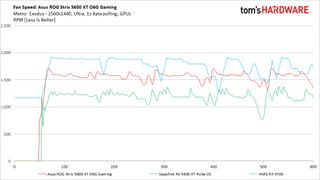
Fan speeds on our Asus ROG Strix RX 5600 XT O6G Gaming averaged 1,600 RPM through the test. This is faster than the Sapphire but the Asus card was still quieter than the Sapphire during testing.
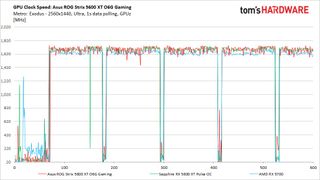
Clock speeds averaged 1,680 MHz on the Asus in our gaming test, a mere 10 MHz slower than the Sapphire. As mentioned previously, the range on the Asus card was a lot more, nearly 100 MHz versus 25-40 MHz on the other cards. If the power/clocks didn’t vary so much here, the end result might be a somewhat faster card.
Furmark
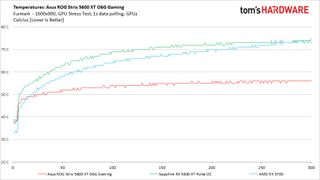
Moving on to Furmark, little has changed. Temperatures on our Asus ROG Strix RX 5600 XT O6G Gaming peaked at 57 degrees Celsius. Compared to the other cards listed, it runs much cooler. Although the cooler has a lot to do with it, the variable power levels also played a role, with the card not getting a chance to manage a more consistent load.
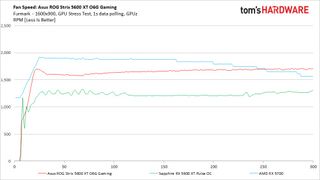
Fan speeds during Furmark testing ended up at the same 1,600 RPM found in our game testing. These results showed the RPM barely budged off the average -- quite different from what was recorded during the gaming test.
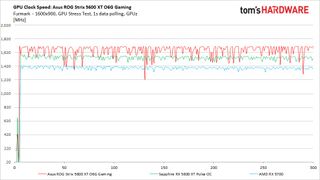
Clock speed when running Furmark is a lot lower in most cases. With Furmark’s ability to push things much harder than gaming, the cards will hit the limit and throttle back voltage and clock speeds to stay under the power limit. In this case, the Asus ROG Strix ran 50 MHz slower. Typically, we see drops of at least 100 MHz (as we did with the Sapphire at 150 MHz-plus). Again, the odd power behavior from the card has something to do with this result.
MORE: Best Graphics Cards
MORE: Desktop GPU Performance Hierarchy Table
MORE: All Graphics Content
Current page: Power Consumption, Fan Speeds, Clock Rates and Temperature
Prev Page Performance Results: 2560 x 1440 (Medium) Next Page Software: Aura Sync
Joe Shields is a Freelance writer for Tom’s Hardware US. He reviews motherboards.
-
mossberg Moral of the story, don't pay for the Asus tax. They think their name adds value, which it does not. Sapphire is the best, followed by power color, when it comes to AMD cards. I see 0 reason to spend that kind of money, on a 5600xt, when you can get a faster card, for a similar cost, or less. $339 is RX 5700 territory.Reply -
ron baker Im sure the Die sizes aren't different on the two 5600xt models ... otherwise thats a scoop!Reply

