EVGA SuperNOVA 850 T2 Power Supply Review
EVGA's T2 series consists of Titanium-rated PSUs with capacities ranging from 750 to 1600W. Today, we're looking at the 850W model, which tries to prove it is worth a premium compared to the company's Platinum-rated 850W offering.
Why you can trust Tom's Hardware
Cross-Load Tests And Infrared Images
Our cross-load tests are described in detail here.
To generate the following charts, we set our loaders to auto mode through our custom-made software before trying more than 1500 possible load combinations with the +12V, 5V and 3.3V rails. The load regulation deviations in each of the charts below were calculated by taking the nominal values of the rails (12V, 5V and 3.3V) as point zero.
Load Regulation Charts


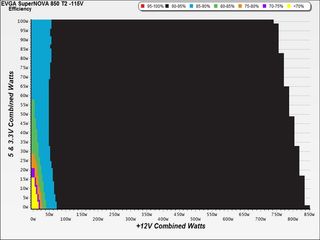
Efficiency Chart

With 75W load and up, efficiency is constantly above 90%. This is amazing, to say the least.
Ripple Charts


Infrared Images
Toward the end of the cross-load tests, we took some photos of the PSU with our modified FLIR E4 camera that delivers 320x240 IR resolution (76,800 pixels).


The temperatures inside the PSU during our demanding cross-load tests, where the PSU operates under full load for a prolonged period, remain at normal levels. Although the fan rarely spins (and once it does, it spins slowly), the internal temps never hit worrisome levels. If they did, the over-temperature protection circuit would kick in to protect the power supply.
Current page: Cross-Load Tests And Infrared Images
Prev Page Efficiency, Temperature And Noise Next Page Transient Response TestsStay on the Cutting Edge
Join the experts who read Tom's Hardware for the inside track on enthusiast PC tech news — and have for over 25 years. We'll send breaking news and in-depth reviews of CPUs, GPUs, AI, maker hardware and more straight to your inbox.
Aris Mpitziopoulos is a Contributing Editor at Tom's Hardware US, covering PSUs.
-
turkey3_scratch Very great unit, as expected. I would have liked to see the threshold for when OTP really kicks in, if it even does. Perhaps duct taping the exhaust grill will do the trick. It's nice to see Superflower use a MOV for a change. I just wish that 3.3V rail would not get so near 3.14V during the transient response tests, but realistically I don't expect the 3.3V rail to get that sudden load these days.Reply
Also @Aris, are you sure there's only 4 y caps? I thought those blue sleeves store multiple y caps? Or do they not? -
Aris_Mp if you mean the blue components before/after the bridge rectifier, they are X caps and I didn't count them in the EMI filter on purpose.Reply -
ZeusGamer I've had the G2 model of this power supply and it's still working great after two years. I'm really impressed by EVGA with these G2 and T2 models.Reply -
JackNaylorPE Efficiency is nice... I guess .... but with that 3.3 and 5V performance, I'm not impressed.Reply -
Dark Lord of Tech 3.3 rail can vary per unit , doesn't worry me a bit. Every test model for a review can produce different results.Reply -
JackNaylorPE To each his own I guess... but for the ridiculous price of $240, I'd want better. The Corsair 860 and coolermaster V850 PSUs finish 1 and 2 and are much cheaper.Reply
The unit would fail to meet the ATX spec at 5%, and this comes in at a rather dismal 4.5 %... yes, this does vary from unit to unit (and this is a bad thing) If the unit that winds up in the hands of a review site gets two outta 3 rails at 4.5%, I shudder to think what we might get ordering off newegg. In the review graphs, it's the bottom of the chart against all the other PSUs with which its compared.
The focus on efficiency in the ranking of PSUs in an enthusiast box is a criteria which escapes me ... I never walked into a Porsche dealership where the salesman's first pitch was "this model is great, it has the best gas mileage in our entire line'. -
yyk71200 Differences in effissiency between gold, platinum, and titanium psus are rather small and do not justify price differences. Quality of output is more important criteria in choosing a psu than small differences in wattage consumed.Reply