System Builder Marathon Q1 2015: System Value Compared
Power, Heat, Efficiency And Value

More parts make a hungrier machine, efficiencies of modern architectures aside. A second graphics card adds 152W of power draw to my $1750 machine compared to Don’s $1300 PC, while half as many CPU cores make Paul’s machine appear a true miser.
Bringing efficient architectures back into the spotlight, Paul’s weak GPU pulls similar power compared to Don’s single, fast GeForce GTX 970.
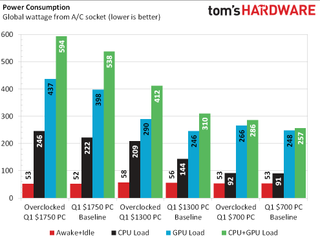
The $1750 PC doesn't live up to the hype of Intel's "Devil's Canyon" thermal optimizations, though the same processor produces dramatically lower temperatures in Don's $1300 PC. Then again, I don't believe Don and Paul measure there CPU and GPU temperatures simultaneously.
A similar phenomena occurs for different reasons in the $1750 PC's upper graphics card, which draws some heat off the back of the machine's lower card. The lower card reached a lower temperature (not shown) that was remarkably similar to Don's single GPU.


Using Paul’s $700 machine as the baseline, we can see just how inefficient its hardware has become by modern standards. Noting that the power chart showed its mid-range graphics card exhibiting the least-competitive power numbers, we’ll credit Don’s single GeForce GTX 970 for his machine’s chart-topping energy-to-performance ratio.
Similarly, I’ll blame my second card for a relative loss of efficiency compared to Don’s. Twice as many cards choke down twice as much energy without delivering two times the performance.
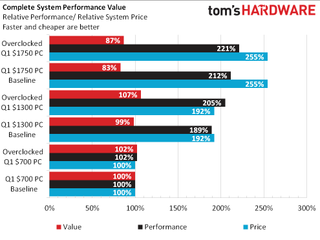
For the first time in recent memory, Don’s mid-priced machine tops our complete system value chart. That’s exclusively due to overclocking, where the $700 PC had a locked CPU. On the other hand, understanding the poor cost-to-benefit ratio of high-end components makes me feel pretty good about my 87% value score.
Stay on the Cutting Edge
Join the experts who read Tom's Hardware for the inside track on enthusiast PC tech news — and have for over 25 years. We'll send breaking news and in-depth reviews of CPUs, GPUs, AI, maker hardware and more straight to your inbox.
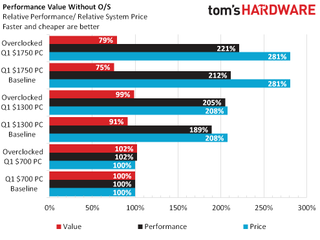
The price of parts that don’t improve performance has the biggest impact on the cheapest machine. We all had to pay $100 for our operating systems, yet that expense was 14% of Paul’s budget and less than 6% of mine. Removing the cost of Windows drops Don’s overclock to a 99% value score, giving Paul his title back.
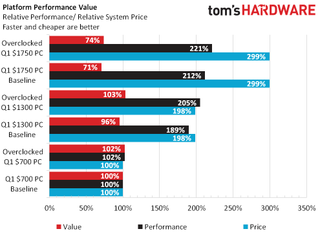
A single loss won’t keep Don from reclaiming his title. He paid for an extra storage drive that he didn’t use, and taking that cost out of the equation (along with each machine’s optical drive and case) puts his machine back in the value lead.
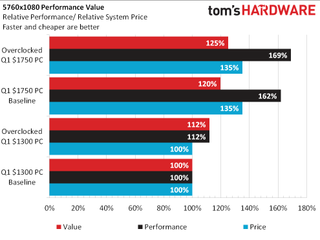
Long ago, Don noted that some of our gaming benchmarks were bottlenecked by non-graphics components at super-high frame rates that aren’t even relevant to real-world game play. Back then he suggested a value chart for high-end gamers with only the top resolution shown. Since I blew a bunch of cash on a pair of graphics cards, his suggestion still sounds like a good strategy for me to eke out a “value” win.
I’m not going to overplay my hand on this one because we all know that Don’s $1300 collection of components is the true winner in this System Builder Marathon. It gets there by overclocking, but still fell within a few percent of the cheap machine’s value at baseline frequencies. And, his $1300 build is the one that presents the best balance of gaming, encoding, content creating, compiling and file compression performance.
-
cknobman So my conclusion from this is that SLI is not worth the investment when gaming @1080p even across 3 monitors.Reply
Unless you are going to do 4k gaming the current crop of CPUs combined with the current graphics engines out there are more than capable of 1080p multi monitor gaming at high or even the highest settings.
-
sumarongi I think the performance of your GTX 970 SLI is completely out of line in comparison with the single GTX 970. A quick look around shows most reviewers reported much better scaling than you are showing??Reply -
Crashman Reply
Pandering perhaps? A reviewer can use a limited range of high settings to find up to 80 or 85% performance gains from the second card. You'll see SOME of those results in this article.15386669 said:I think the performance of your GTX 970 SLI is completely out of line in comparison with the single GTX 970. A quick look around shows most reviewers reported much better scaling than you are showing??
On the other hand, maybe we're pandering to the low-end system by not removing the low-end settings. Look at BF4's 200 FPS cap, and Grid2's DRAM performance bottleneck, both at lower-than-optimal settings for the GTX 970.
Or maybe we just balance out the pandering-to-the-high and the pandering-to-the low. But if it's balanced, we're no longer pandering. Anyway, these details explain the difference between what you've seen there and what you're seeing here.
Edit: Or maybe pandering to the top and bottom cancel each other out to boost the middle. Don's $1300 PC wins!
-
sumarongi Reply15386727 said:
Pandering perhaps? A reviewer can use a limited range of high settings to find up to 80 or 85% performance gains from the second card. You'll see SOME of those results in this article.15386669 said:I think the performance of your GTX 970 SLI is completely out of line in comparison with the single GTX 970. A quick look around shows most reviewers reported much better scaling than you are showing??
On the other hand, maybe we're pandering to the low-end system by not removing the low-end settings. Look at BF4's 200 FPS cap, and Grid2's DRAM performance bottleneck, both at lower-than-optimal settings for the GTX 970.
Or maybe we just balance out the pandering-to-the-high and the pandering-to-the low. But if it's balanced, we're no longer pandering. Anyway, these details explain the difference between what you've seen there and what you're seeing here.
Edit: Or maybe pandering to the top and bottom cancel each other out to boost the middle. Don's $1300 PC wins!
Fair enough, I understand what you are saying. The rating system you are using creates it's own viewpoint on the world that you need to remain consistent within. Maybe value needs to be addressed from the point of view of each individual system and what a real end-user that would buy that system would expect and experience. No one runs SLI GTX 970 on 1600 x 900 resolution so the fact that performance is not great at that resolution has no value at all - negative or positive - and those data points just distort things when it comes down to comparisons.....
-
Crashman Reply
We have some of that in the final chart, 5760x1080 gaming. I could further refine it to include only 5760x1080 at the highest quality test settings, but it already makes that point.15387046 said:Fair enough, I understand what you are saying. The rating system you are using creates it's own viewpoint on the world that you need to remain consistent within. Maybe value needs to be addressed from the point of view of each individual system and what a real end-user that would buy that system would expect and experience. No one runs SLI GTX 970 on 1600 x 900 resolution so the fact that performance is not great at that resolution has no value at all - negative or positive - and those data points just distort things when it comes down to comparisons.....
Perhaps another value chart at 1920x1080 for the low-end system would help, and another for non-gaming if I'd used an X99 system with a cheaper graphics card. I'll toss ideas like that back to the other guys and see what they think.
-
Onus A system has value in the context for which it was built. Even if I were to put a tuner card into it, I'm not likely to judge the value of my PC on its ability to receive broadcast TV, or my TV on its ability to add up numbers. "Is it fit for purpose," though limited, is a fair question, especially on a tight budget.Reply
-
Crashman Reply
Yes, we can't have any of that. TIME TO REPLACE DON!!!15387451 said:Whelp that explains the flying pigs I seen today, Paul lost.
-
Kulamata You're tying yourself up in knots. Instead of setting an arbitrary limit for each category, I'd suggest designing a build for each category, and then listing the costs, and then, from that, suggesting changes to meet various cost thresholds, with a discussion of why those changes deviate from the "ideal".Reply
This would prevent some of the significant limitations that can occur for want of a nail, or a few dollars. I'd regard a machine with only an SSD, and a smallish one at that, to be crippled, and to not kick the system cost from ~$1750 to ~$1800 to provide a hard drive makes the system a victim of misplaced priorities.
That's bean-countin' son! -
OhSnapWord Personally, I'm getting tired of seeing all Intel in the SBMs. I would like to see all AMD for an SBM as it would help give a real nice comparison between the two platforms.Reply
