The Crucial M550 SSD Review: Striking Back With More Performance
Crucial's M500 brought mainstream performance, enhanced features, and rock-bottom pricing together in one of the most-recommended SSDs of 2013. Following up, Crucial has a refined version called the M550, juiced-up for performance-hungry enthusiasts.
Results: TRIM Testing
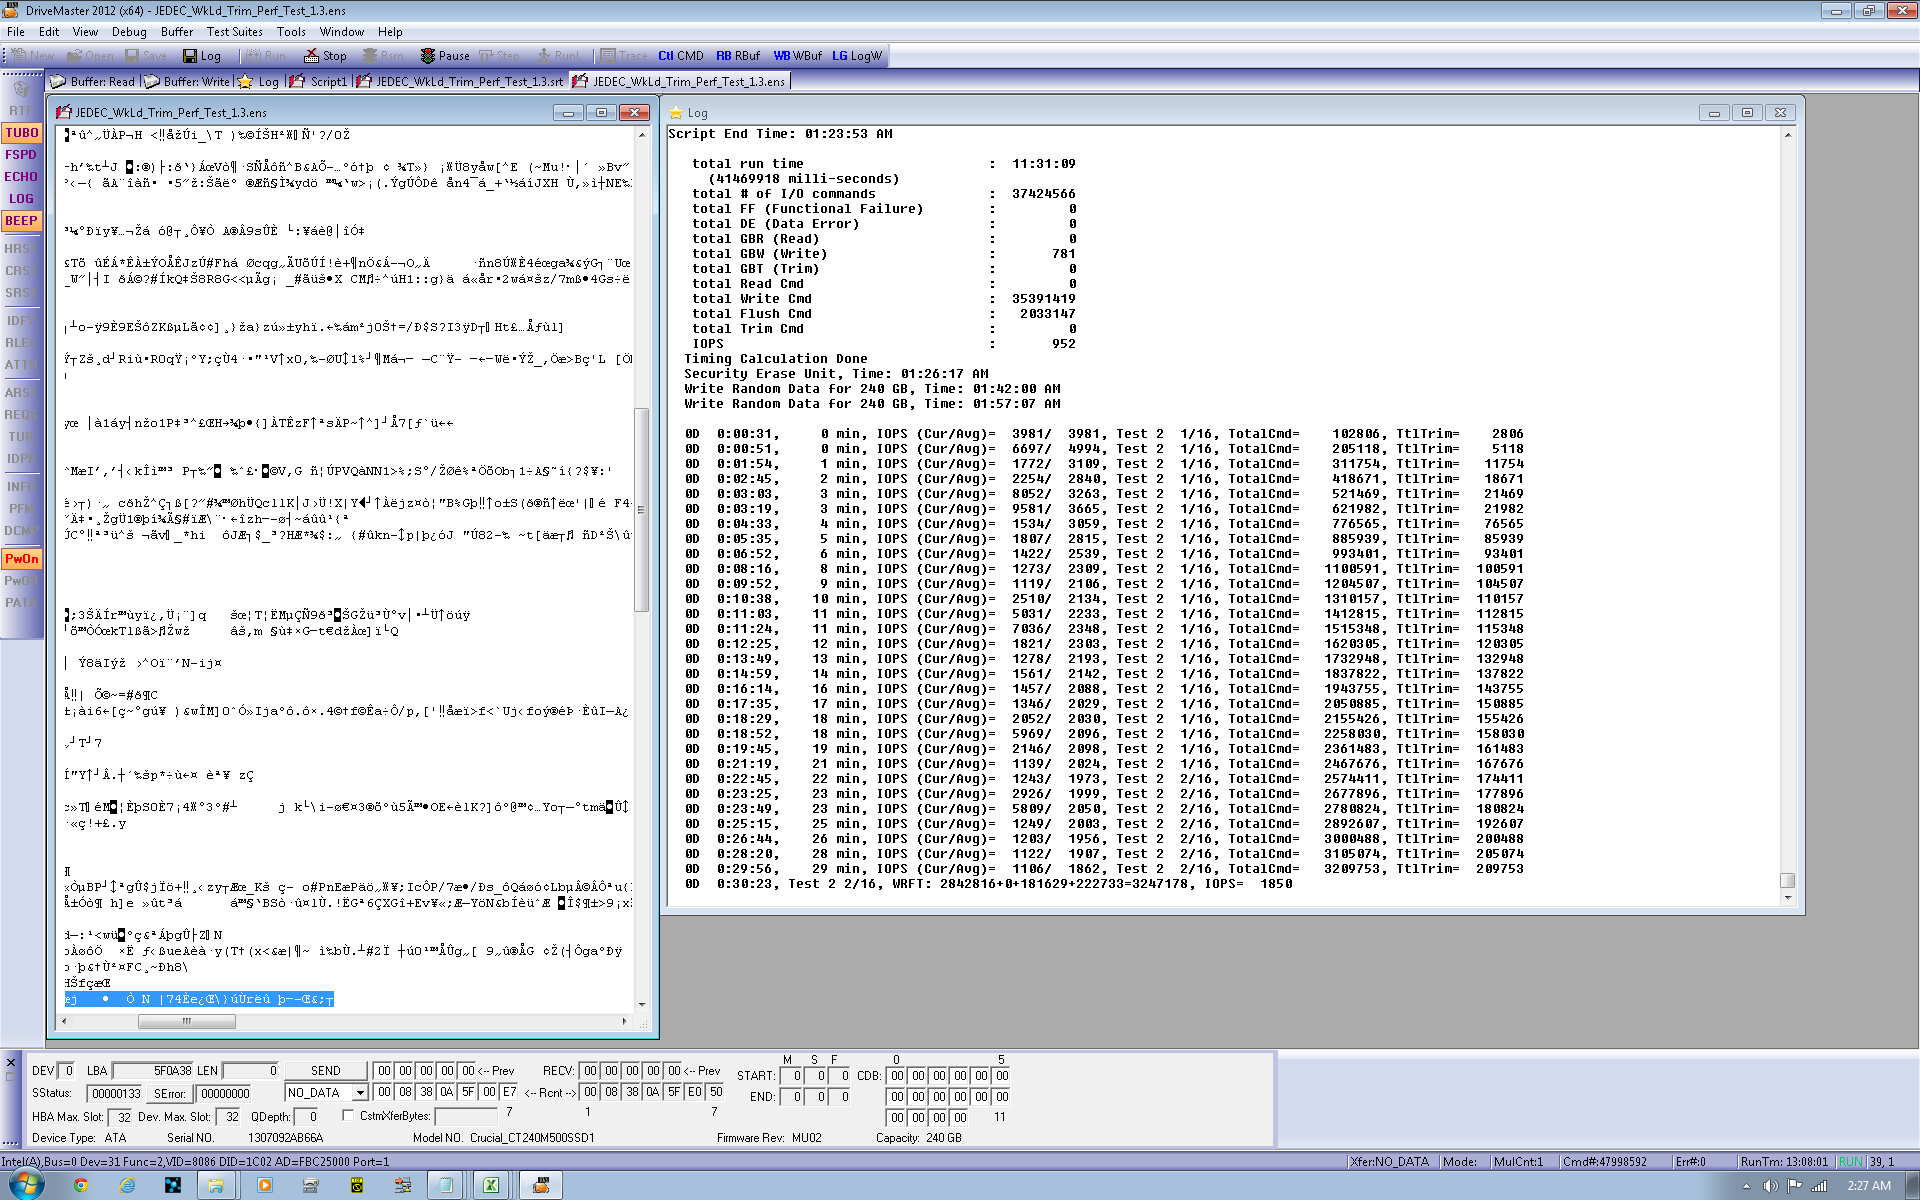
Finally, I want to introduce a new test I've been working on using JEDEC's 218A consumer workload trace to create a TRIM benchmark. It's not a neatly-packaged little utility you can run at home. Rather, this is a test scripted in ULINK's DriveMaster 2012 software and hardware suite.
DriveMaster is used by most SSD manufacturers to create and perform specific metrics. It's currently the only commercial product that can create the scenarios needed to validate TCG Opal 2.0 security, but it's almost unlimited in potential applications. There are various hardware components associated with the platform, such as a SATA/SAS power hub that allows the benchmarked drive to be power-cycled independently of the platform. Much of the benefit tied to a solution like DriveMaster is its ability to diagnose bugs, ensure compatibility, and issue low-level commands. In short, it's very handy for the companies actually building SSDs. And if off-the-shelf scripts don't do it for you, make your own. There's a steep learning curve, but the C-like environment and command documentation gives you a fighting chance.
This product also gives us some new ways to explore performance. Testing the TRIM command is just the first example of how we'll be using ULINK's contribution to the Tom's Hardware benchmark suite.
The suite ships with some built-in scripts, but also contains its own scripting language for extensibility and customization. This particular test uses JEDEC's published master trace of consumer I/O activity (similar to our Tom's Hardware Storage Bench trace). The read commands are removed from the trace, leaving write, flush, and TRIM commands. After secure erasure and writing preparatory data, the test commences. The trace is played against the drive four times using NCQ with and without TRIM, and DMA with and without TRIM. IOPS are measured and averaged every 100,000 commands.
On a 256 GB drive, each iteration writes close to 800 GB of data, so running the JEDEC TRIM test suite once on a 256 GB SSD generates almost 3.2 TB of mostly random writes (it's 75% random and 25% sequential). By the end of each run, over 37 million write commands are issued. If that sounds like a lot of storage traffic, it is.
The first two tests employ DMA to access the storage, while the last two use Native Command Queuing. Since most folks don't use DMA with SSDs (aside from some legacy or industrial applications) we don't concern ourselves with those. It can take up to 96 hours to run one drive through all four runs, though faster drives can cut the time in half, roughly. Because so much information is being written to an already-full SSD (the drive is filled before each test, and then close to 800 GB are written per iteration), SSDs that perform better under heavy load fare best. Without TRIM, on-the-fly garbage collection becomes a big contributor to high IOPS. With TRIM, 13% of space gets TRIM'ed, leaving more room for the controller to use for maintenance operations.
Take everything that was beautiful about Crucial's M500, add more capacity, and then more performance. The M550 sets its predecessor's shortcomings right. Excessive redundancy and conservative engineering resulted in the M500's modest performance. A year later, the M550 sports an updated controller and firmware, putting it in elite company.
The 512 GB M550 is as quick as the 1024 GB model, but sells for $200 less, making it more palatable to mainstream audiences.
Get Tom's Hardware's best news and in-depth reviews, straight to your inbox.
TRIM Testing
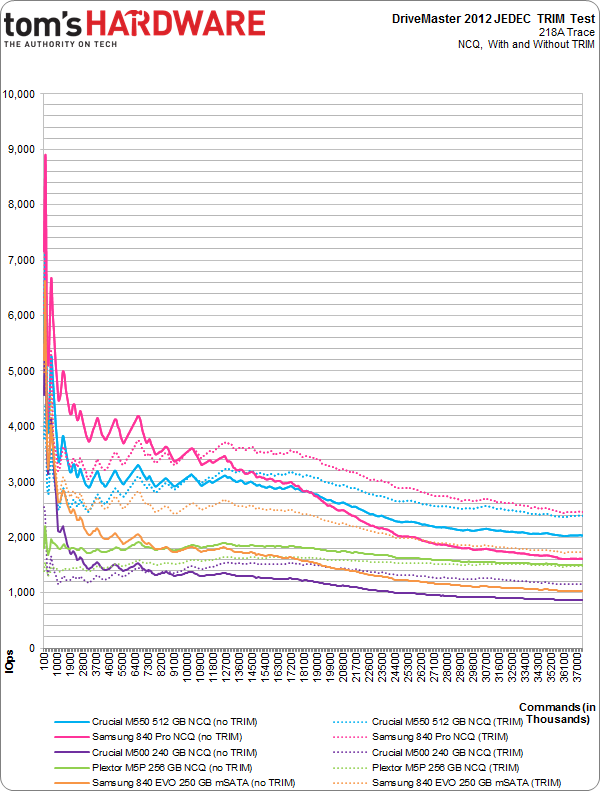
Here's the chart derived from our DriveMaster JEDEC TRIM test data. We have the new M550s, Samsung's venerable 840 Pro at 256 GB, Crucial's more mainstream M500 (240 GB), Plextor's M5P, and the 250 GB 840 EVO. Each device's NCQ-based test is plotted. The solid line represents average IOPS every 100,000 commands, but without TRIM. The hashed line represents performance every 100,000 commands with TRIM. In each case, the workload is mixed in with tons of small, random writes.
Since performance is measured over each 100,000-command segment, time is factored out of the above chart. This rolling average also hides the trace's peaky nature.
You can see the 512 GB M550 start out with lower peak performance in non-TRIM testing. Add TRIM to the mix, though, and it ends up as quick as Samsung's 840 Pro.
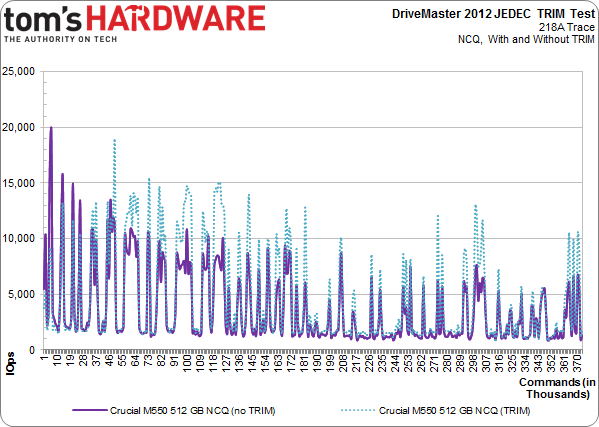
But I also want the instantaneous average of our TRIM testing. So, how does the drive fare servicing writes with and without TRIM during each 100,000-command window? The purple line represents IOPS across the entire trace, without TRIM. The teal line is with TRIM.
Notice that the peaks are higher with TRIM support enabled. This is how a desktop-oriented drive should behave. About 13% of the drive's span is freed by the command during our test, giving Marvell's controller more available blocks to write to. Without TRIM, the processor is stuck manually collecting garbage, juggling data in read/modify/erase cycles.
TRIM mitigates this, allowing the operating system to tell the drive when a range of LBAs is no longer needed. The alternative is letting the drive handle its own garbage collection as the operating system writes to LBAs already occupied by data.
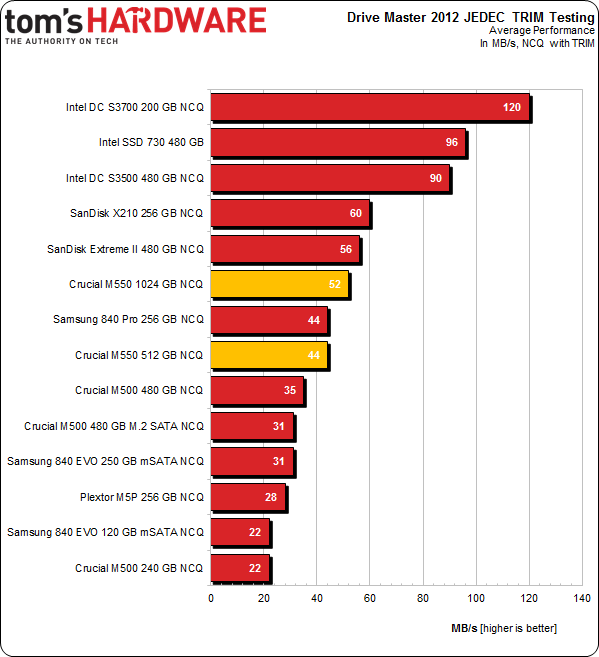
This chart shows throughput in our TRIM-enabled test. The M550s do well, despite their lack of additional over-provisioning. See how soundly the 512 GB M550 routs the 480 GB M500?
Current page: Results: TRIM Testing
Prev Page Results: PCMark 7 And PCMark Vantage Next Page Results: Power Consumption-
ikyung Heard rumors of Samsung planning to market the 850 with aggressive pricing this year. Would like to see Crucial and Samsung duke it out in pricing.Reply -
cryan ReplyHeard rumors of Samsung planning to market the 850 with aggressive pricing this year. Would like to see Crucial and Samsung duke it out in pricing.
They already have IMHO. The Samsung 840 EVO is significantly cheaper than it was at launch. It and the M500 have seemed to move in lockstep. Along the way, we've seen other manufacturers follow suit. Even Intel's 530 series, which has been on the more expensive side of mainstream products has been seen for just $140 for the 240 GB version here in the State.Regards,Christopher Ryan -
venk90 INSANELY GOOD DEAL ON AMAZON ! The 512 GB SSD is listed at 169$ incorrectly ! Grab them before they change it. I ordered 20 myself ! Will e-bay all of it or feel bad and return it to Amazon !Reply -
cryan ReplyI just splashed $250 (delivered to Oz) on a M500 480GB mSATA, eh, can't complain.
I hope Crucial continues to sell the M500 right where it is. The deals are just too good, and it'd be truly sad were Crucial/Micron to up the price on us.And they're not slow. I know it seems like they're sub par compared to some of the last few drives we've tested, but the reality is most users are never going to notice the speeds between different SSD models. The only exception is jumping from an older SATA II drive to a modern SATA III SSD. Even then, you'd need solid hardware in the system.Regards,Christopher Ryan -
Ankursh287 M500 available at $240 (amazon)..damn good drive for the price, performance difference between M500 , M550 & 840/840 pro won't visible to normal user.Reply -
Nada190 When I look at SSD's I want price to performance because I won't even notice a difference.Reply -
Drejeck Specifically for gaming which would be the best? All sort of tricks are allowed, from tweaks to samsung's magician (ram caching).Reply -
RedJaron ReplyOf course, we're in the throes of post-launch pricing. In a few weeks, it's possible that the gap between M500 and M500 will narrow.
Typo on the last page. One of those should be 550.
Happy to see Crucial with this update. I'm with a lot of people, you don't see a difference in SSD performance outside benchmarks. Give me something reasonably fast with great durability and I'm sold. With all this talk of the maturing of 20nm manufacturing, I'd love to see an M500 V2 with less overprovisioning.
-
gizmoguru Hay Tom's the chart for Sequential Reads Benchmark is labled "Random Writes", please correctReply


