Enermax MaxRevo 1800W Power Supply Review: Big Wattage and Noise to Match
Why you can trust Tom's Hardware
Protection Features, DC Power Sequencing, Cross-Load Tests and Infrared Images
Protection Features
Check out our PSUs 101 article to learn more about PSU protection features.
| Protection Features (230V) | |
| OCP | 12V1: 25.68A (128.4%), 11.83V 12V2/3/4/5/6: > 42A (> 120%) 5V: 40.3A (161.2%), 5.042V 3.3V: 40.5A (162%), 3.288V 5VSB: 7A (175%), 4.983V |
| OPP | 1914W (106.33%) |
| OTP | ✓ (181°C @ secondary side) |
| SCP | 12V: ✓ 5V: ✓ 3.3V: ✓ 5VSB: ✓ -12V: ✓ |
| PWR_OK | Not Accurate and lower than 16ms |
| NLO | ✓ |
| SIP | Surge: MOV Inrush: NTC Thermistor & Bypass Relay |
The first 12V rail has a low OCP triggering point, since it only feeds the 24-pin ATX connector. The other 12V rails are much stronger since they have to cope with more demanding connectors.
The OCP on the minor rails is set quite high and the same applies to the 5VSB rail, as well. On the contrary, the OPP is set quite low since the platform is already close to its limits, with 1800W output. Finally, the over temperature protection is present and working well, while the power ok signal is inaccurate and lower than 16ms, as the ATX spec requires.
DC Power Sequencing
According to Intel’s most recent Power Supply Design Guide (revision 1.4), the +12V and 5V outputs must be equal to or greater than the 3.3V rail at all times. Unfortunately, Intel doesn't mention why it is so important to always keep the 3.3V rail's voltage lower than the levels of the other two outputs.
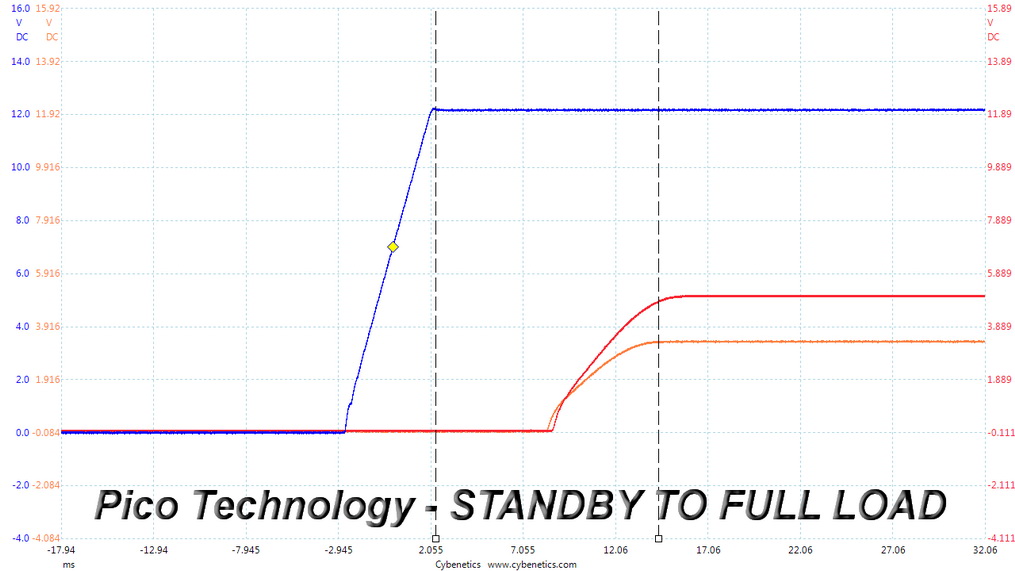
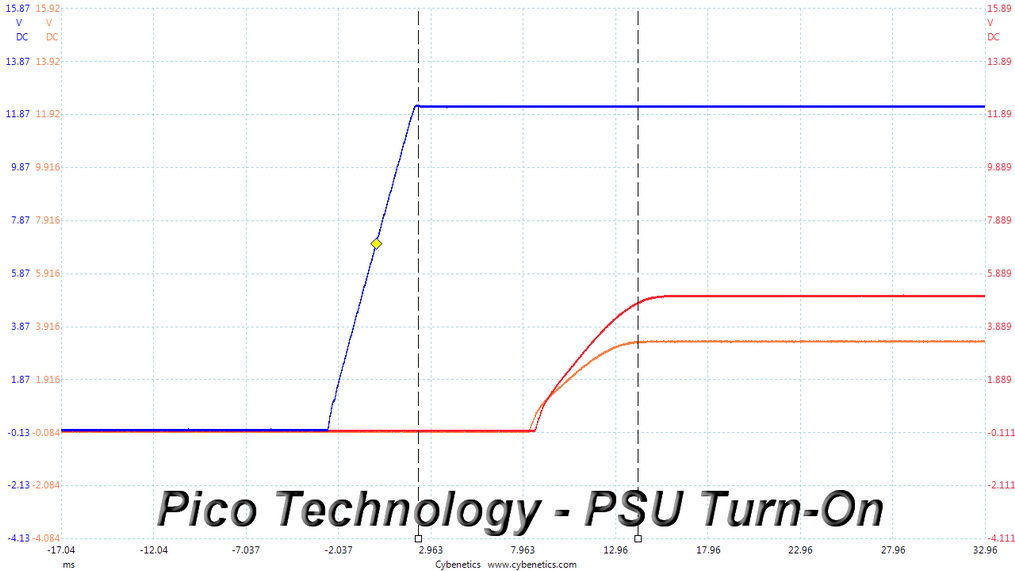
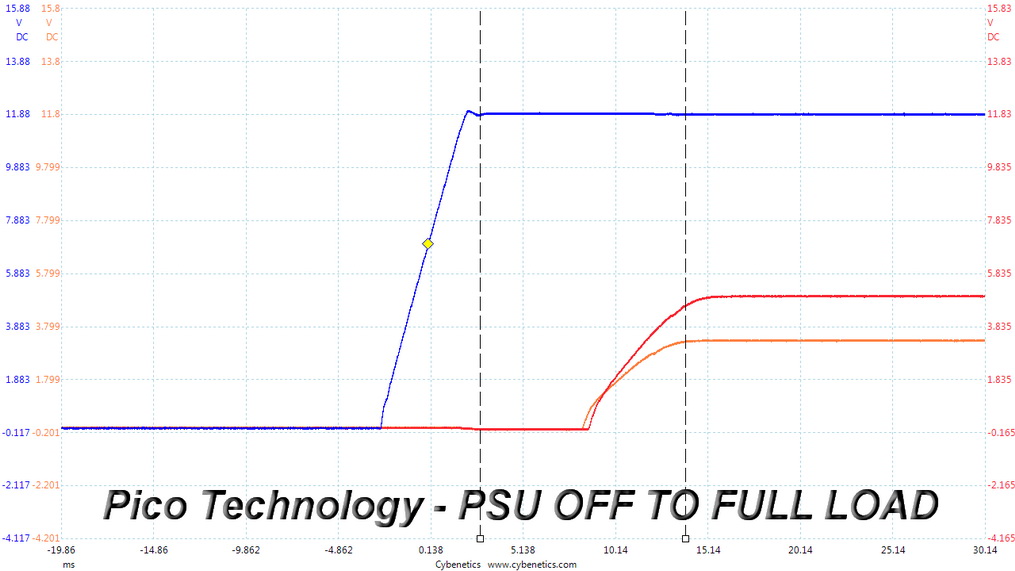
For a short period, the 3.3V rail is higher than 5V, as you can see in the screenshots above. In our opinion, this won't be a problem though, in this unit at least, since it doesn't last for more than 1ms.
Cross Load Tests
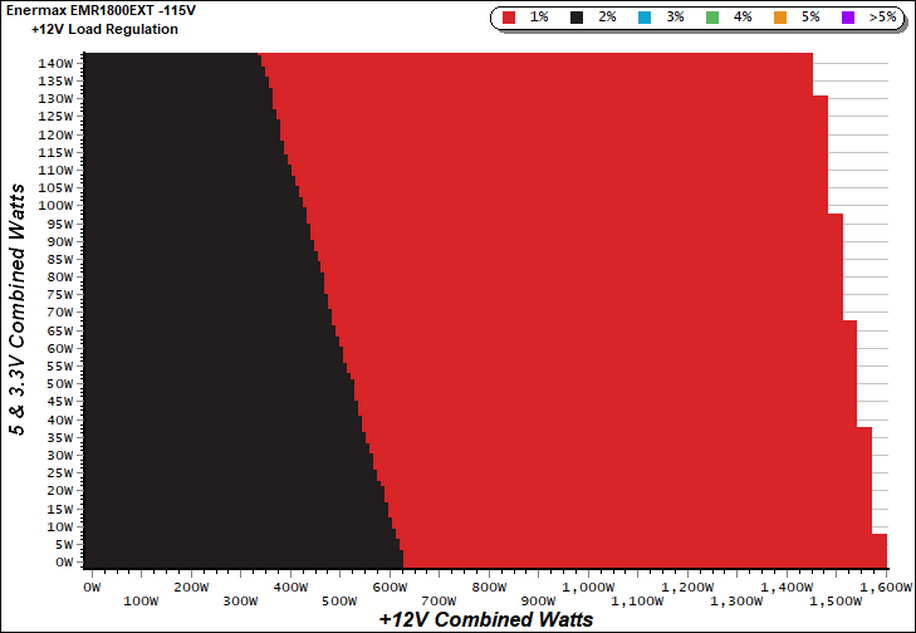
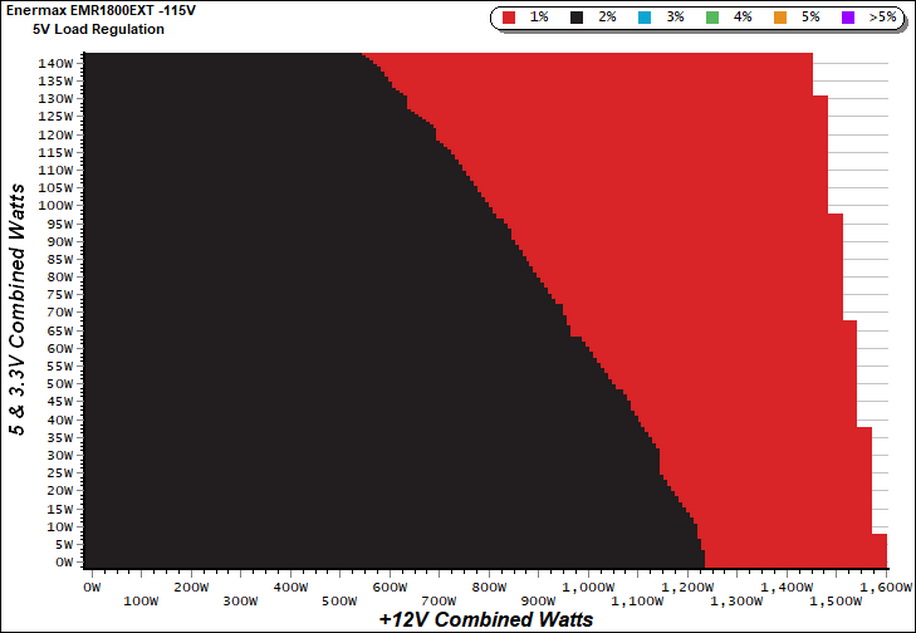
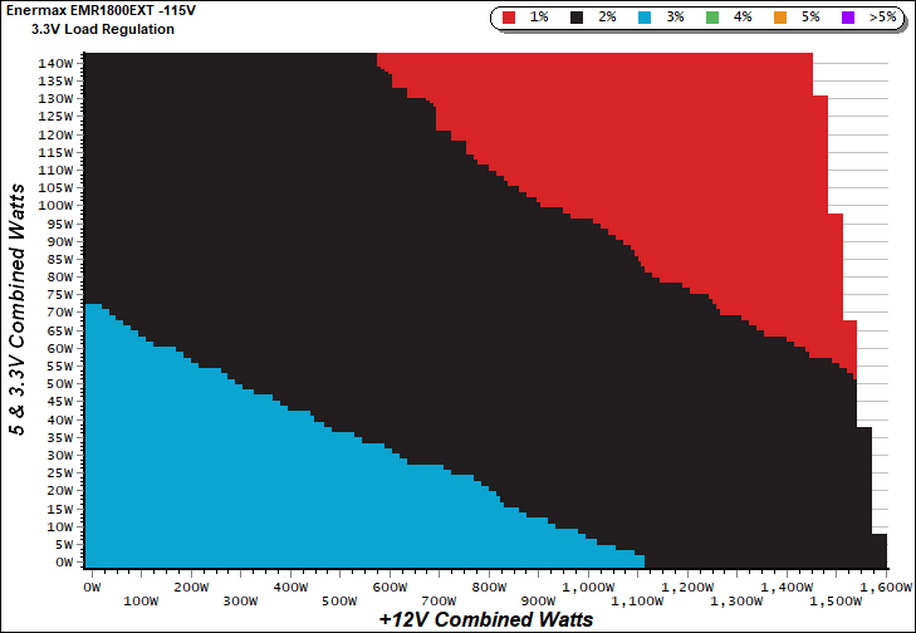
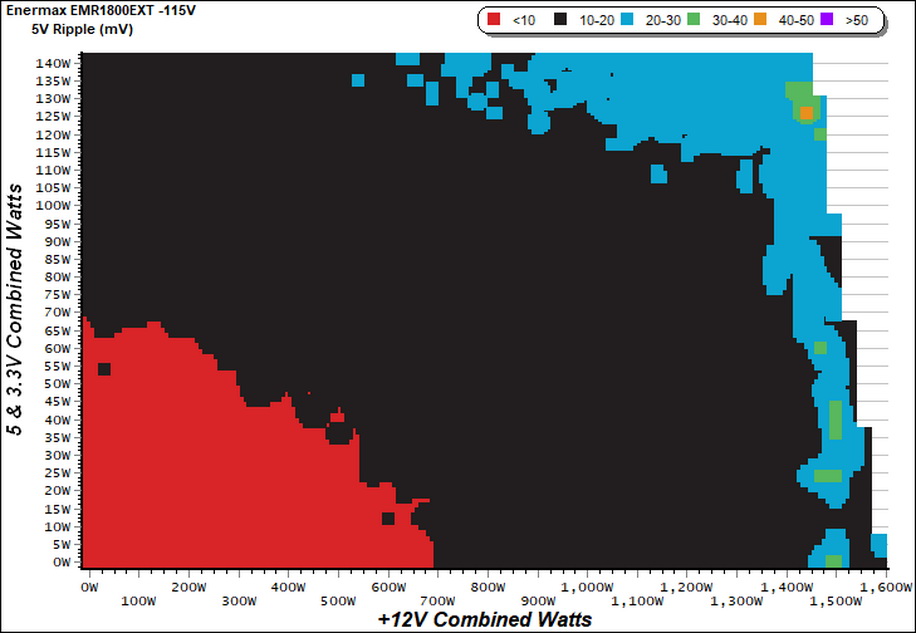
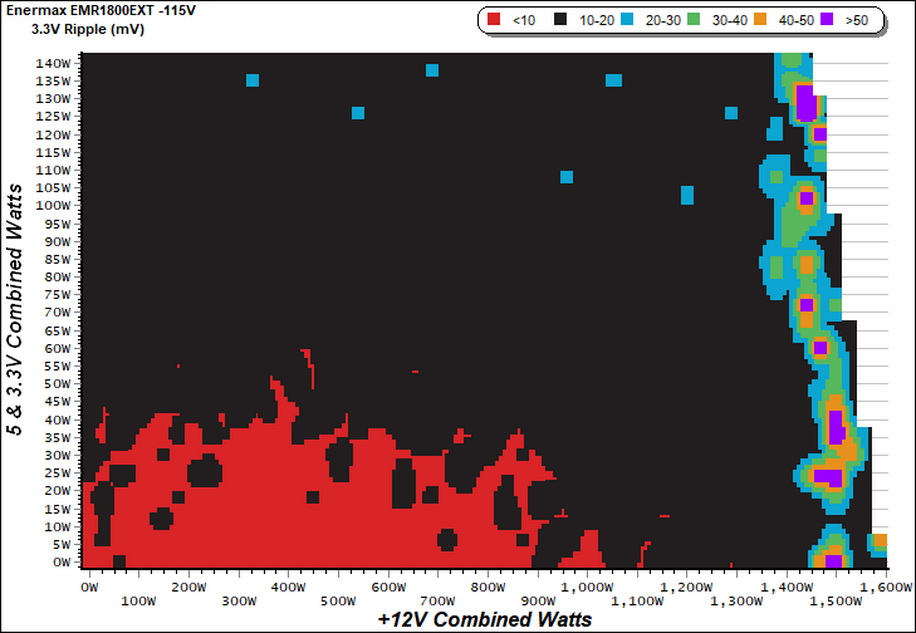
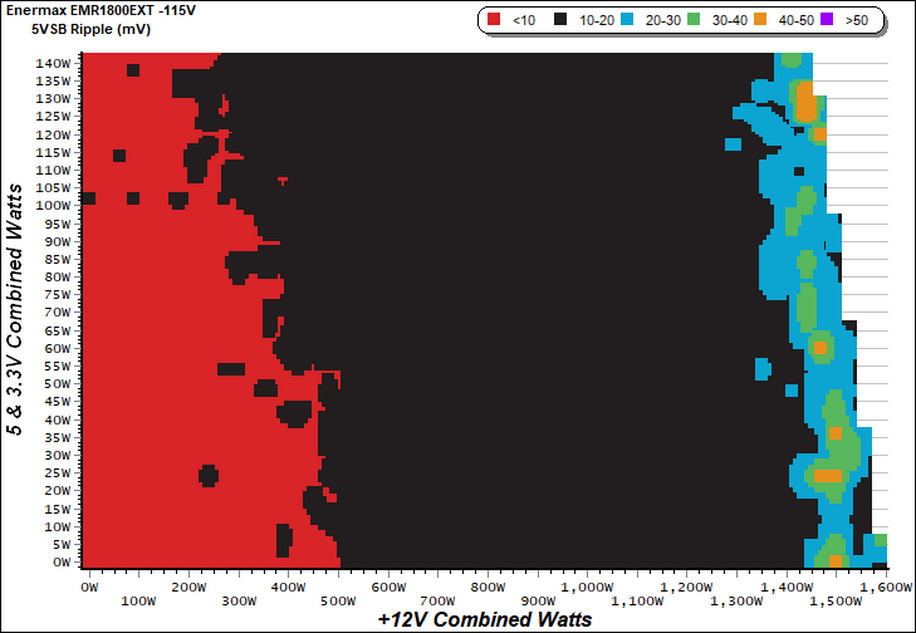
To generate the following charts, we set our loaders to auto mode through custom-made software before trying more than 25,000 possible load combinations with the +12V, 5V, and 3.3V rails. The deviations in each of the charts below are calculated by taking the nominal values of the rails (12V, 5V, and 3.3V) as point zero. The ambient temperature during testing was between 30°C (86°F) and 32°C (89.6°F).
Load Regulation Charts
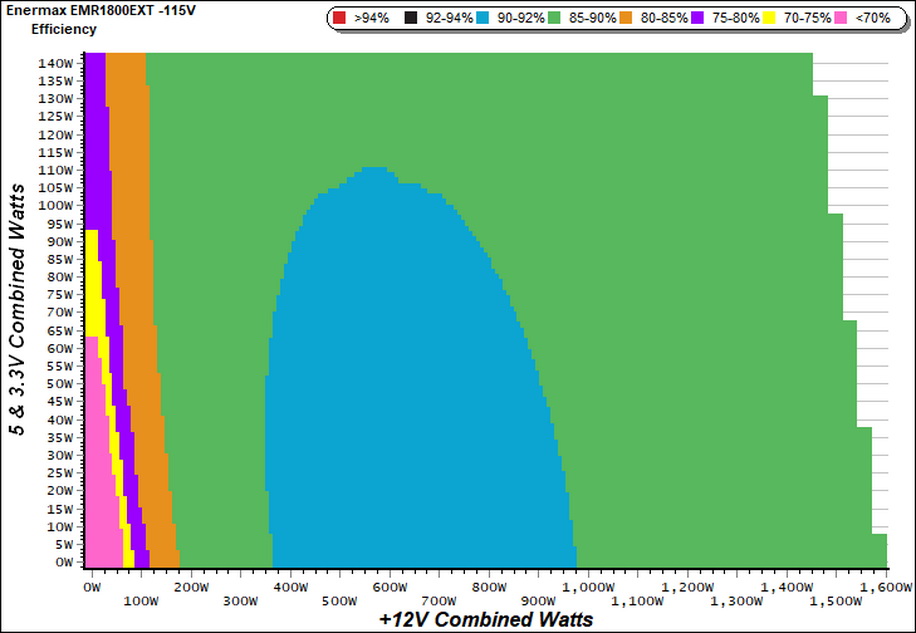
Efficiency Chart
We would like to see higher efficiency under mid loads, ideally within the 92-94% range.
Get Tom's Hardware's best news and in-depth reviews, straight to your inbox.
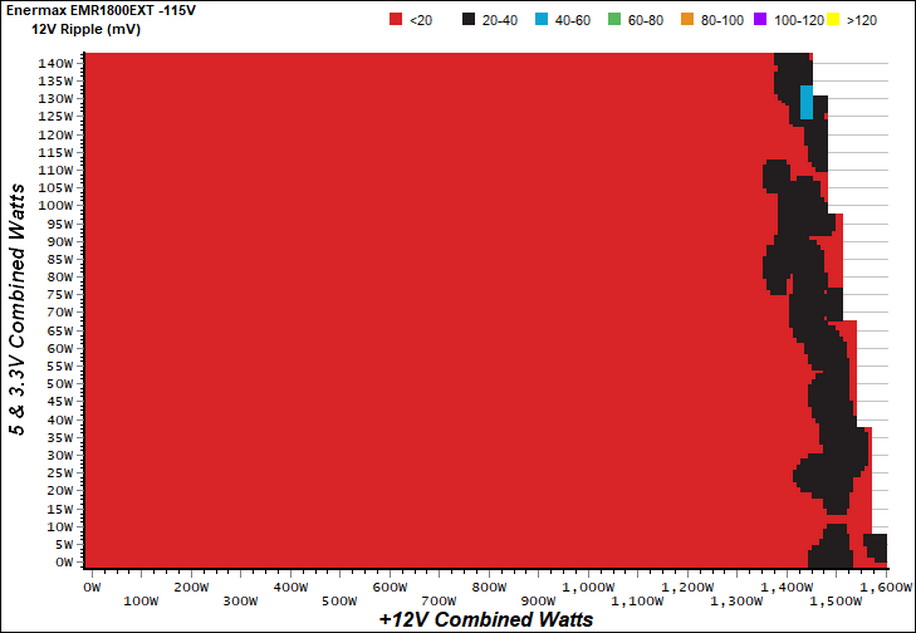
Ripple Charts
The lower the power supply's ripple the more stable the system will be and less stress will be also applied to its components.
Infrared Images
We apply a half-load for 10 minutes with the PSU's top cover and cooling fan removed before taking photos with a modified FLIR E4 camera able to deliver an IR resolution of 320x240 (76,800 pixels).
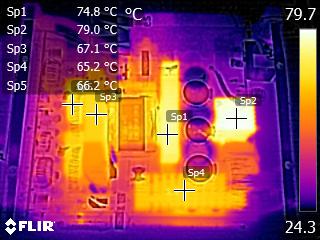
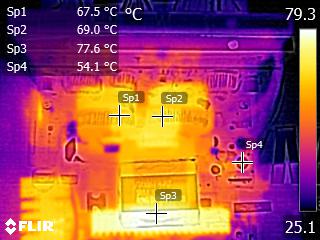
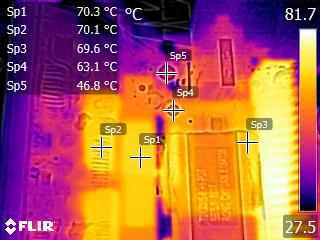
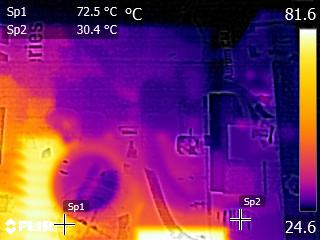
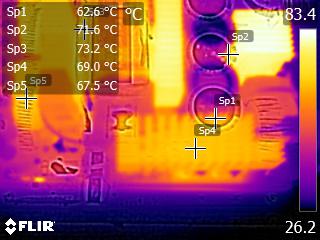
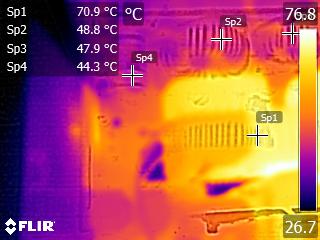
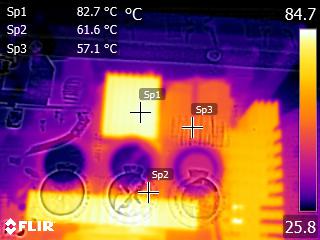
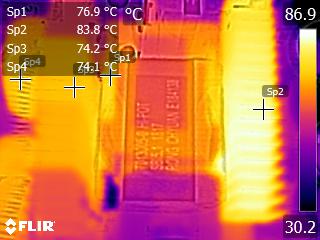
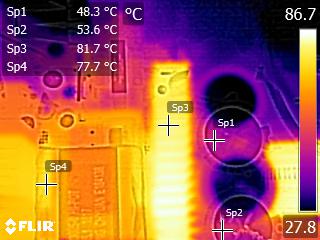
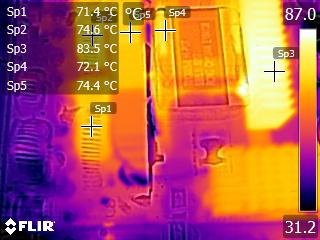
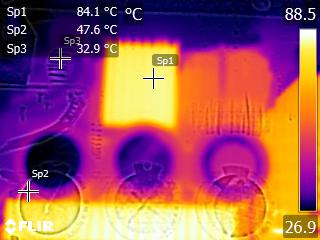
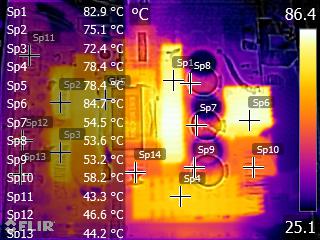
The temperatures at the PSU's internals are at normal levels, given the applied load and operating conditions, so there is no need for such an aggressive fan speed profile.
MORE: Best Power Supplies
MORE: How We Test Power Supplies
MORE: All Power Supply Content
Current page: Protection Features, DC Power Sequencing, Cross-Load Tests and Infrared Images
Prev Page Load Regulation, Hold-Up Time, Inrush Current, Efficiency and Noise Next Page Transient Response Tests, Ripple Measurements and EMC Pre-Compliance Testing
Aris Mpitziopoulos is a contributing editor at Tom's Hardware, covering PSUs.
