Efficiency Comparison: Sandy Bridge Vs. Intel And AMD CPUs
The second-generation Core processors arrived with a bang, but what sort of progress can you expect in the performance per watt department? We compare Core i5/i7-2x00 to AMD's Phenom with four and six cores, as well as previous-gen parts from Intel.
Integrated Graphics Efficiency Results
Single-Threaded Workloads
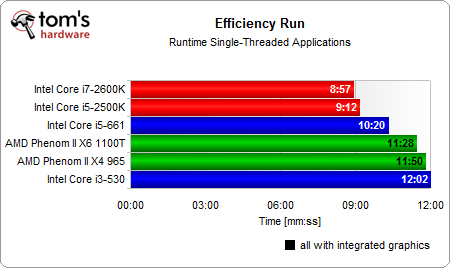
This is the total runtime of all single-threaded workloads in our efficiency test. As mentioned before, the processors with the highest clock speeds do best and require the least time.
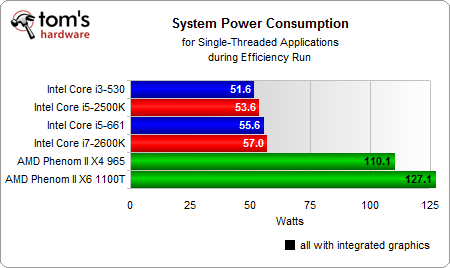
This is the average system power consumption during the single-threaded application testing. Intel has better power management that allows individual cores to switch off when they’re not needed. Let’s see what this means for total power consumption.
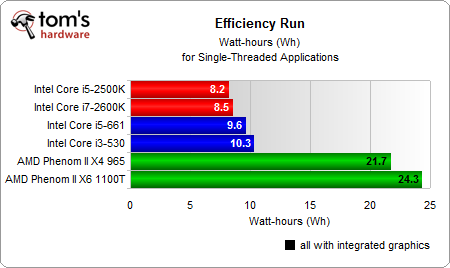
Our few single-threaded applications require less than 9 watt-hours of power on the Sandy Bridge systems, 9.6-10.3 wh on the Clarkdale-based Core i3/i5 dual-core chips and more than 20 watt-hours on the AMD machines.
This chart does not take performance into account, but only measures the total power required to finish running all single-threaded workloads.
Multi-Threaded Workloads
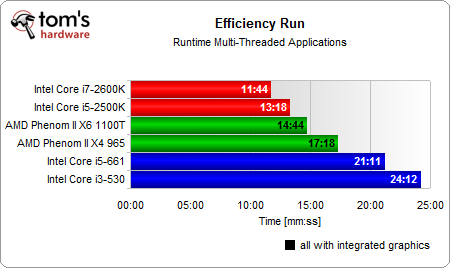
Once we switch to the multi-threaded applications, the results look much better for AMD--mainly because the company is able to use parallelism to improve its performance standing. However, Sandy Bridge beats Thuban's six cores and Deneb's four.
Get Tom's Hardware's best news and in-depth reviews, straight to your inbox.
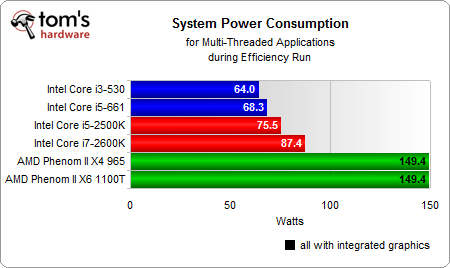
The average power consumption is much higher now on the Sandy Bridge systems, as all cores are now active, rather than just one. Still, the average power is still amazingly low.
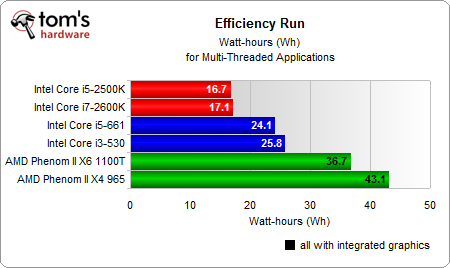
These results show how much faster additional execution cores can be when you're looking at heavily threaded workloads. Processors like the Phenom II X6 can complete the workload much quicker than the Phenom II X4 thanks to the two additional cores. As a result, the power required to complete the task is lower.
Full Efficiency Workload
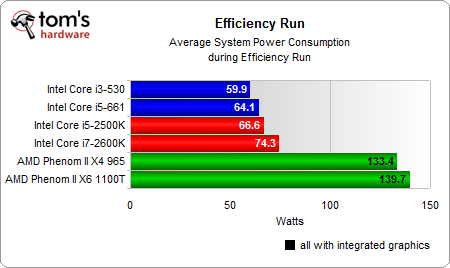
This is the average power for the full efficiency workload, combining the single-threaded and the multi-threaded sections.
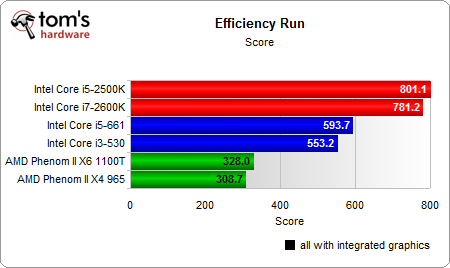
Relating performance to power usage leads to these scores. Keep in mind that we’re looking at systems with integrated graphics here, which means that the Intel processors only include two cores. They do rather well, despite offering less performance. This is the case because they use half of the power of AMD's systems, while delivering more than half the performance. The new Sandy Bridge platforms are basically free of competition.
Current page: Integrated Graphics Efficiency Results
Prev Page Power Consumption Results Next Page Discrete Graphics Efficiency Results