Super Flower Leadex Titanium 1000W PSU Review
Super Flower was one of the first companies to release an 80 Plus Titanium-rated PSU. Following the ultra-high-capacity SF-1600F14H unit, the company released two more Titanium PSUs, one of which we're evaluating today.
Why you can trust Tom's Hardware
Cross-Load Tests And Infrared Images
Our cross-load tests are described in detail here.
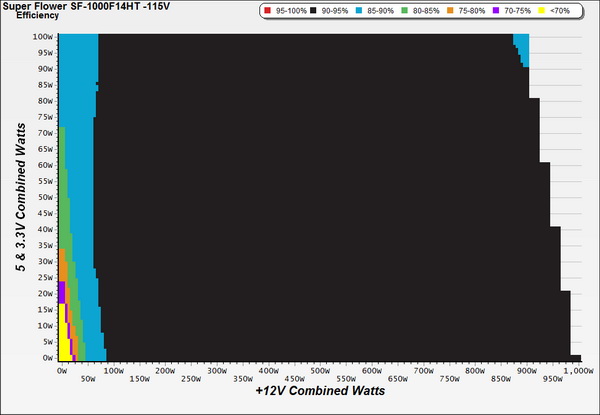
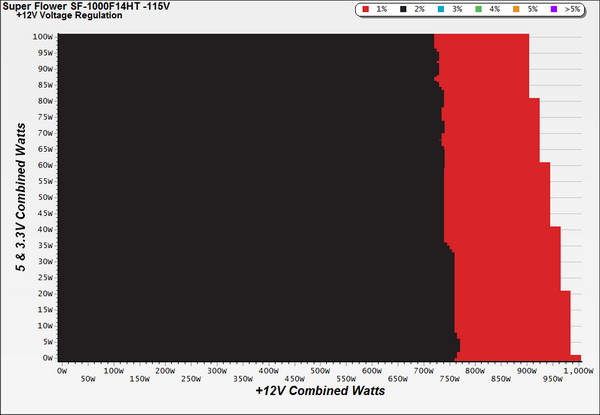
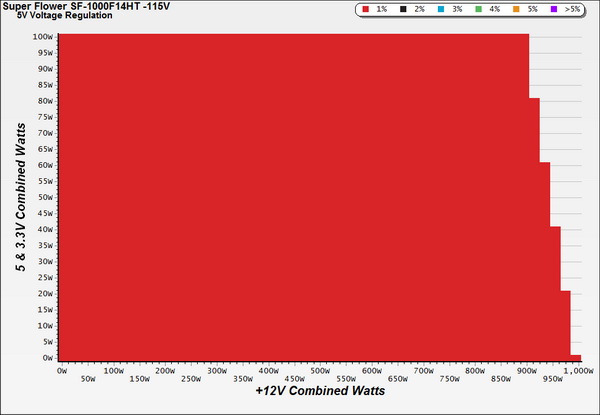
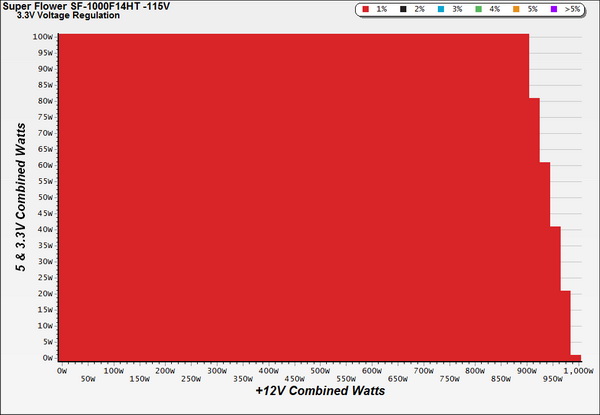
To generate the following charts, we set our loaders to auto mode through our custom-made software before trying more than 1500 possible load combinations with the +12V, 5V and 3.3V rails. The load regulation deviations in each of the charts below were calculated by taking the nominal values of the rails (12V, 5V and 3.3V) as point zero.
Load Regulation Charts
Efficiency Chart
Under more than 100W of load, the SF-1000F14HT PSU easily delivers well above 90 percent efficiency. The above graph clearly shows the capabilities of a Titanium-rated PSU. If you want to power a system that works around the clock, then such an efficient PSU will eventually save you money. On top of that, thanks to its limited thermal output, it won't overburden your machine's cooling system.
Ripple Charts
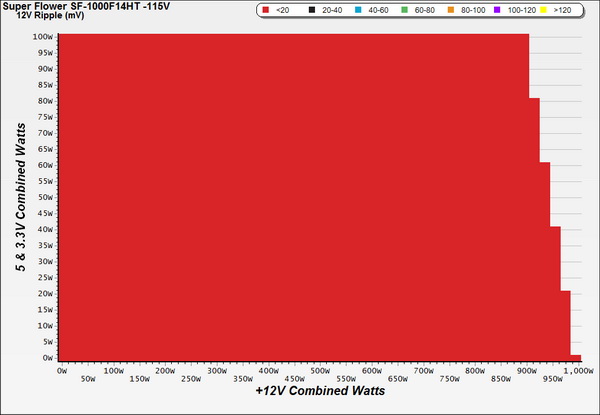
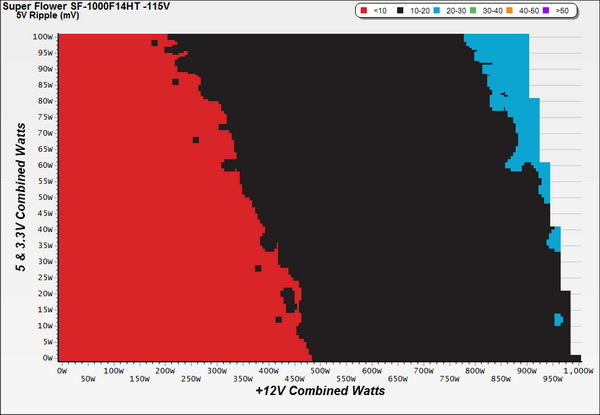
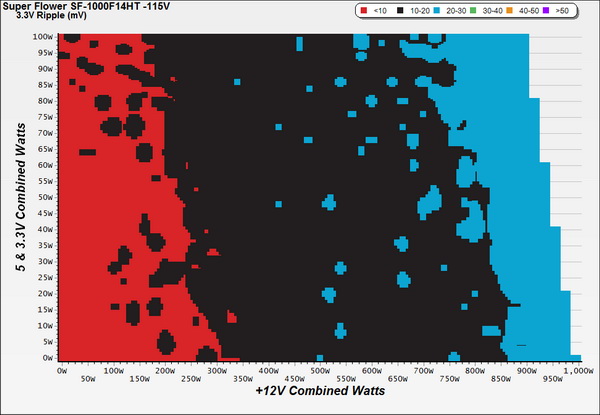
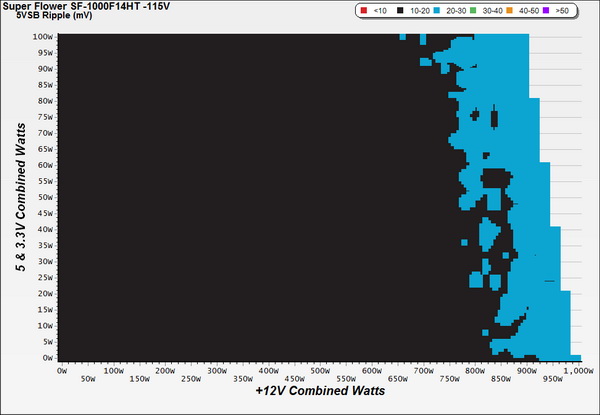
Infrared Images
Toward the end of the cross-load tests, we took some photos of the PSU with our modified FLIR E4 camera that delivers 320x240 IR resolution (76,800 pixels).
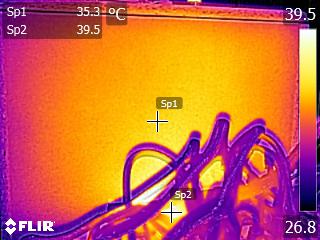
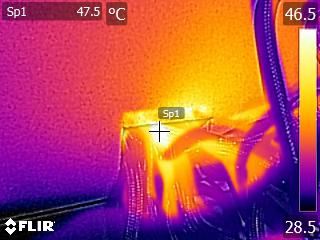
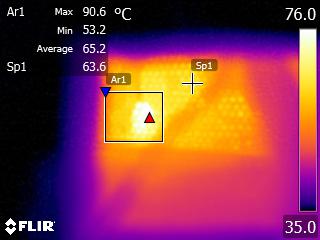
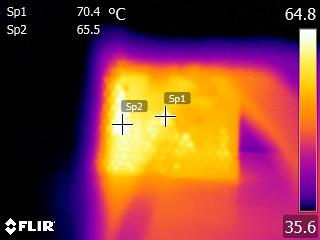
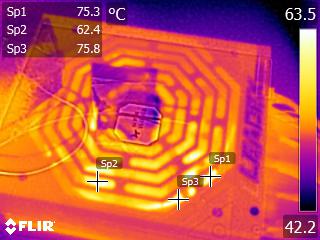
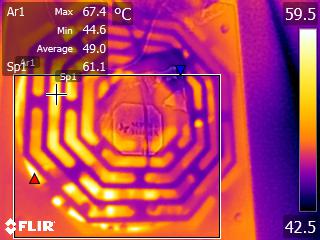
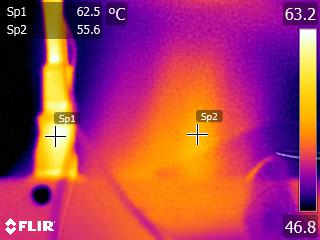
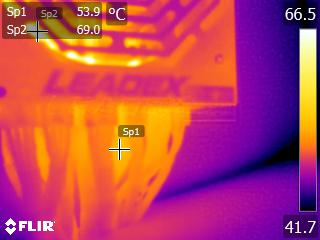
We wanted to see how this PSU copes under high ambient temperatures, so we applied really tough conditions inside our hot-box. The highest temperature that our thermal camera recorded at the internals of the PSU barely exceeded 90 degrees Celsius, a modest reading given that in other PSUs we typically measure over 100° C.
Get Tom's Hardware's best news and in-depth reviews, straight to your inbox.
Current page: Cross-Load Tests And Infrared Images
Prev Page Efficiency, Temperature And Noise Next Page Transient Response Tests
Aris Mpitziopoulos is a contributing editor at Tom's Hardware, covering PSUs.
-
AnimeMania Are modular cables interchangeable between the different power supply vendors or will this happen in the future.Reply -
blazorthon ReplyAre modular cables interchangeable between the different power supply vendors or will this happen in the future.
Some might be, but generally, don't expect interchangeable cables. There are many different implementations for the connectors for one reason or another. -
Aris_Mp ReplyAre modular cables interchangeable between the different power supply vendors or will this happen in the future.
It highly recommended to assume that they are not, even when the PSU is made by the same manufacturer.
-
Aris_Mp ReplySo, ah, what did you use as a price?
We used the price sold in EU stores, excluding the VAT of course. -
babernet_1 Reply17269051 said:So, ah, what did you use as a price?
We used the price sold in EU stores, excluding the VAT of course.
Which is? I looked and saw a price of 200 euro. That's about $220. Does it include VAT? -
babernet_1 Reply17273936 said:yes, in EU most stores include VAT in their prices.
My gosh! I just want to know in dollars what your estimated price was!
:??: -
Andi lim Using a bunch of KRG series capacitor for extra suppress ripple in Titanium PSU ?Reply
The Analogy : you want to build a super car, lets say Nissan GTR, but at the end you decide to use some cheap parts from Datsun on to your car, hahahaha.
The Question is, How long this PSU will stay in titanium level efficiency ?
Let's say after a year usage, the standard and cheap KRG capacitor will slowly increace the ESR, leak current dan temperature. at that time, this PSU efficient will go to platinum level or below ? Only time will tell.
