Get Maximum Fortnite Performance: 'Epic' Mode With 10 Graphics Cards

The Best Quality Settings for 60 FPS Performance

Because the graphics presets have a greater impact on performance than we expected, we revisited the slowest card in our lineup, MSI's Radeon RX 460 OC 2GB, and reran all of our tests using the game's Auto preset. For each configuration, we also measured performance with and without Show Grass enabled.

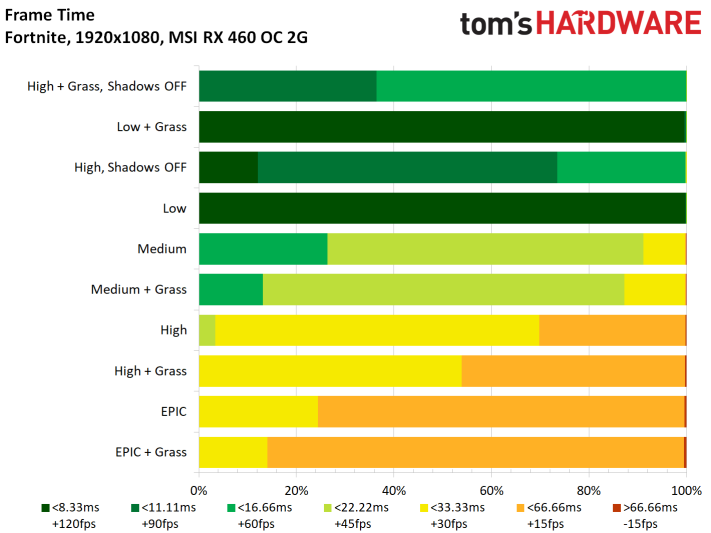
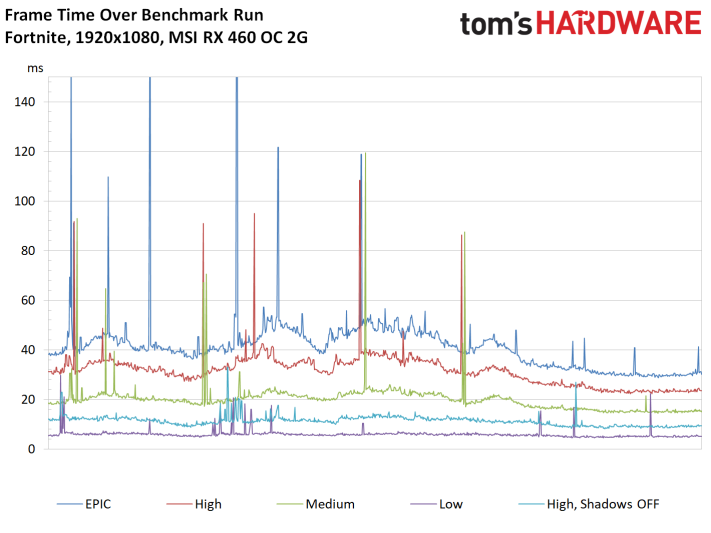
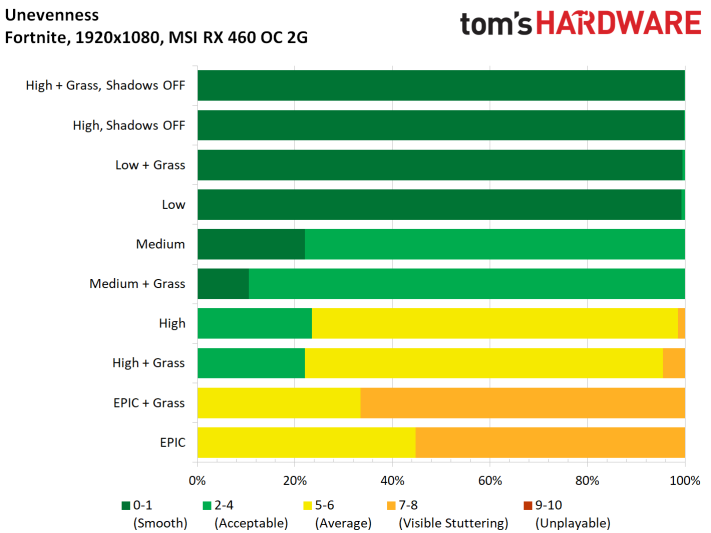
We did a bit of research on the best settings for this card, aiming for a minimum frame rate of 60 FPS. Those turned out to be the High preset with Show Grass enabled, but Shadows set to Off. Shadows seem to affect frame rates most, so dial that option back (or deactivate it altogether) if you're trying to improve otherwise marginal performance.

MORE: Final Fantasy XV Performance Review

MORE: Project CARS 2 Performance Review

MORE: Star Wars Battlefront II Performance Review

Image
Fortnite
.
  • Gillerer
    I have a couple of suggestion to improve the readability of the CPU load chart - and make it more informative:

    *

    1) Analyze the CPU thread loads in descending order:

    ■Record loads per CPU thread for each point in time.
    ■For each data point, assign the loads to graphs called "Highest loaded thread", "2nd highest", "3rd highest", ..., "Nth highest". (The spreadsheet function LARGE is your friend here.)
    ■Display these as you do now - only now the top bar displays how the highest loaded CPU thread - whatever thread it happened to be at the time - was doing throughout the entire test.
    I think this display would be better than the current one, because you could see the performance profile at a glance: the colors would shift from highly loaded at the top to slightly loaded at the bottom. E.g. you could easily see how much of the time 4 or more threads were highly loaded *at the same time*. The current graph doesn't show this definitely, since the high loads on the two threads may have occurred at different times in the test.

    *

    2) Change the value groups of the CPU load: 86% to 100% is much too wide of a gap. I'd like there to be a "fully loaded" group of 99 - 100% (maybe 98 - 100%, or 98.5 - 100%, depending on the precision of the data recording). I feel this is very important, since it would indicate an almost certain CPU bottleneck.
    Reply
  • Ninjawithagun
    WOW! I'm impressed by the fact that the GTX970 can still hang in there with playable frame rates at 1440P :D
    Reply
  • Jamie_69
    well, that's unequivocally false, but don't let that stop you posting nonsense - I'm sure it won't

    edit for context- the post i was replying to was a now deleted angry rant
    Reply
  • alextheblue
    Unreal Engine 4 does seem capable of exploiting the Ryzen CPU's resources, just not in a perfectly homogeneous fashion.
    Maybe some other UE4 game. Unless by "not in a perfectly homogeneous fashion" you actually meant "unevenly taxes CPU cores and manages to use perhaps 50% of available horsepower under the very best of circumstances, using a mid-tier chip paired with a top-end GPU at settings geared for extremely high framerates".

    Fortnite is deliberately built to NOT be CPU intensive so that it can run on a wide range of systems. You turn down the eye candy until your graphics can handle it, and your CPU is not a big concern.
    Reply
  • mario.abarth89
    Damn, from the title i hoped you took a mining mainboard and somehow made it work with all 10 at the same time :(
    Reply
  • jpe1701
    20862675 said:
    I have a couple of suggestion to improve the readability of the CPU load chart - and make it more informative:

    *

    1) Analyze the CPU thread loads in descending order:

    ■Record loads per CPU thread for each point in time.
    ■For each data point, assign the loads to graphs called "Highest loaded thread", "2nd highest", "3rd highest", ..., "Nth highest". (The spreadsheet function LARGE is your friend here.)
    ■Display these as you do now - only now the top bar displays how the highest loaded CPU thread - whatever thread it happened to be at the time - was doing throughout the entire test.
    I think this display would be better than the current one, because you could see the performance profile at a glance: the colors would shift from highly loaded at the top to slightly loaded at the bottom. E.g. you could easily see how much of the time 4 or more threads were highly loaded *at the same time*. The current graph doesn't show this definitely, since the high loads on the two threads may have occurred at different times in the test.

    *

    2) Change the value groups of the CPU load: 86% to 100% is much too wide of a gap. I'd like there to be a "fully loaded" group of 99 - 100% (maybe 98 - 100%, or 98.5 - 100%, depending on the precision of the data recording). I feel this is very important, since it would indicate an almost certain CPU bottleneck.

    I second a change with the load charts. Maybe I am just slow but I have a hard time reading them.
    Reply
  • buzznut47
    The graphics are pretty weak considering how much hardware processing power is required. Cartoonish really. I doubt that has much to do with Unreal Engine 4.

    Also the recommended specs from the game devs seem really underpowered. Would have liked to see just how low the settings would have to be under those conditions.
    Reply
  • interspool
    How were you able to set core affinities in the first place? It looks as though they've patched the game and it won't allow users to set affinity in Windows 10 or Process Lasso for the Fortnite exe. I want to lock the game to 4 cores, and use my other 4 cores for streaming. Someone please help!
    Reply