Why you can trust Tom's Hardware
AMD Ryzen 7 9800X3D Gaming Benchmarks — The TLDR
The particulars of our test setup are on page four. We used lifted power limits for the Intel processors, which result in higher power consumption and heat, but you get faster performance in exchange.
Nearly every title in our 13-game test suite benefits tremendously from 3D V-Cache, but this isn't the case with all games in the wild. Some games simply don't benefit as much, or at all, from the 3D V-Cache. This can be due to either the game code or a GPU limitation, though the higher 1% lows we measured throughout our suite will be very beneficial even when you are GPU-limited.
Below is the high-level view of gaming performance, using the geometric mean of our 13 gaming benchmarks at 1080p, which is then followed by the individual benchmarks further down the page. We're testing with an Nvidia GeForce RTX 4090 to reduce GPU-imposed bottlenecks as much as possible, and differences between test subjects will shrink with lesser cards or higher resolutions and fidelity.
Keep in mind that the RTX 5090 and RTX 5080 will likely arrive early next year. While 1080p gaming might seem a bit of a waste on the 4090, if the 5090 proves substantially faster — as we suspect it will — the gaps we're seeing here at 1080p would then extend into the 1440p and even 4K range. If you're after maximum gaming performance, the 9800X3D chip will almost certainly remain the best option for the coming year.
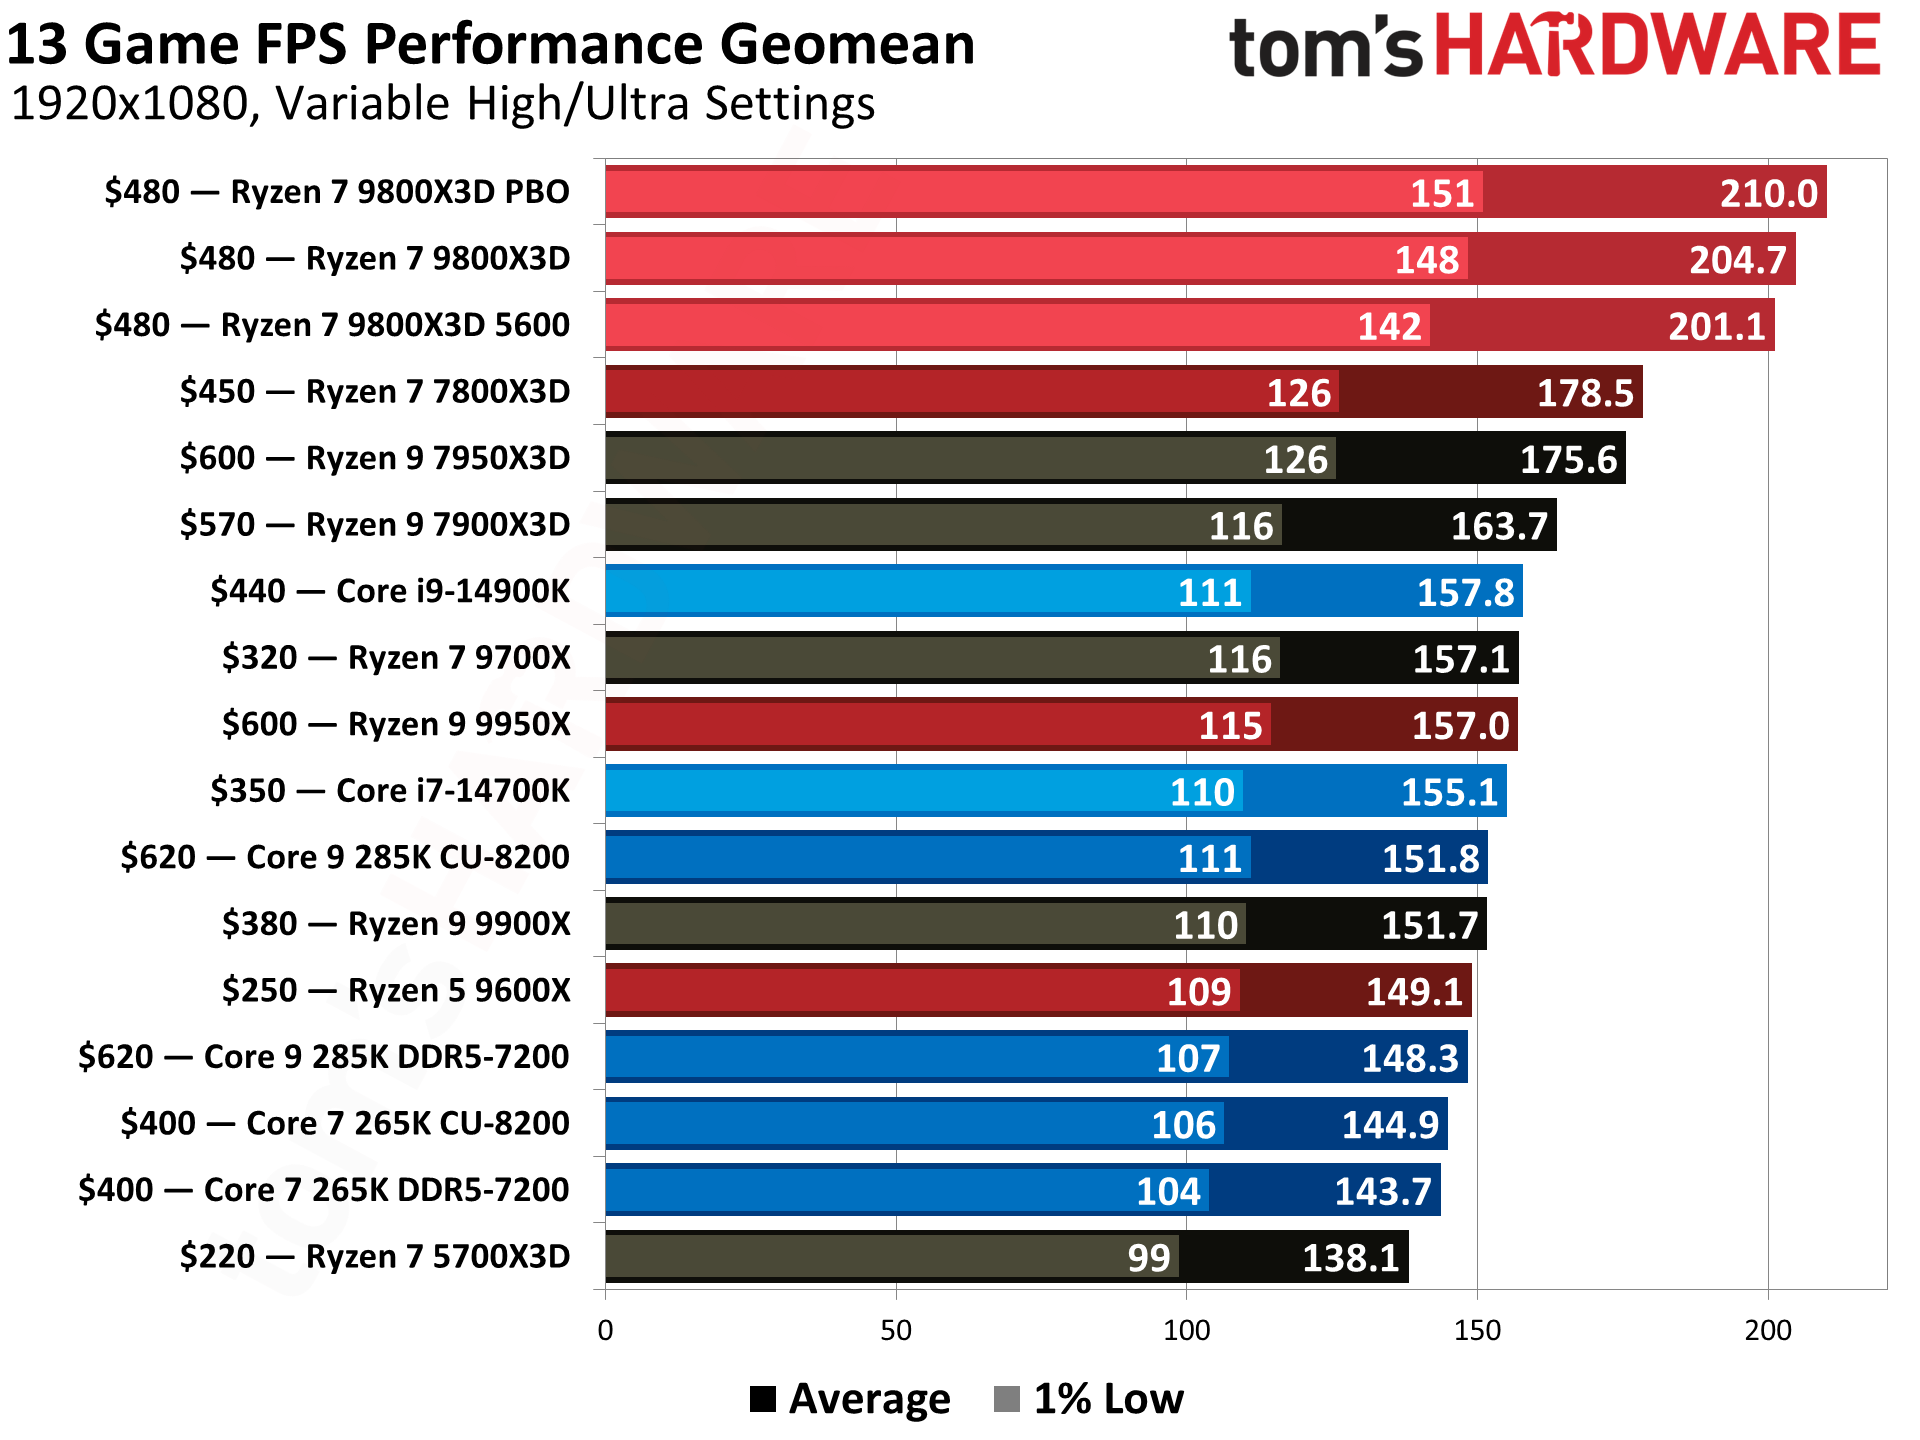
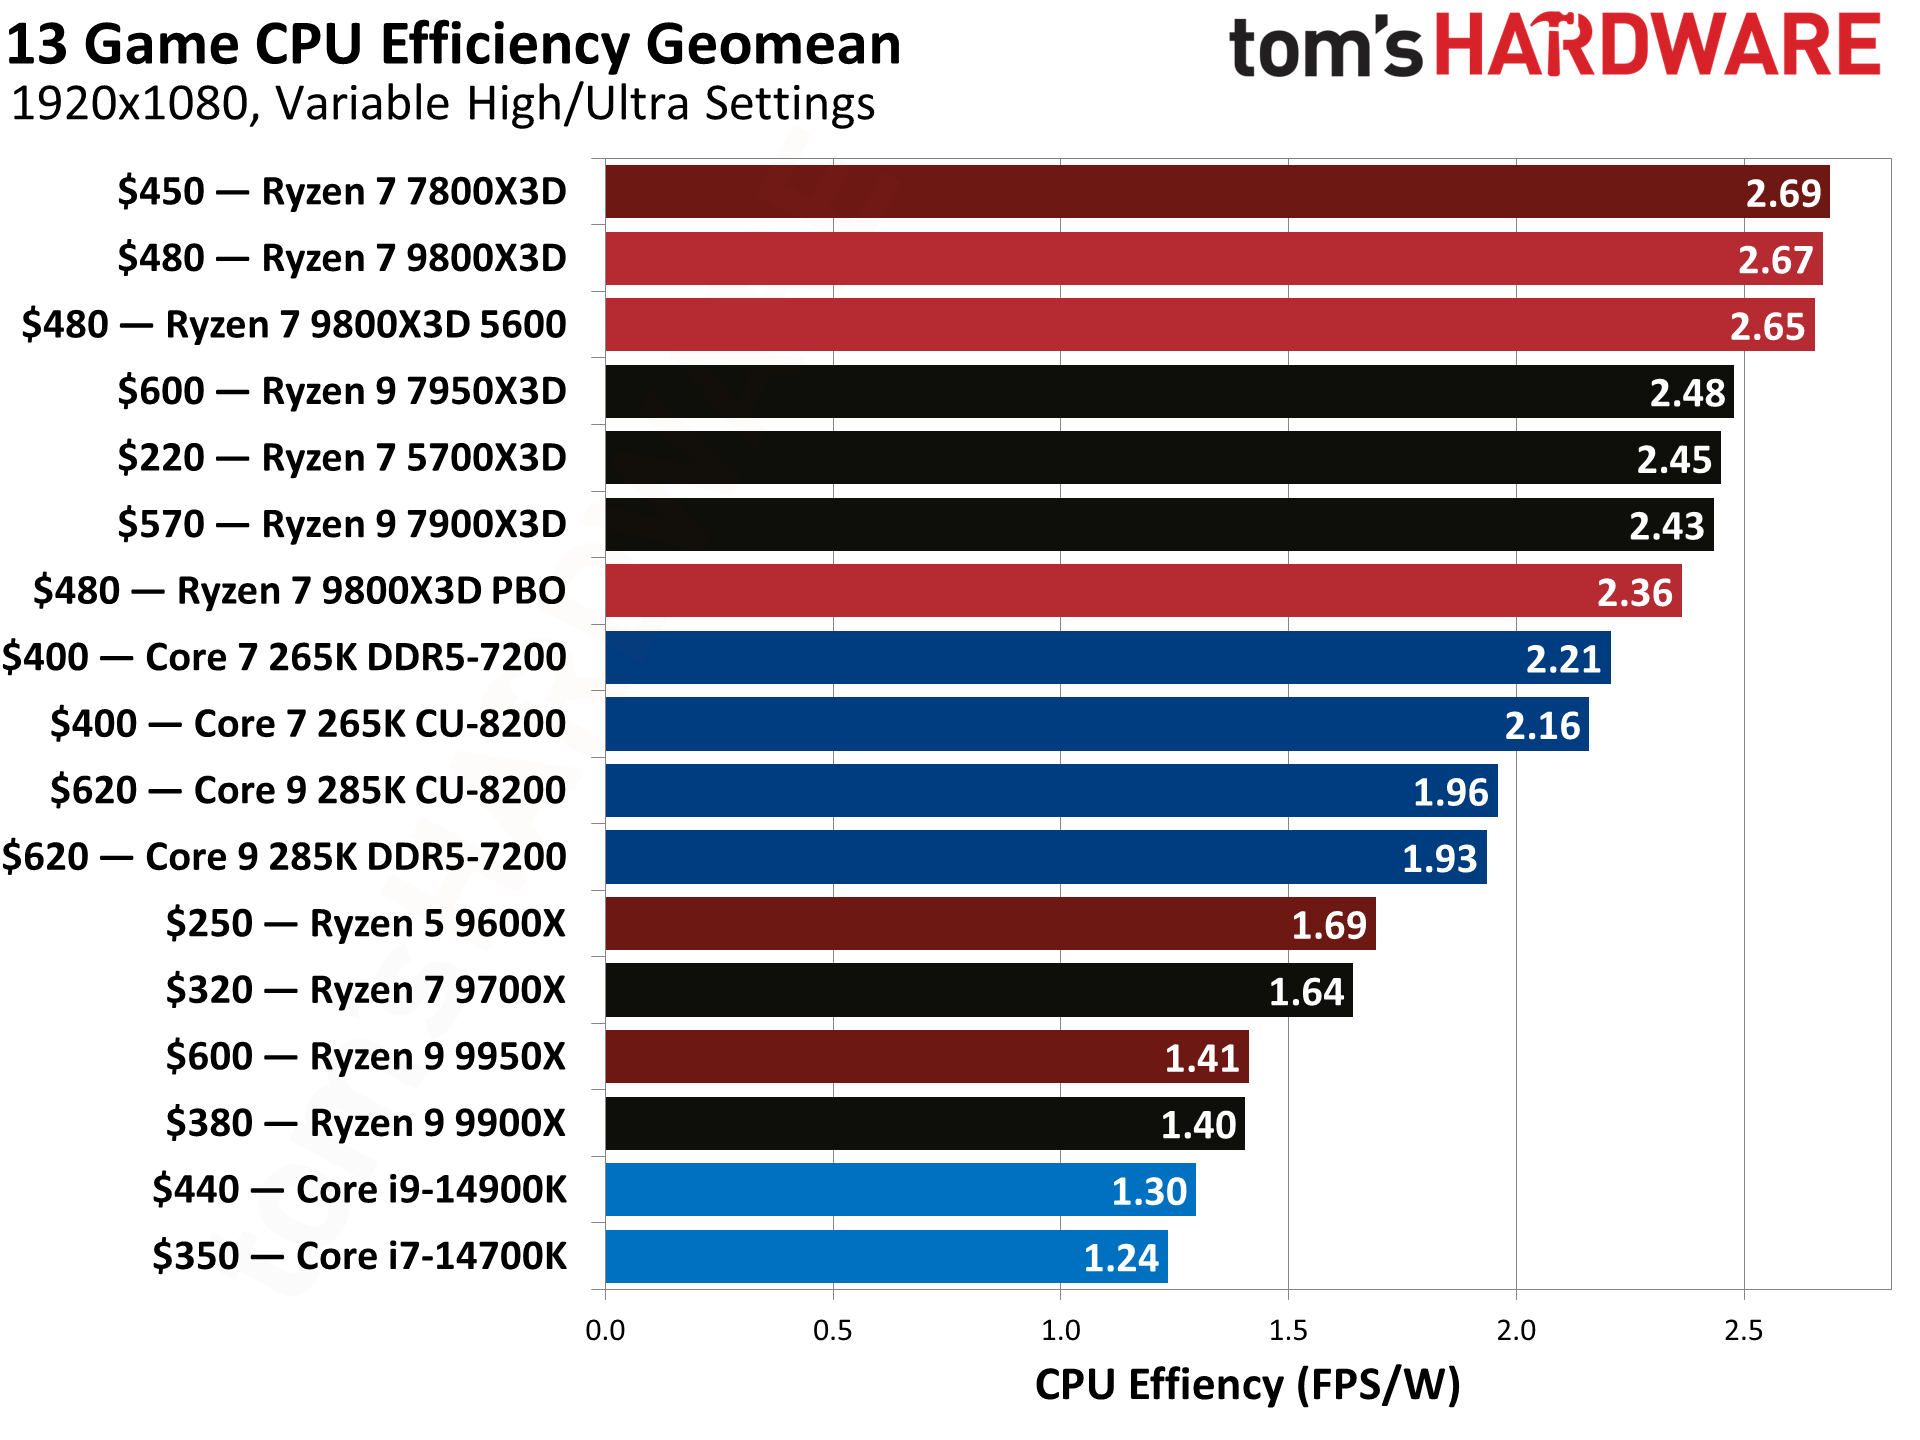
We see right away that the $480 Ryzen 7 9800X3D delivers almost unbelievable gaming performance, beating Intel's fastest gaming chip, the $440 Core i9-14900K, by an incredible 30%.
While the 14900K is Intel's fastest gaming chip, it isn't the newest flagship — that falls to the lackluster $620 Core Ultra 9 285K, which hasn't managed to match, let alone exceed, Intel's previous-gen flagship. That means the 285K fares even worse in our overall measurement: AMD claims to beat the 285K by 20%, but in our tests, the 9800X3D is an incredible 35% faster. AMD says the 9800X3D is 8% faster than the $450 Ryzen 7 7800X3D, but again, we measured a much higher delta, with the 9800X3D being 14.7% faster in our test suite.
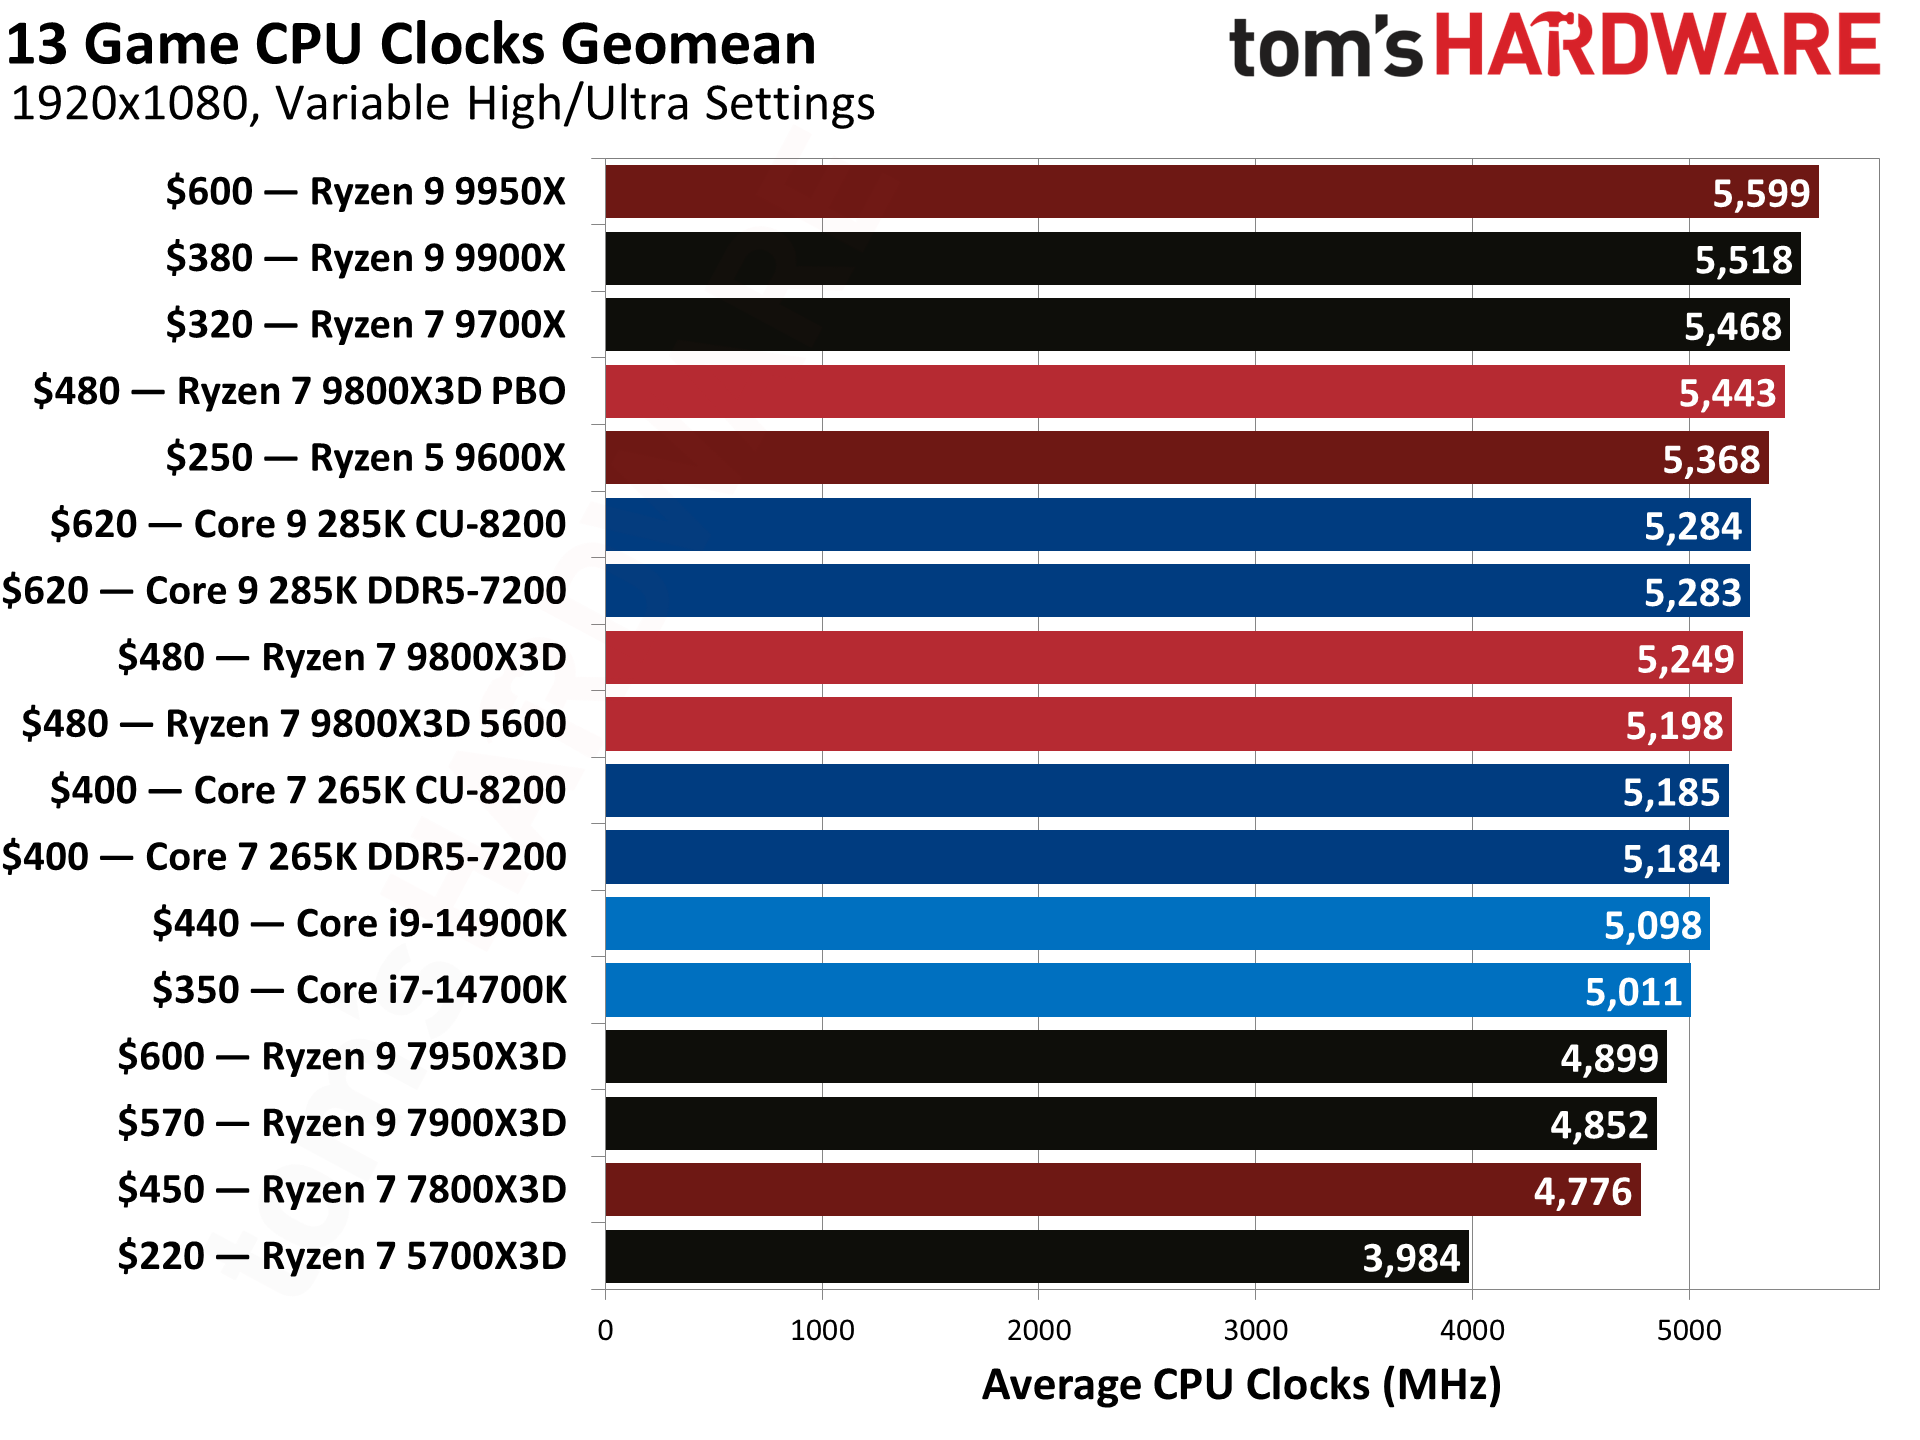
Looking at the chart of average clock rates during the 13-game test suite is insightful. The 9800X3D ran at an average of 5.2 GHz, which is ~10% faster than the 7800X3D's clock speed. The advantages of Zen 5's higher IPC also weigh in here, helping to explain the impressive gen-on-gen improvements we see in our admittedly cache-friendly test suite.
There are other important factors, too. The stock Ryzen 7 9800X3D's 1% low frame rates (a good smoothness indicator) points to an exceptionally smooth gaming experience. In fact, the 9800X3D's 1% lows weigh in at 148 fps, which is 'only' 2.5% slower than the Core Ultra 9 285K's average frame rate. Impressive indeed.
We also tested with the base stock DDR5-5600 memory configuration for the 9800X3D, marked with '5600' in the above chart, and used DDR5-6000 memory for the standard 'Ryzen 7 9800X3D' listing. Moving up to the faster memory yields a 1.8% speedup on average. (We left that entry out of the individual tests below to make the charts easier to read.) This is a great result with extremely cheap RAM and an entirely different result than shelling out for super fast CUDIMM memory for the Core Ultra chips and receiving a mere 2% improvement.
We also tested with the auto-overclocking Precision Boost Overdrive (PBO) feature enabled (marked with 'PBO' in the chart), and engaging this feature gave us around 2.6% more performance. Note that this will vary based on cooling, chip quality, and other factors. Also, overclocking the competing processors would yield at least some additional performance, too.
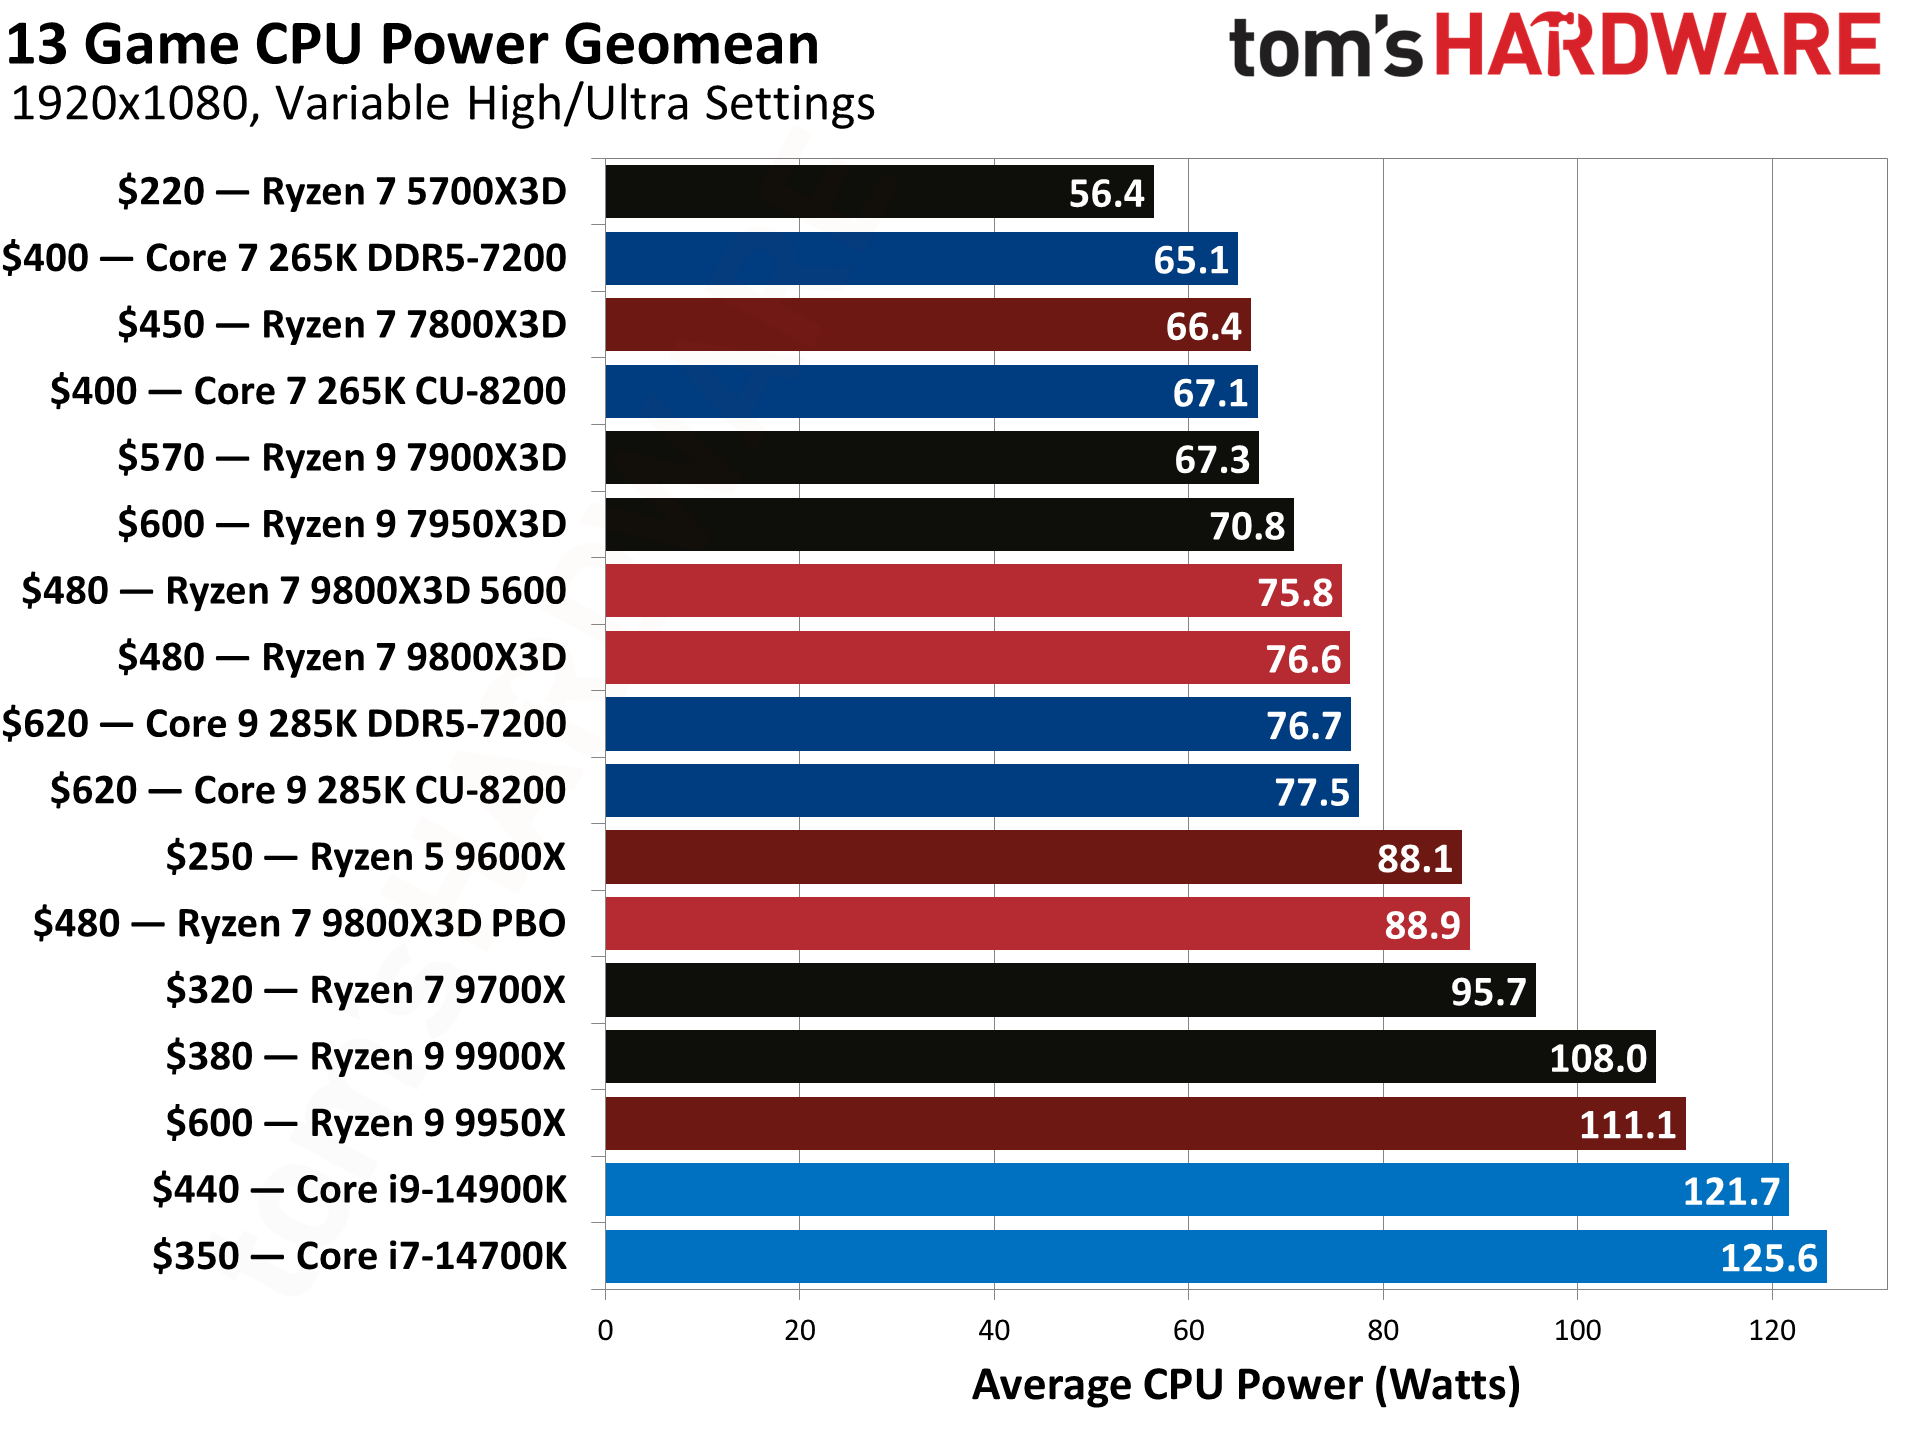
The power consumption chart shows that the Ryzen 9 7900X3D averaged 76.6W of power consumption across our suite, while Intel's Arrow Lake ran in the 65 to 67W range, and the previous-gen Ryzen 7 7800X3D consumed 66.4W. However, flipping through to the CPU efficiency chart, which plots FPS-per-watt, finds the 9800X3D and 7800X3D essentially tied for the best efficiency in our test pool, while the Arrow Lake chips are much less efficient overall thanks to their lower gaming performance, falling to the middle of the pack.
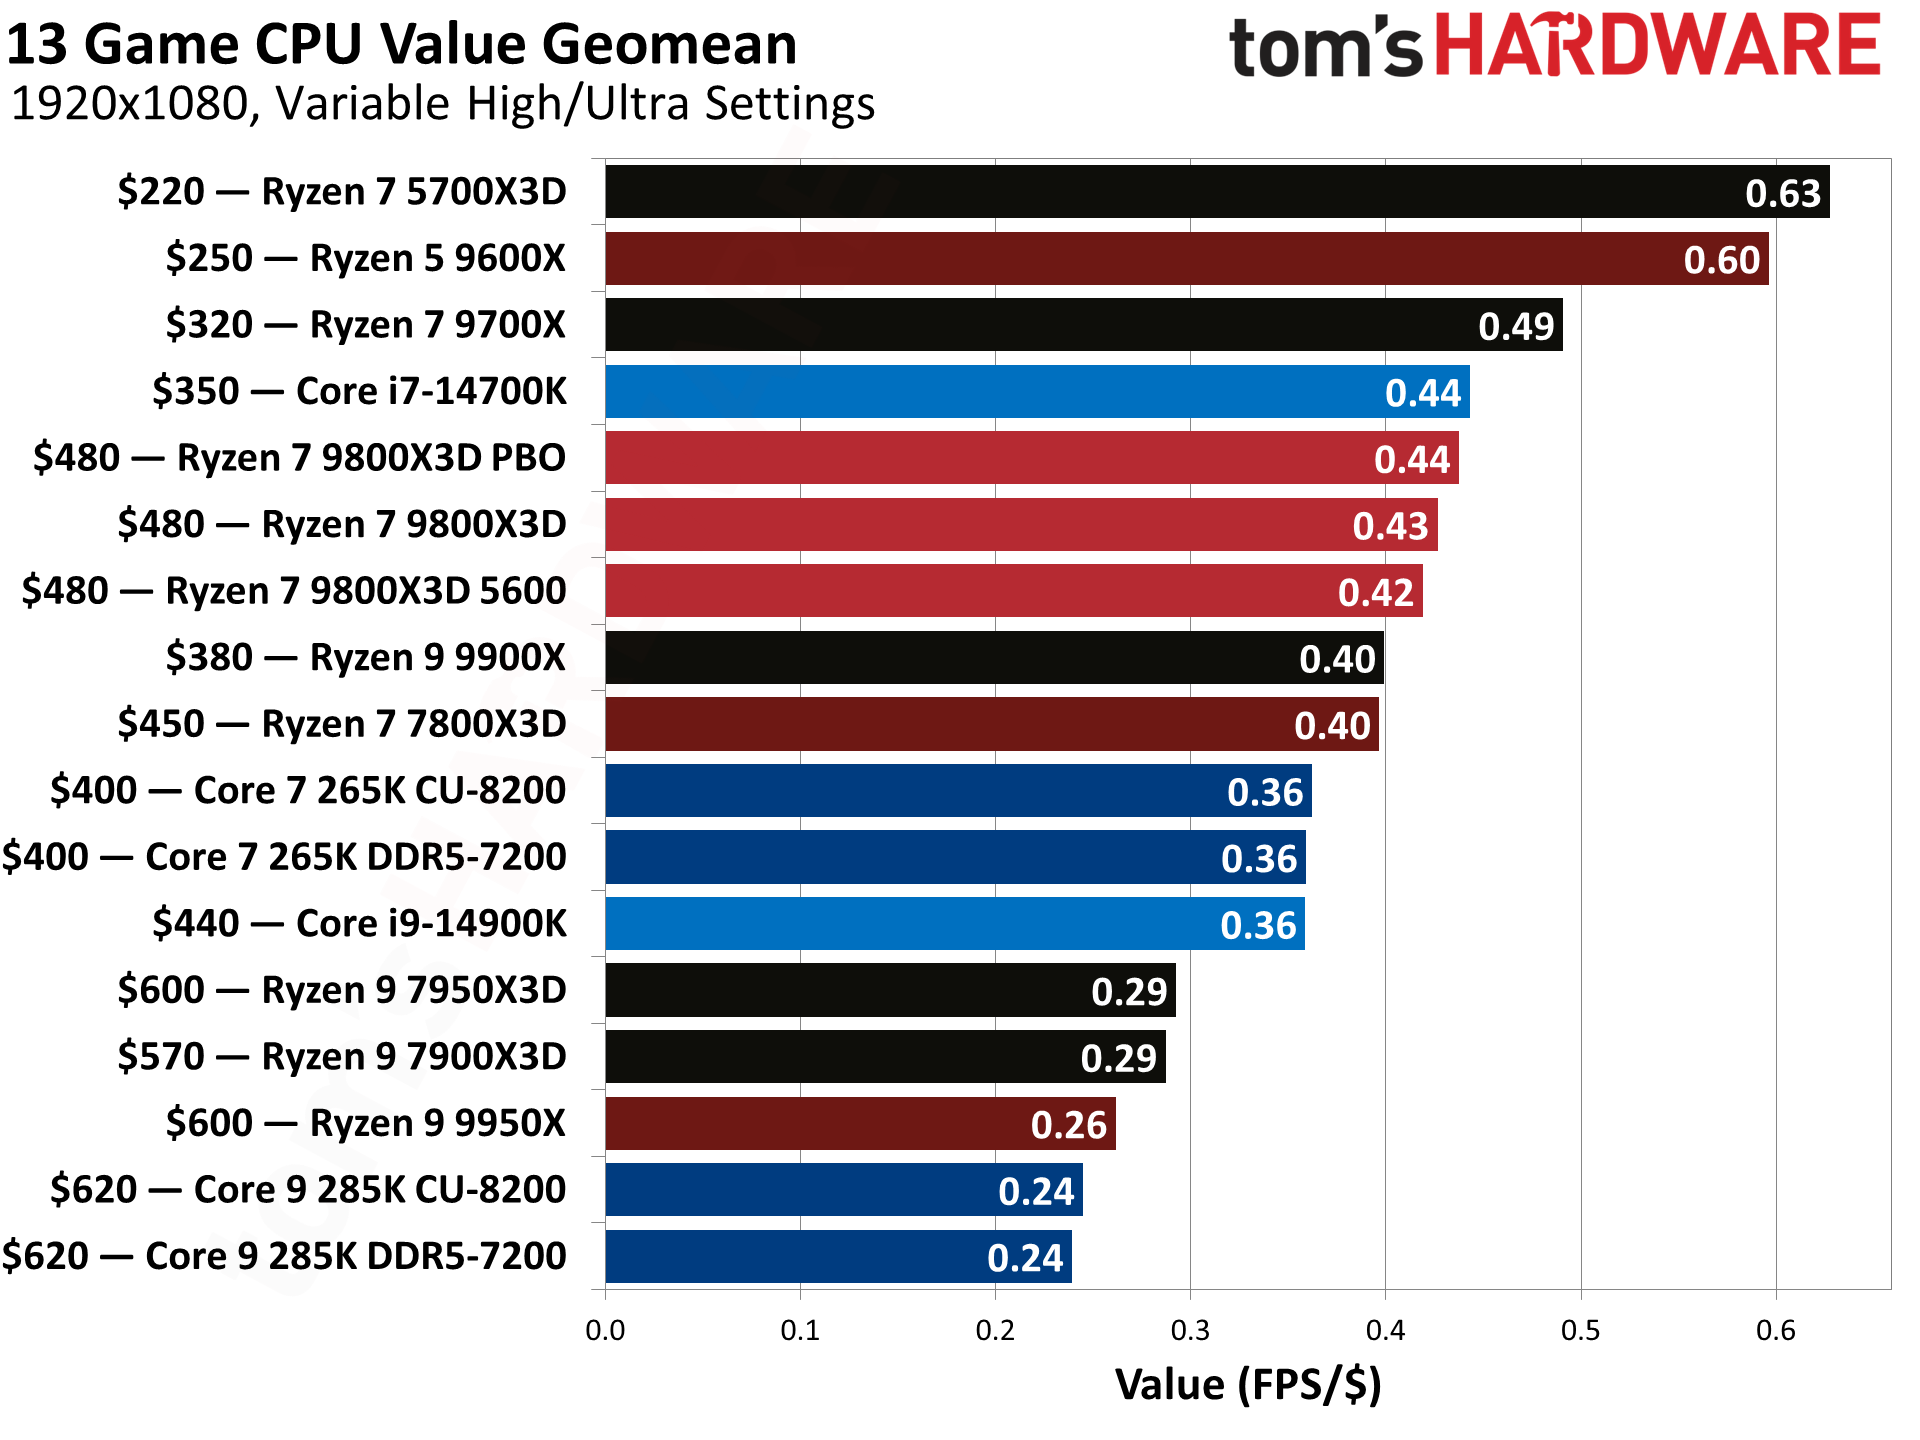
Pricing is a big factor, too. Our FPS-per-dollar chart shows that the Ryzen 7 57000X3D is the unquestioned value champ, but the Ryzen 7 9800X3D beats all Intel chips except the Core i7-14700K. Given that the Ryzen 7 9800X3D provides the fastest gaming performance overall, AMD will have absolutely no problem charging a premium.
Our overall measurement of gaming performance is much higher than AMD's for multiple reasons. AMD used multiple games that did not benefit from 3D V-Cache in its tests (our suite is very heavily skewed to 3D V-Cache-friendly titles), it used Windows 23H2 (we use 24H2), and it tested with the performance-sapping Virtualization Based Security (VBS) setting enabled, whereas we test with this feature disabled. We have included AMD's benchmarks with a very broad range of titles at the end of this page to provide a more balanced view of the impact of 3D V-Cache (a few games have 1 to 2% lower performance than with the previous-gen 7800X3D, but that is very limited).
The competition between AMD and Intel chips can vary based on the title (particularly with X3D models) and the GPU you use. It's best to make an informed decision based on the types of titles you frequently play, so be sure to check out the individual game tests below.
A Plague Tale: Requiem Benchmarks — AMD Ryzen 7 9800X3D
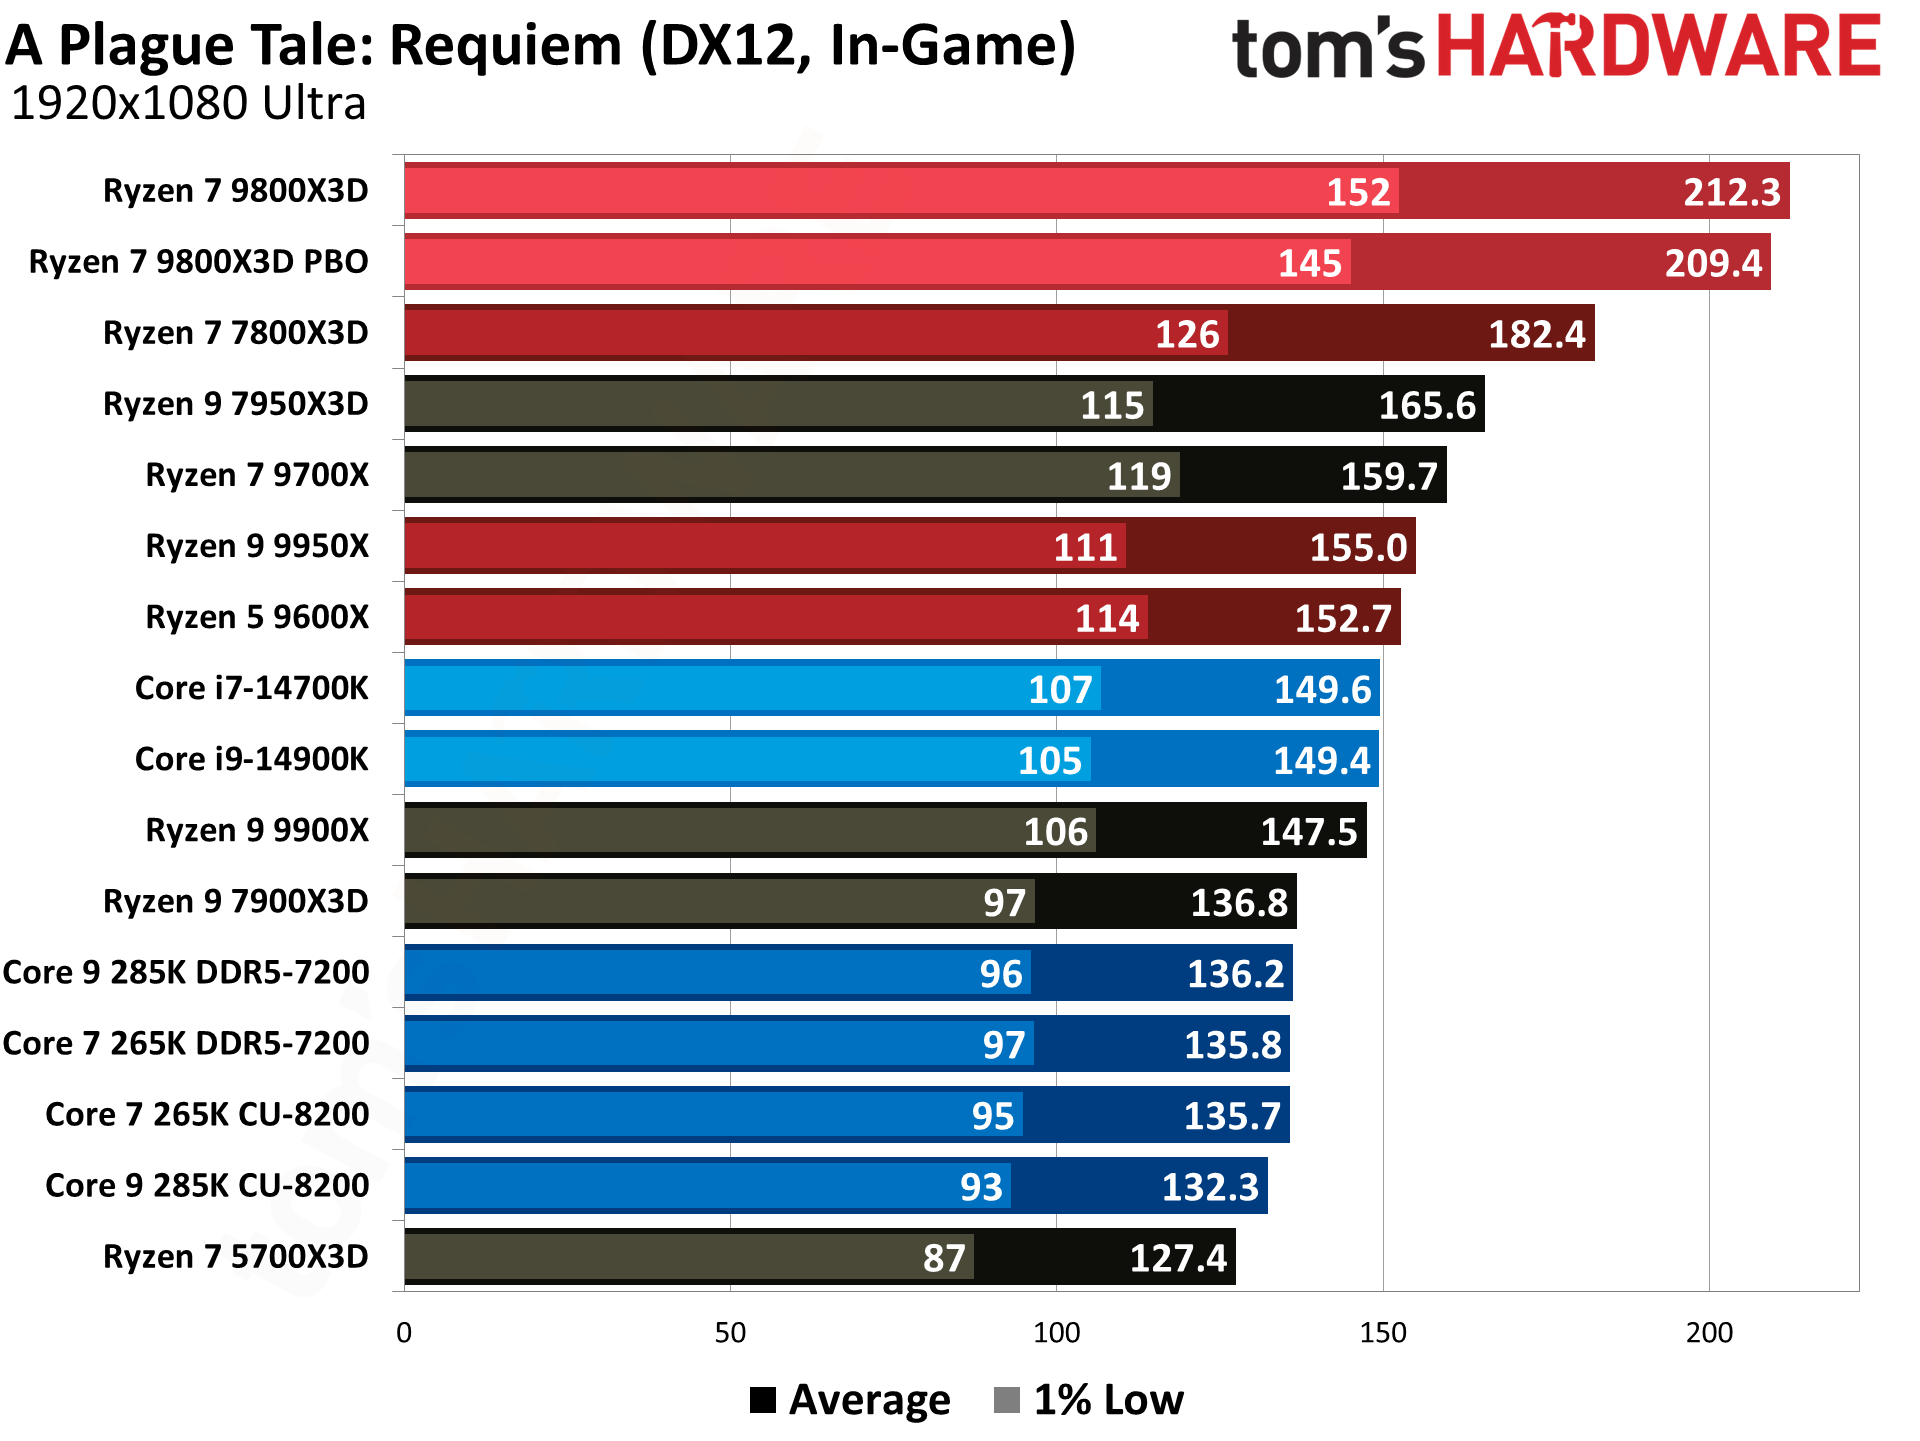
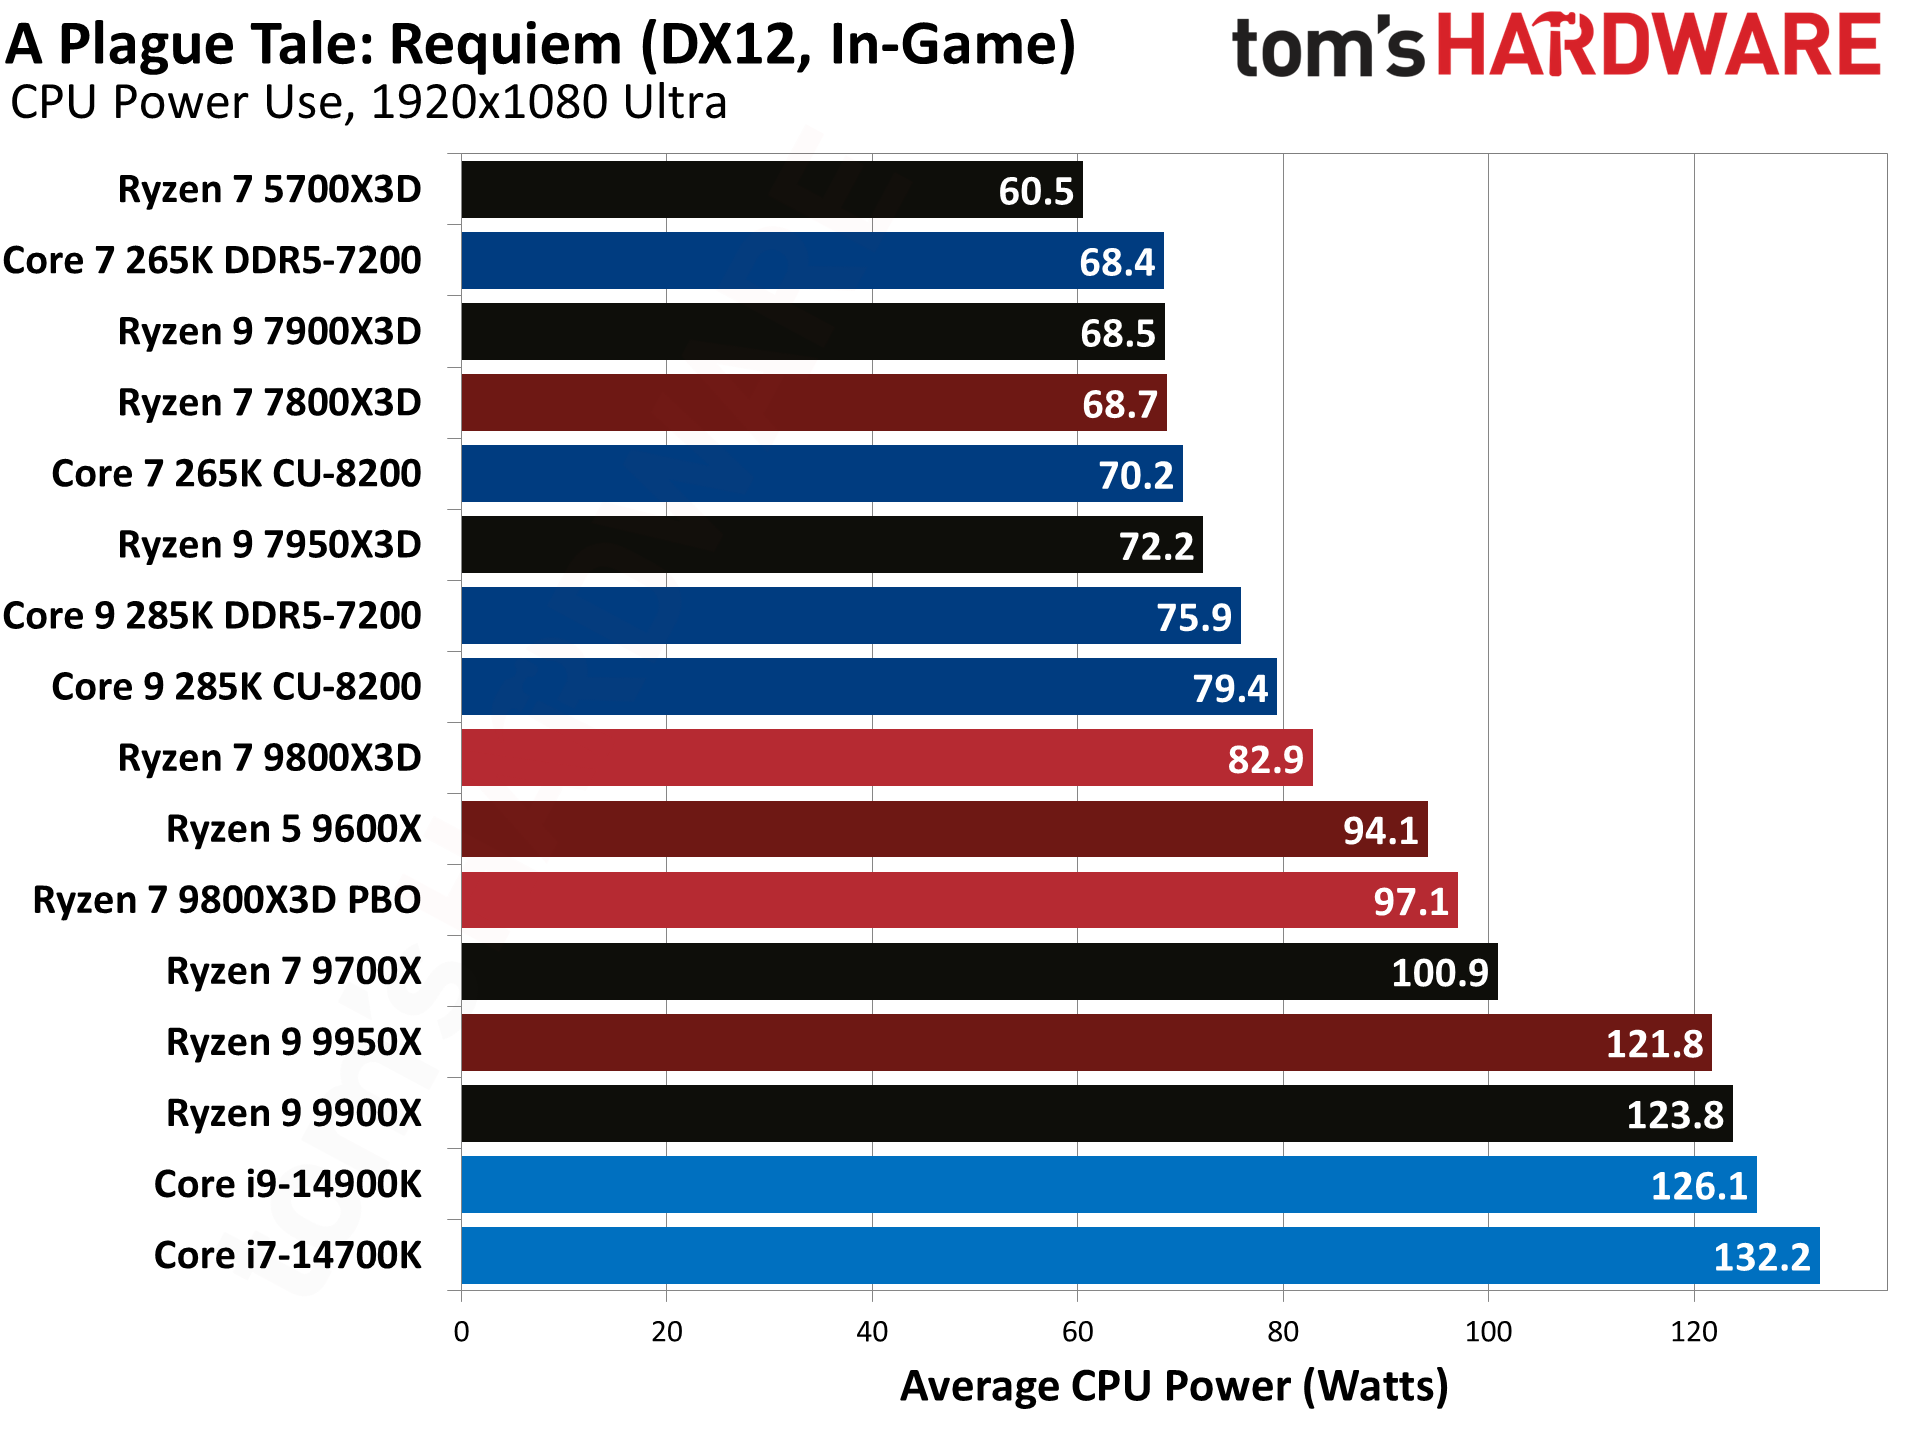
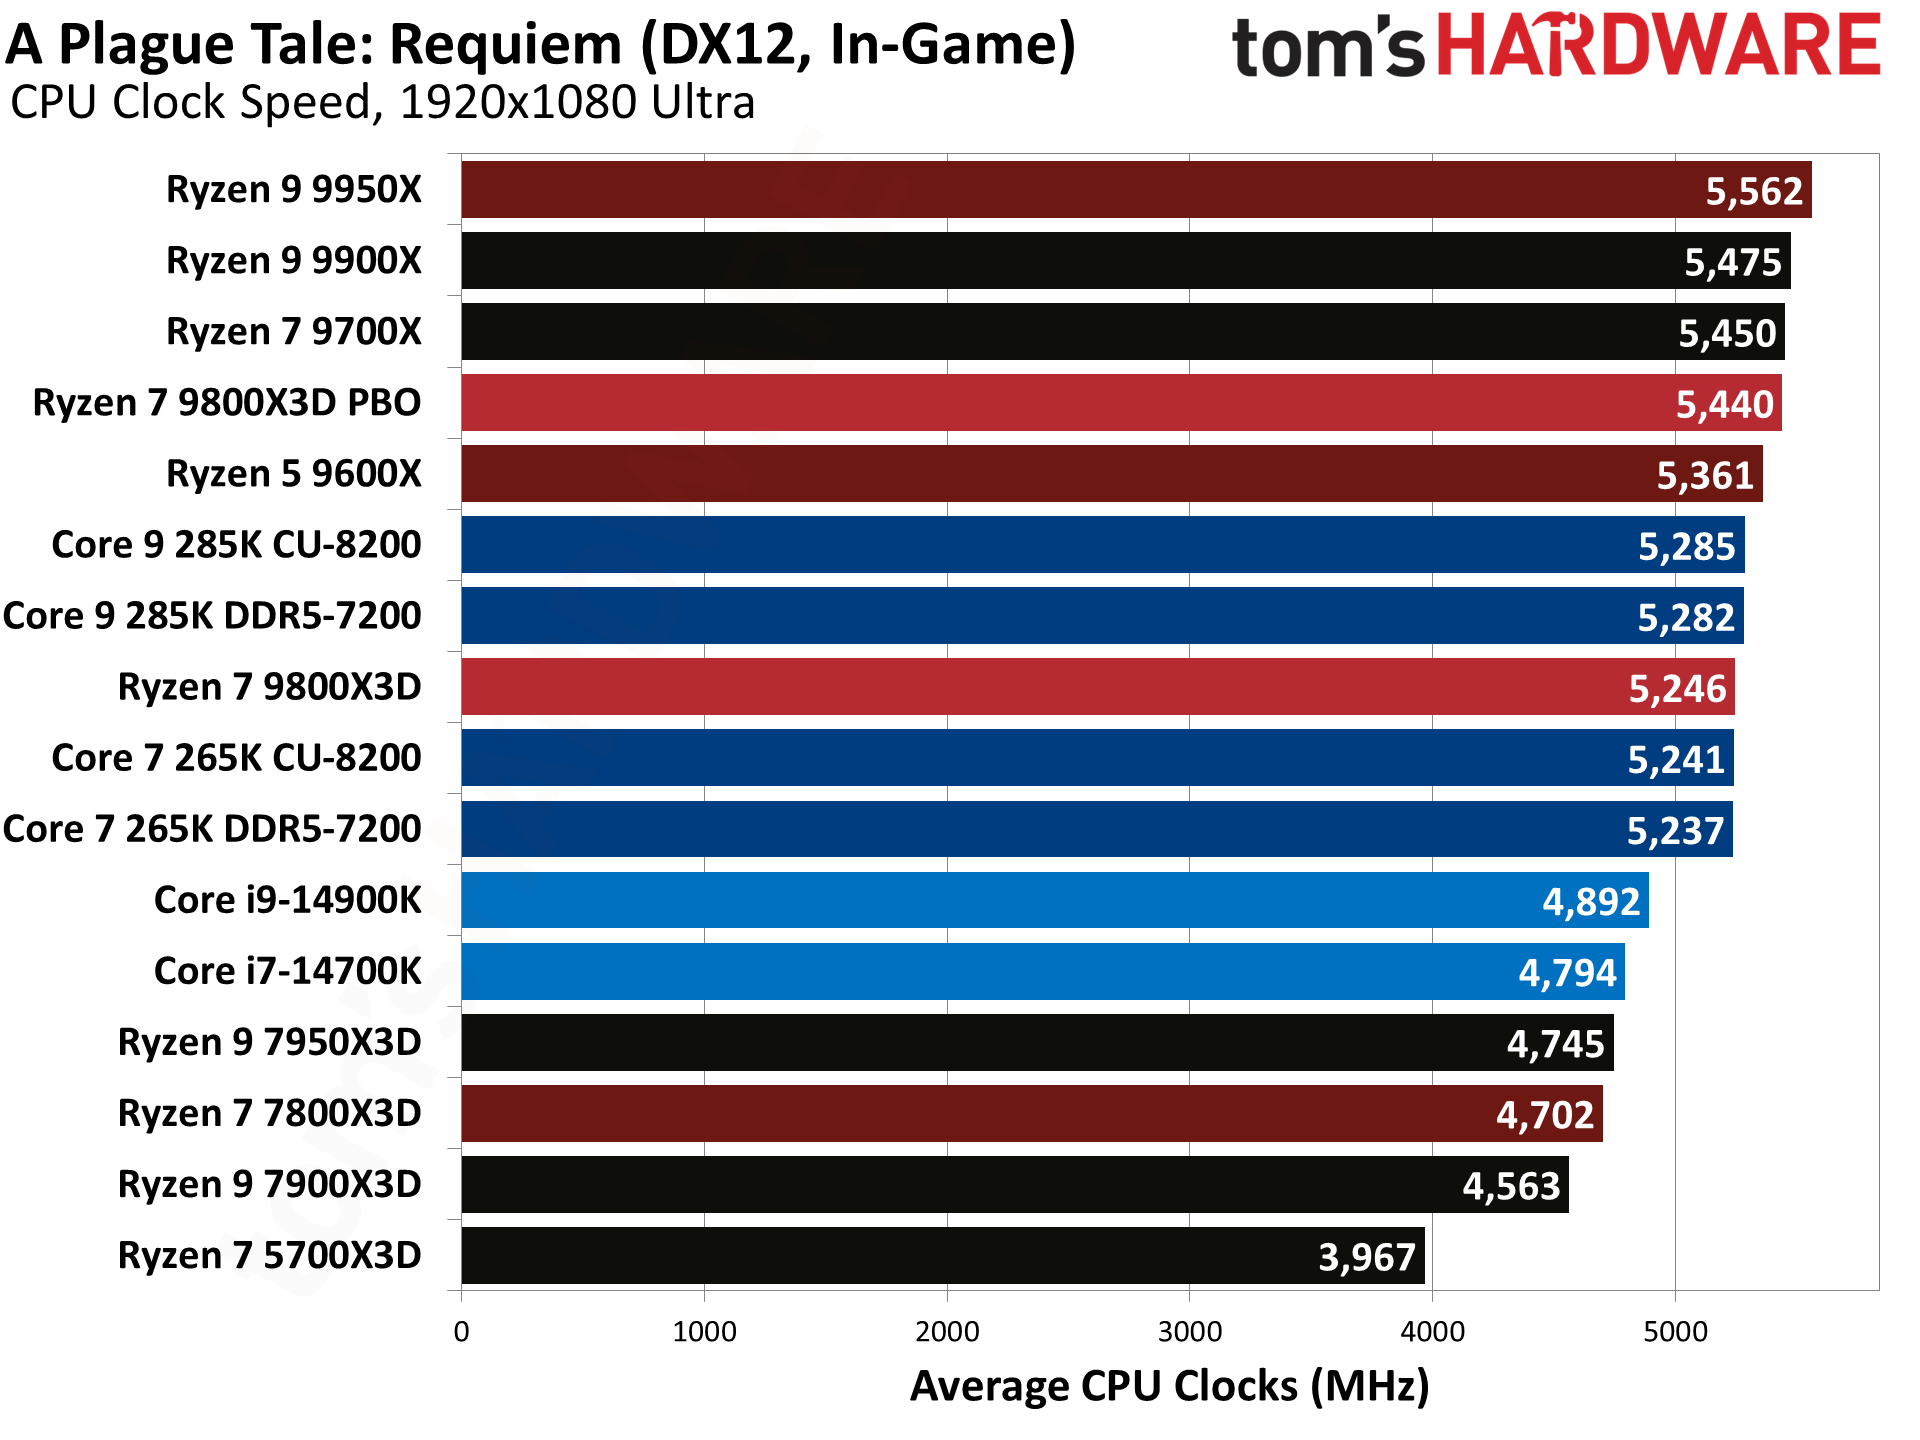
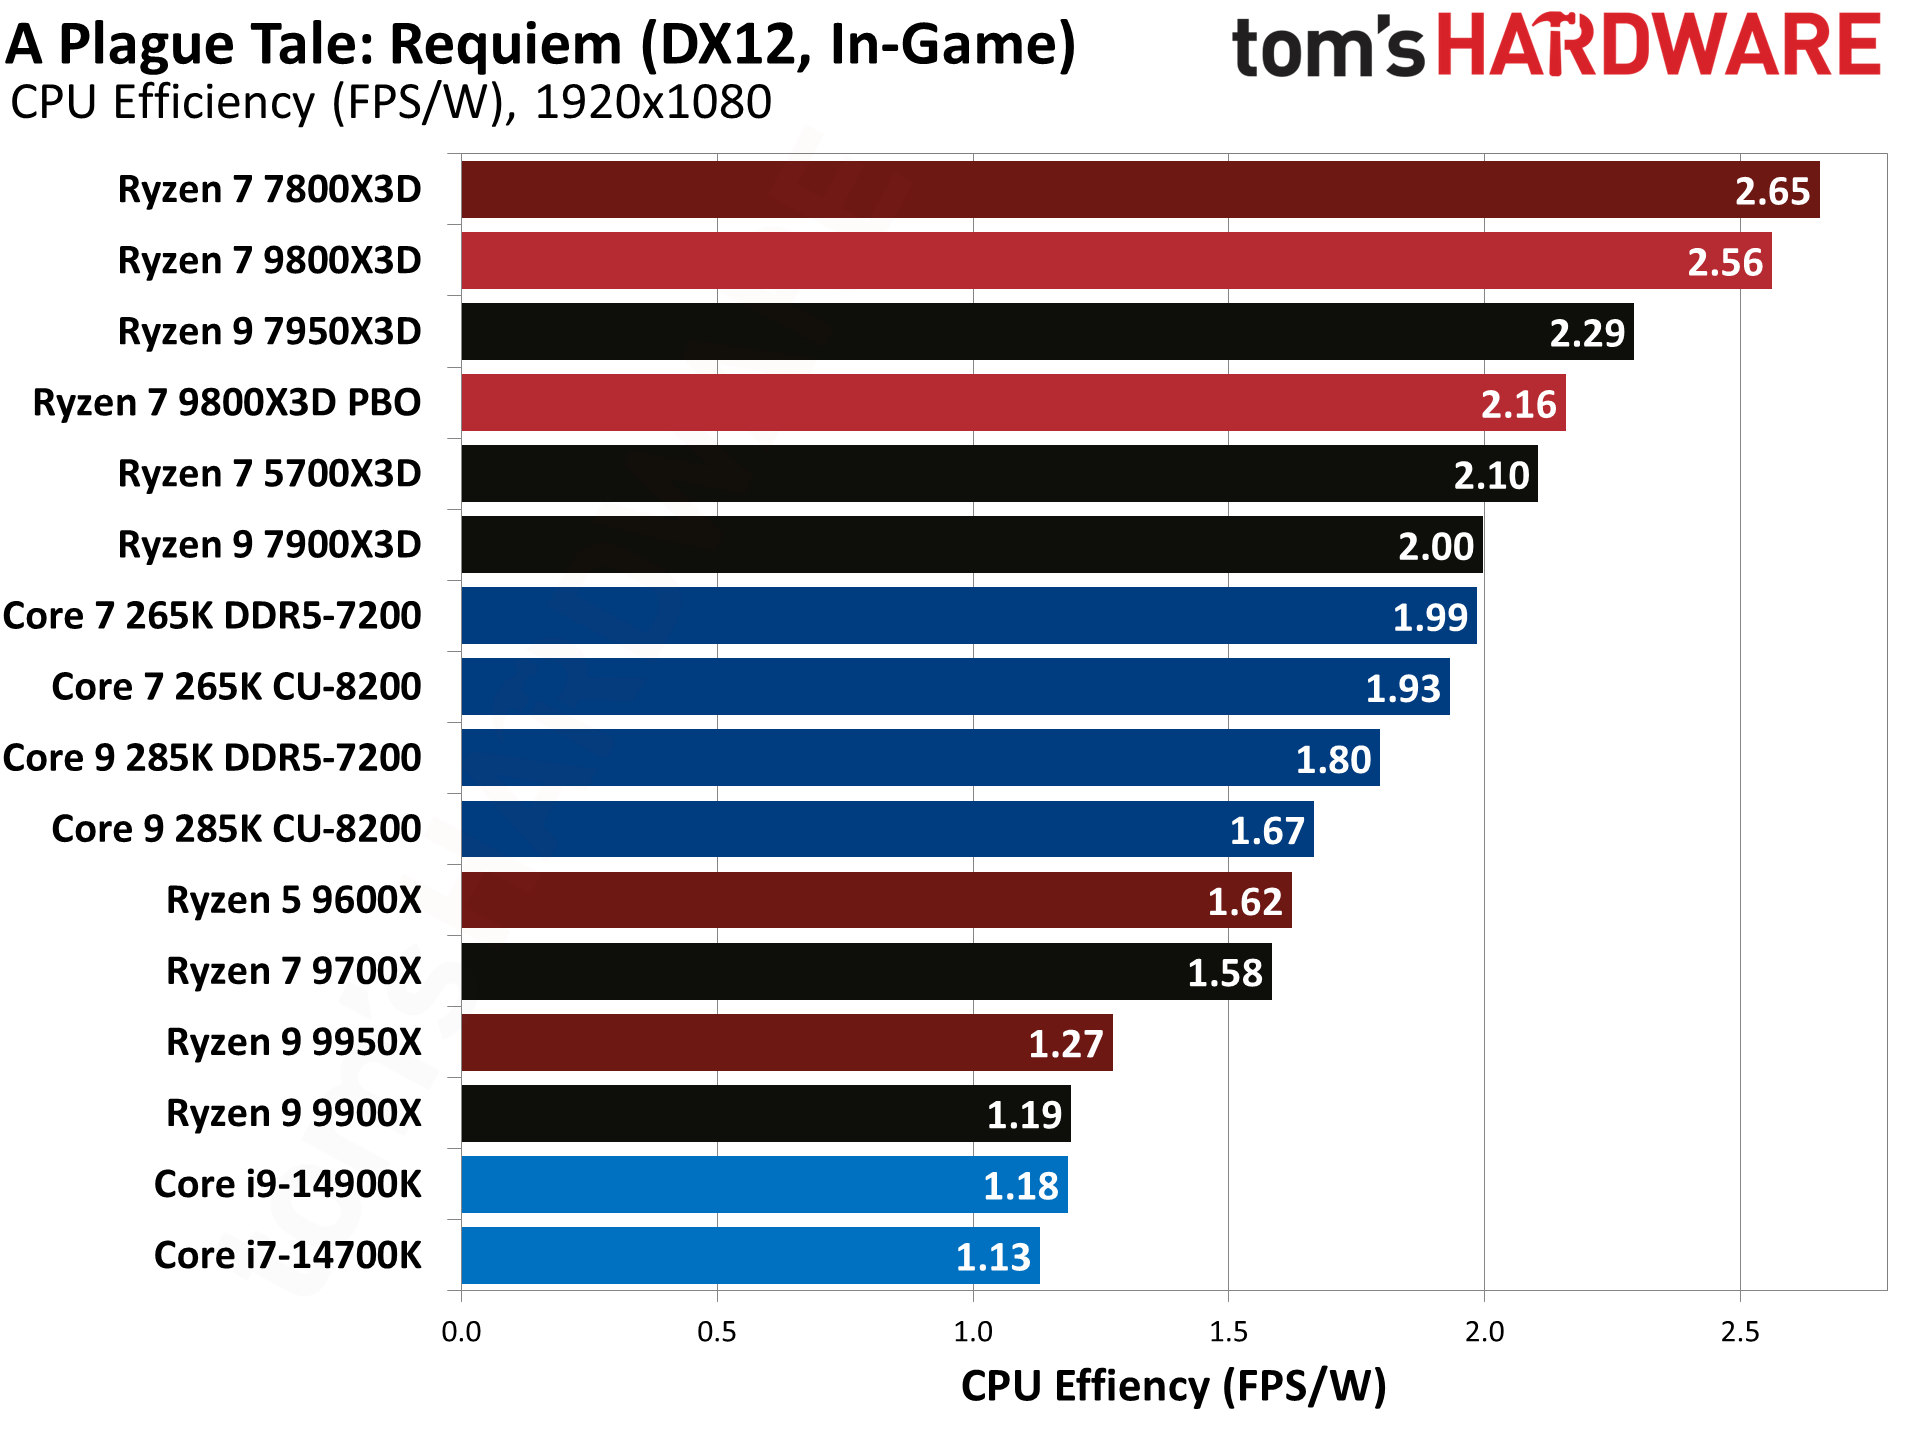
Our first gaming chart might look like an abnormally large lead for the 9800X3D, but for 3D V-Cache chips, this is actually pretty much par for the course. Looking just at our 'normal' 9800X3D result (i.e. not the PBO or DDR5-5600 scores), it beats the 7800X3D by 16.4%, only slightly more than our overall geomean. The Intel chips are a different matter, with the 9800X3D showing a 42% lead over the 14900K and a whopping 60% lead over the 285K — yikes!
Baldur's Gate 3 Benchmarks — AMD Ryzen 7 9800X3D
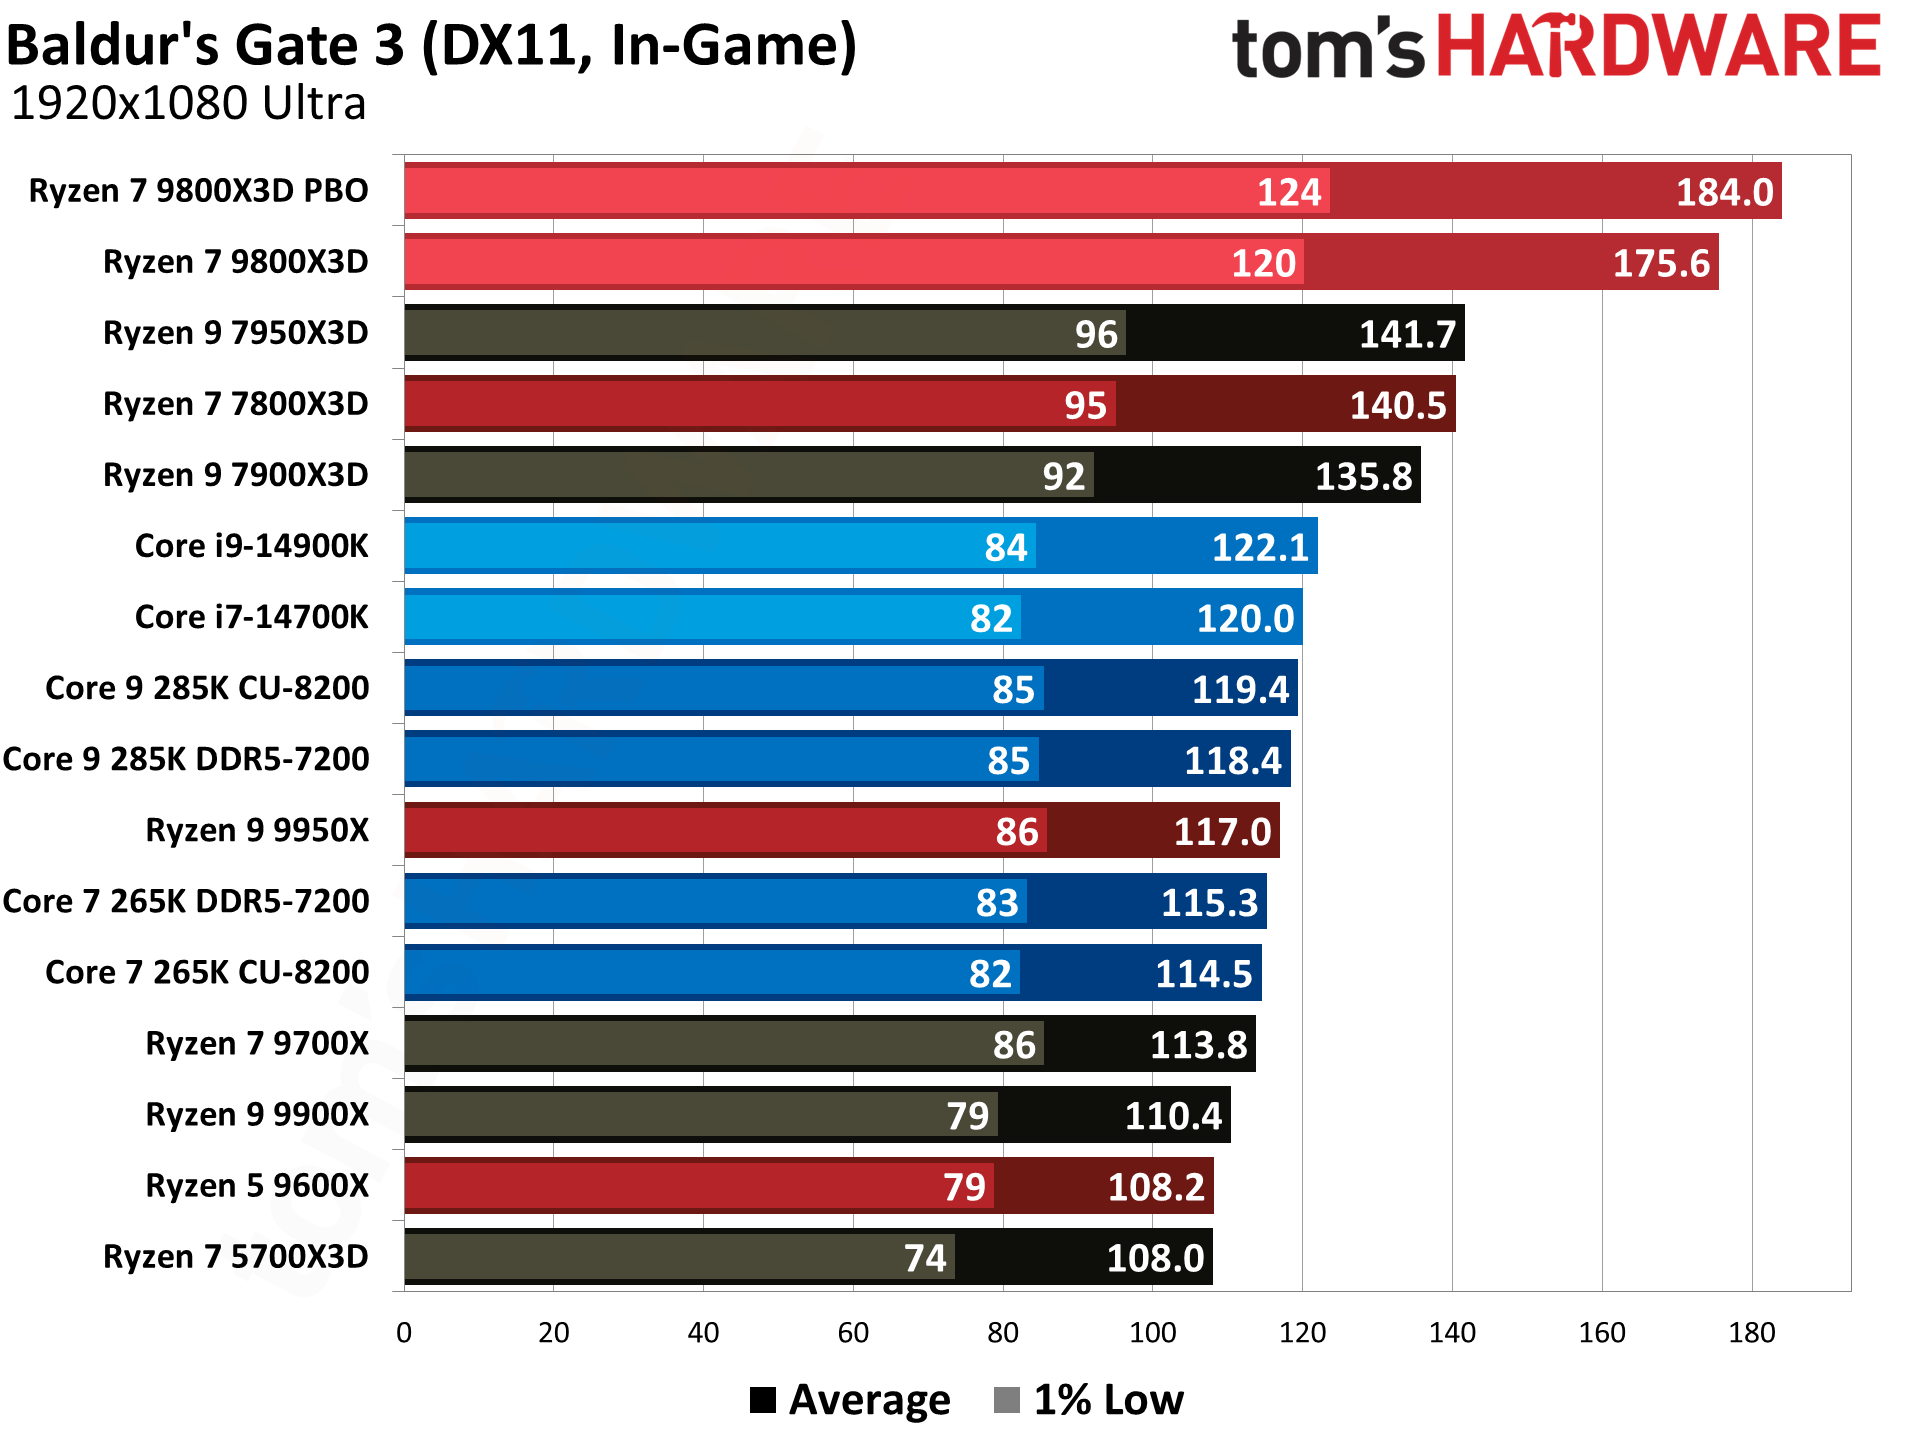
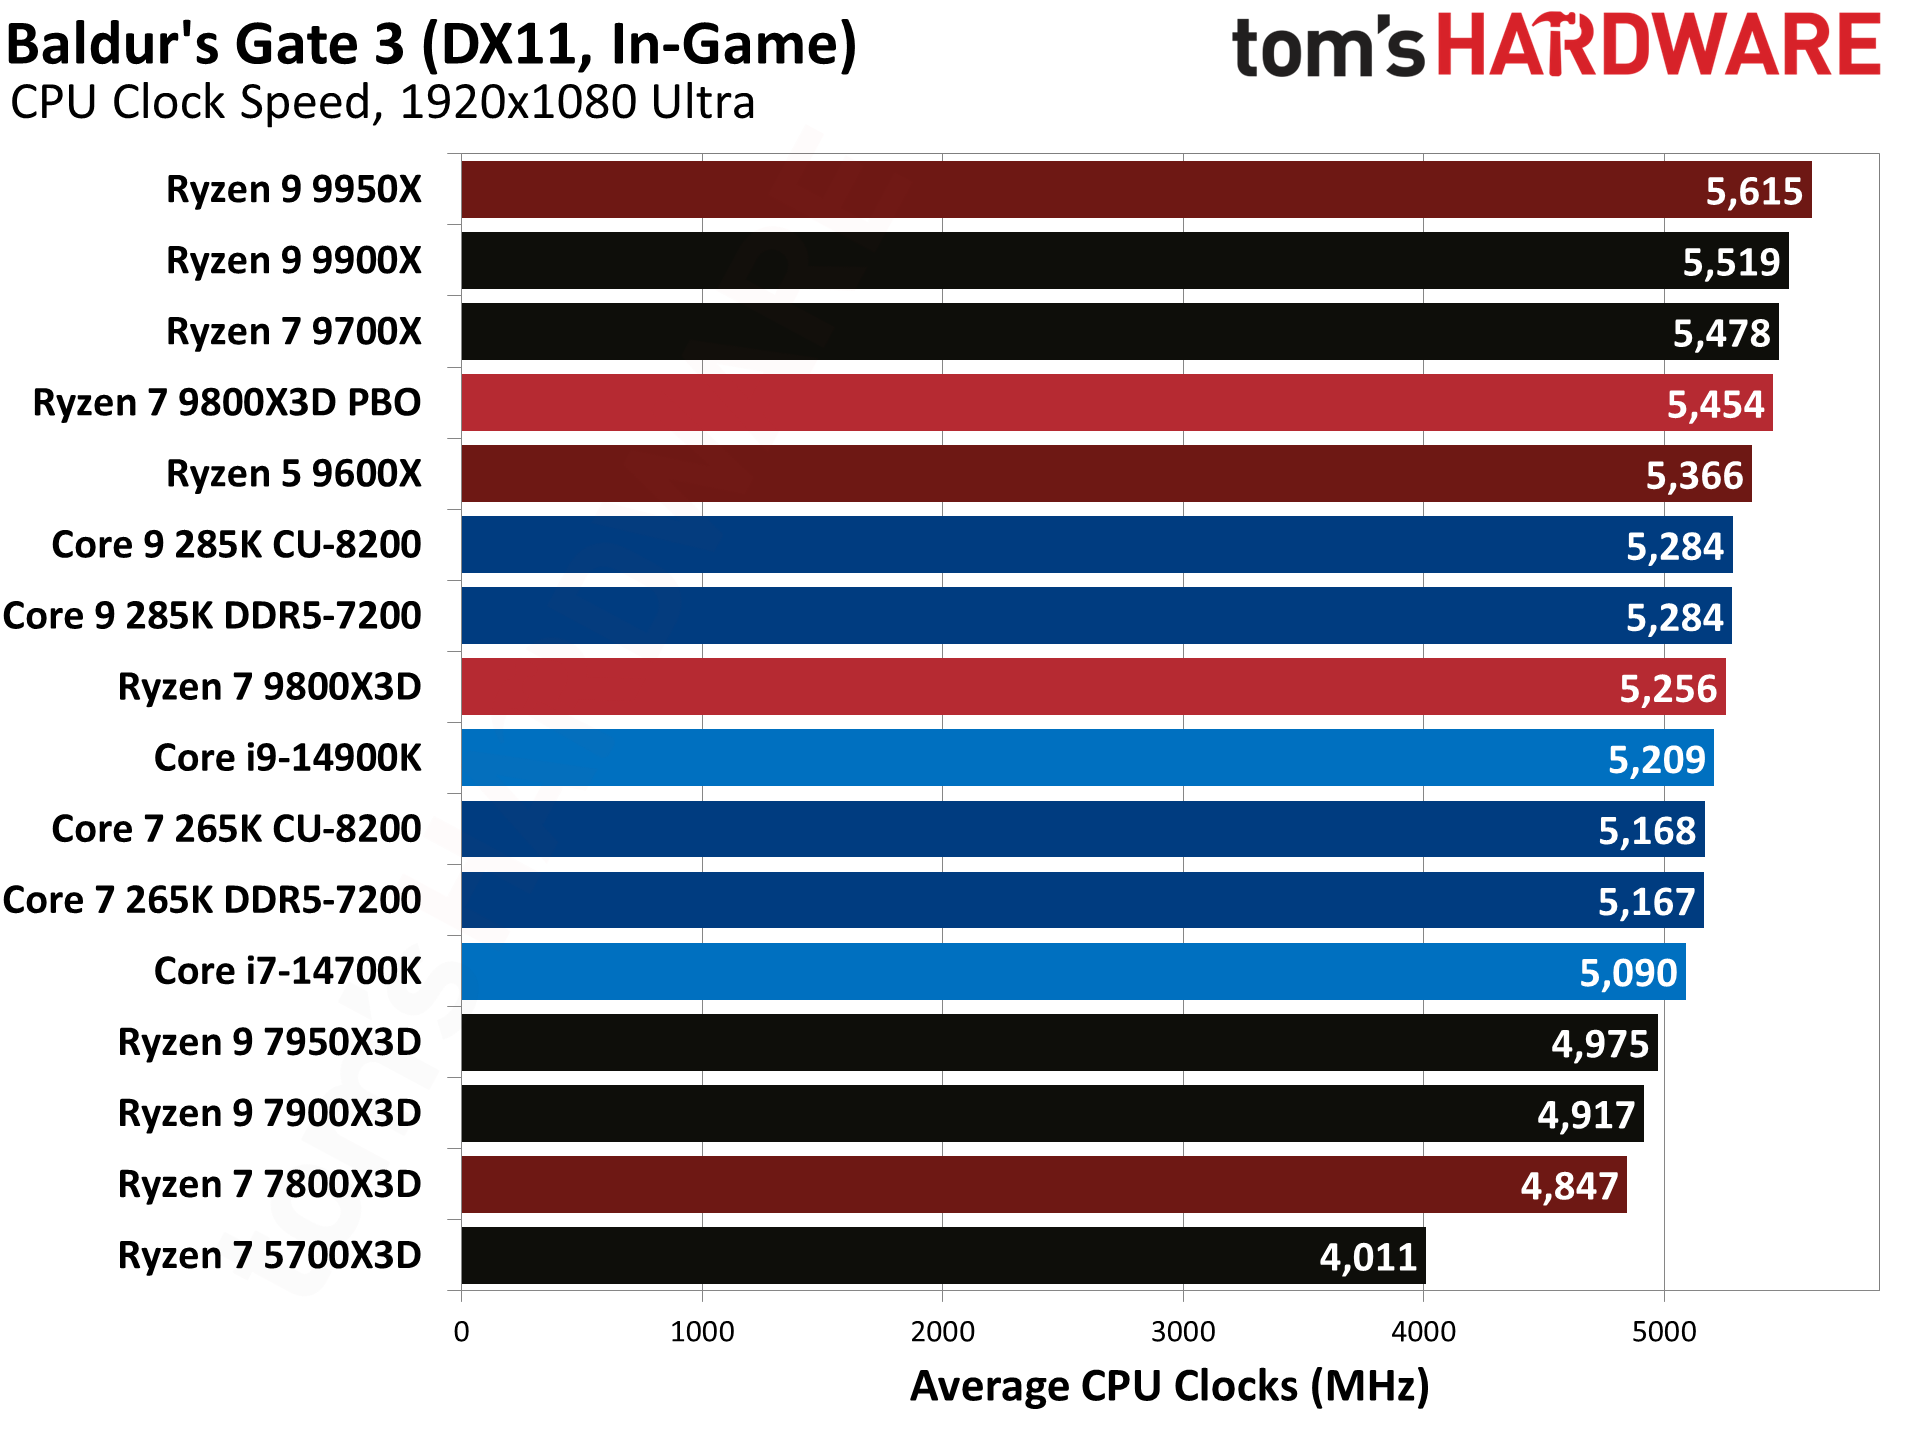
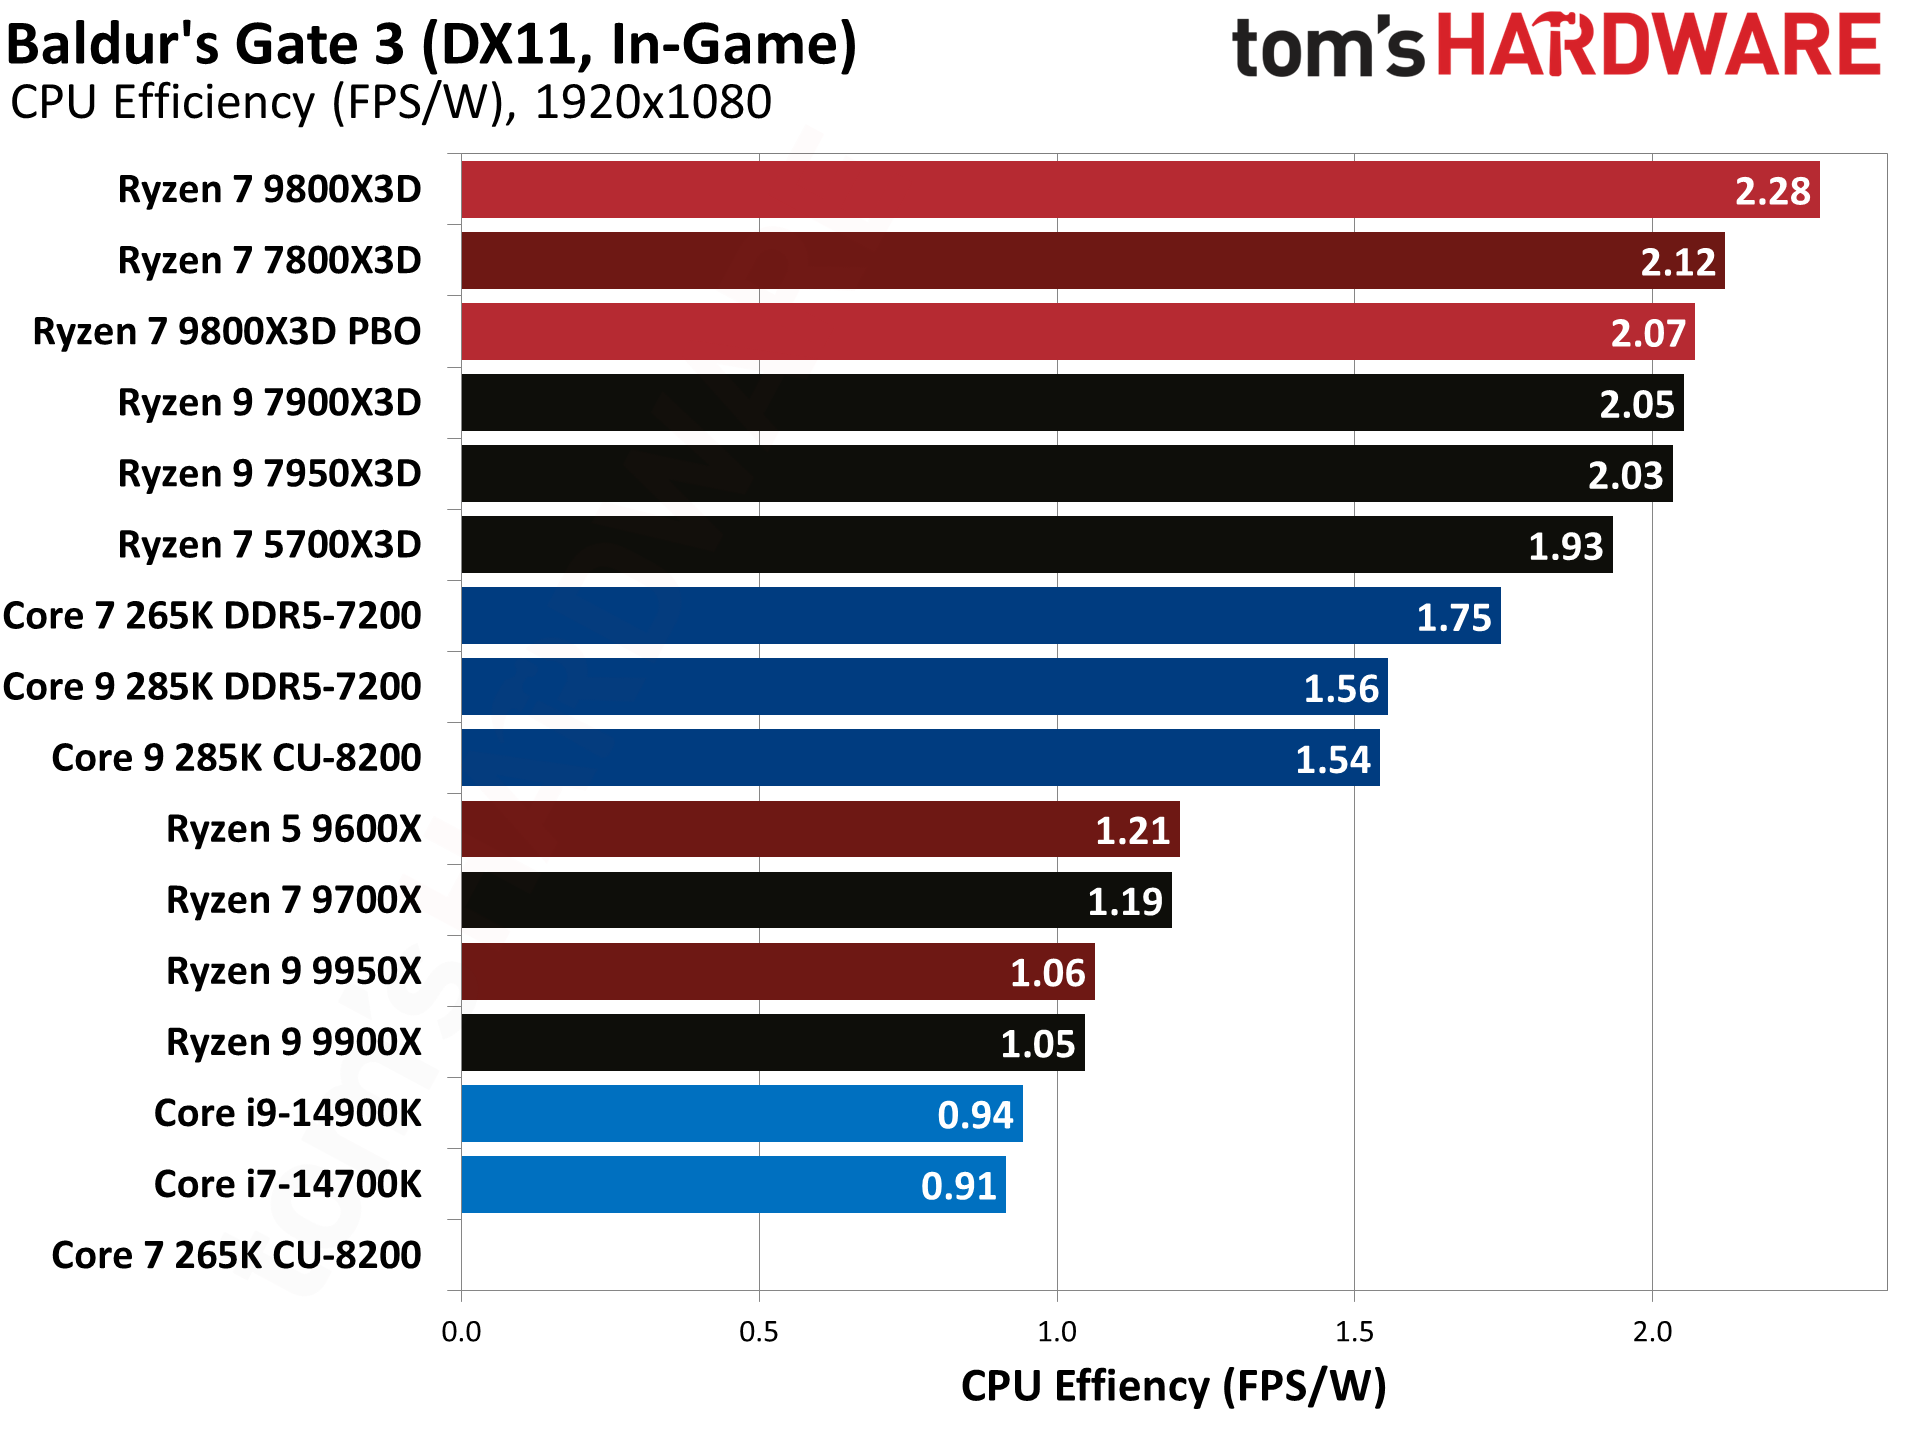
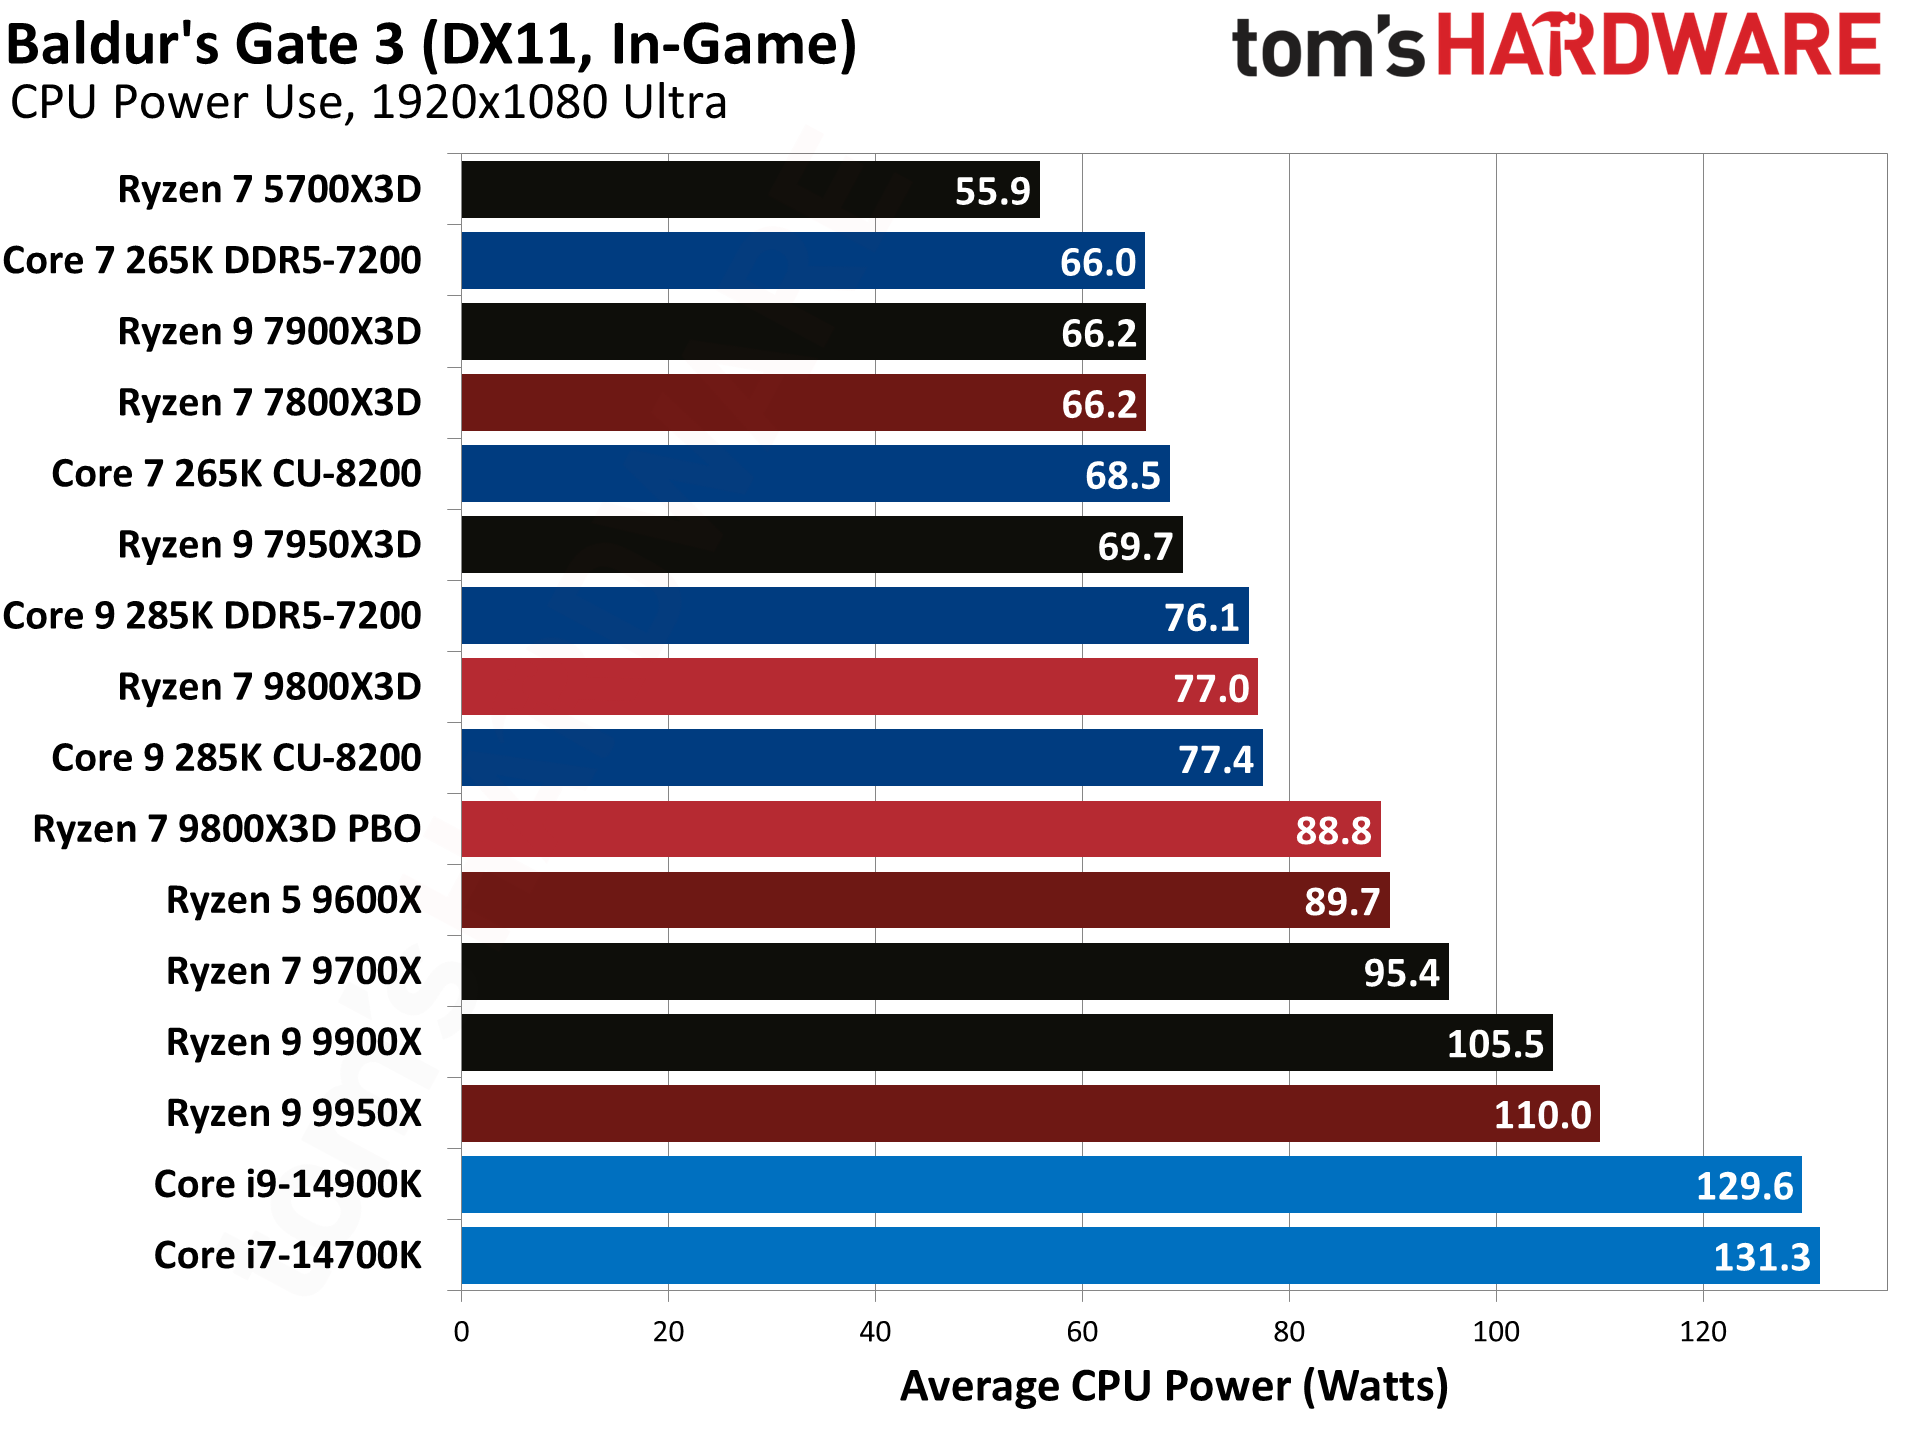
Baldur's Gate 3 really likes X3D as well, and the Zen 5 architecture. This time the 9800X3D beats its predecessor by 25%, with a 44% lead over the 14900K and a 47% lead over the 285K CUDIMM. So this is also one of the few games where Intel's Arrow Lake nearly matches the prior generation Raptor Lake Refresh.
Borderlands 3 Benchmarks — AMD Ryzen 7 9800X3D
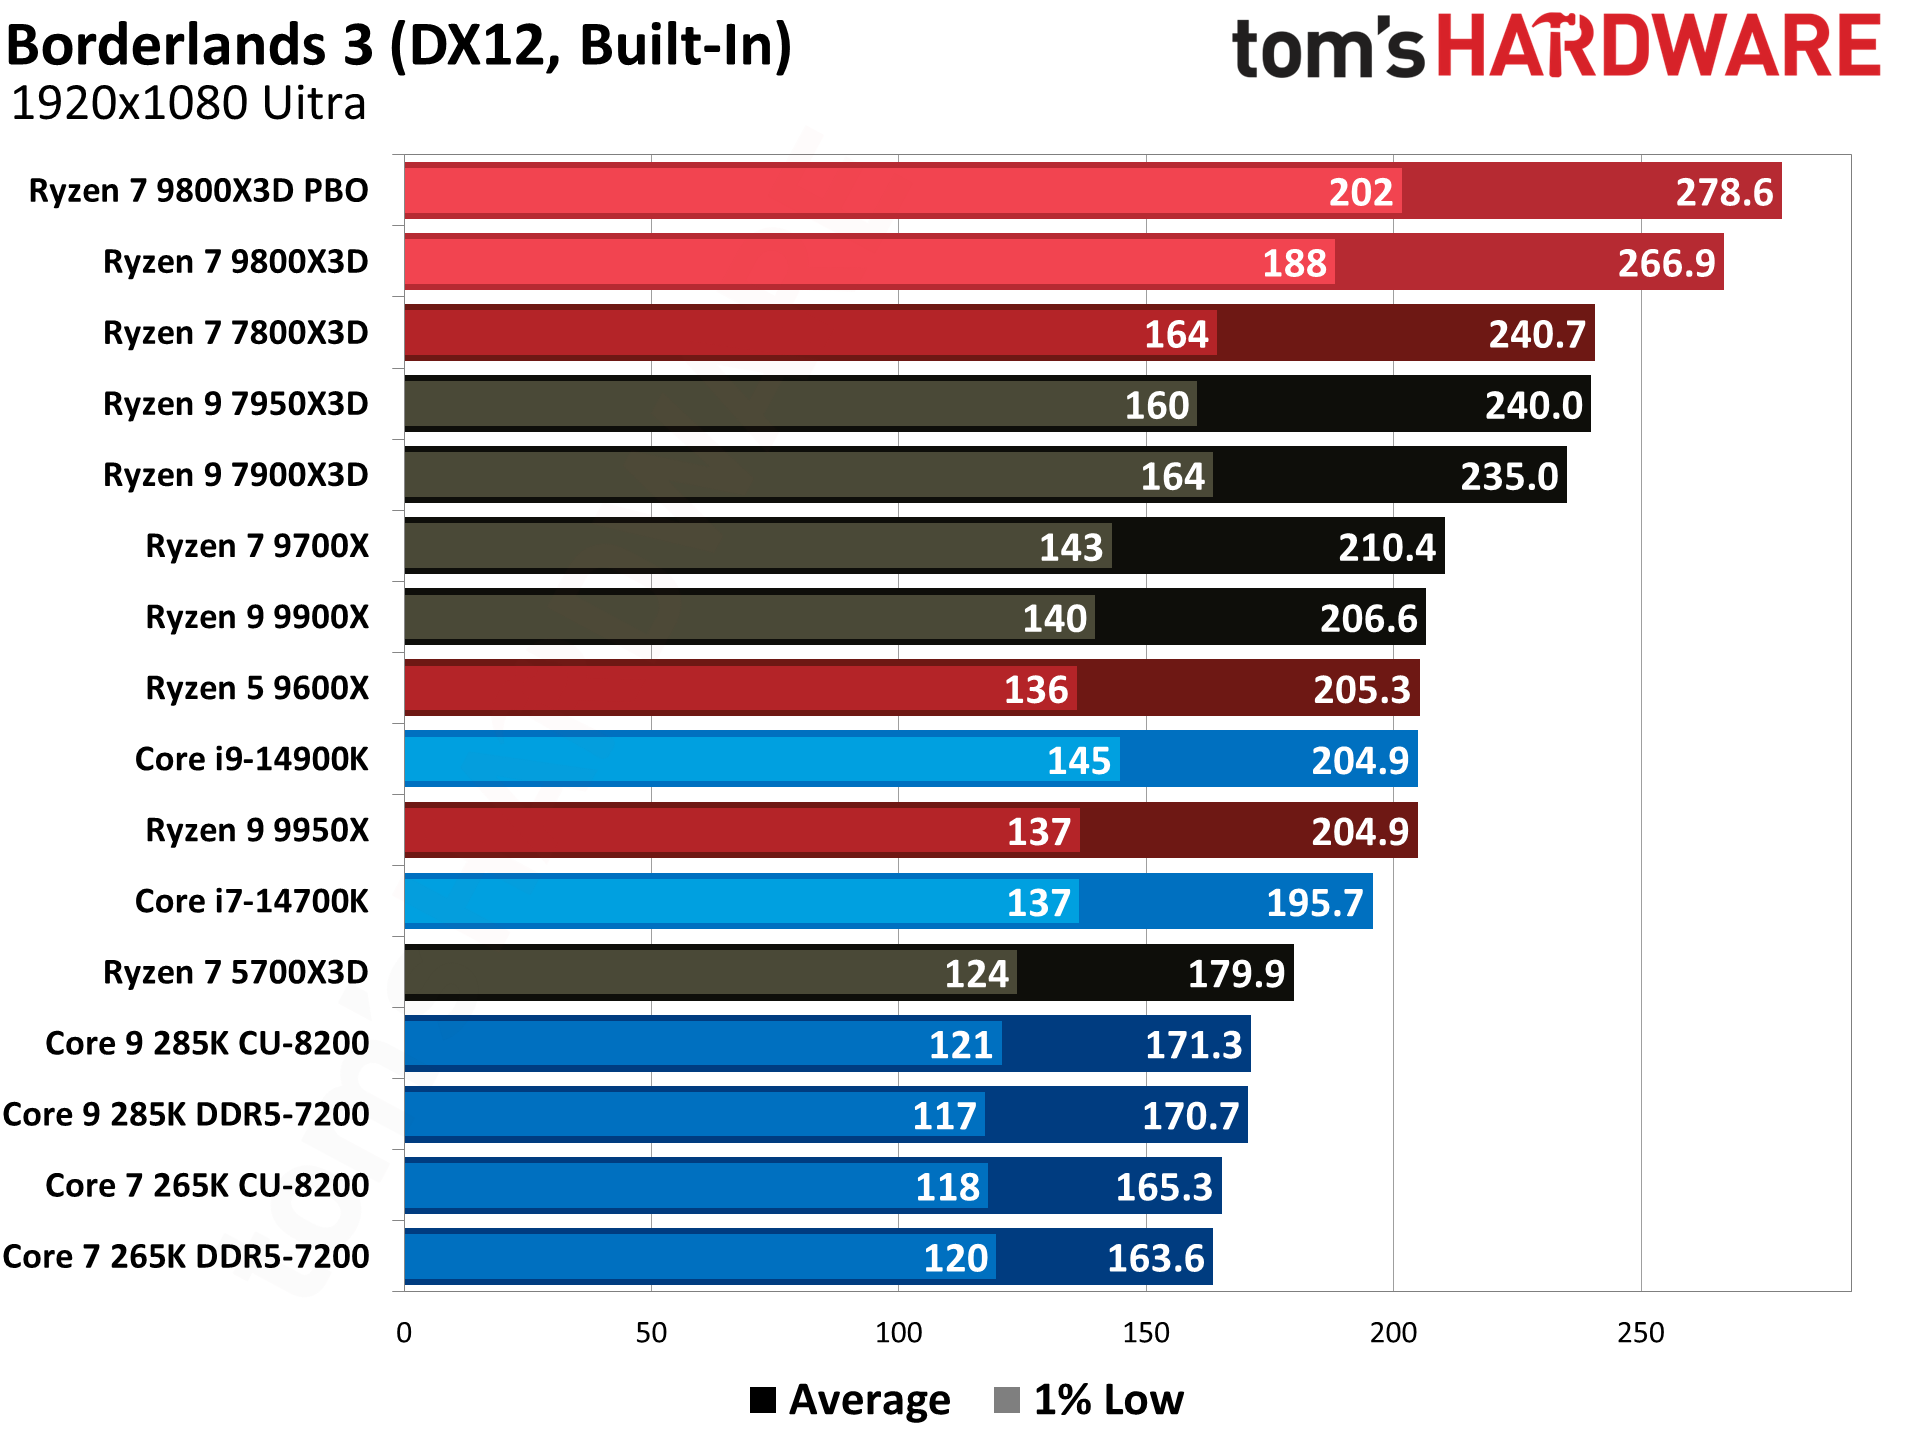
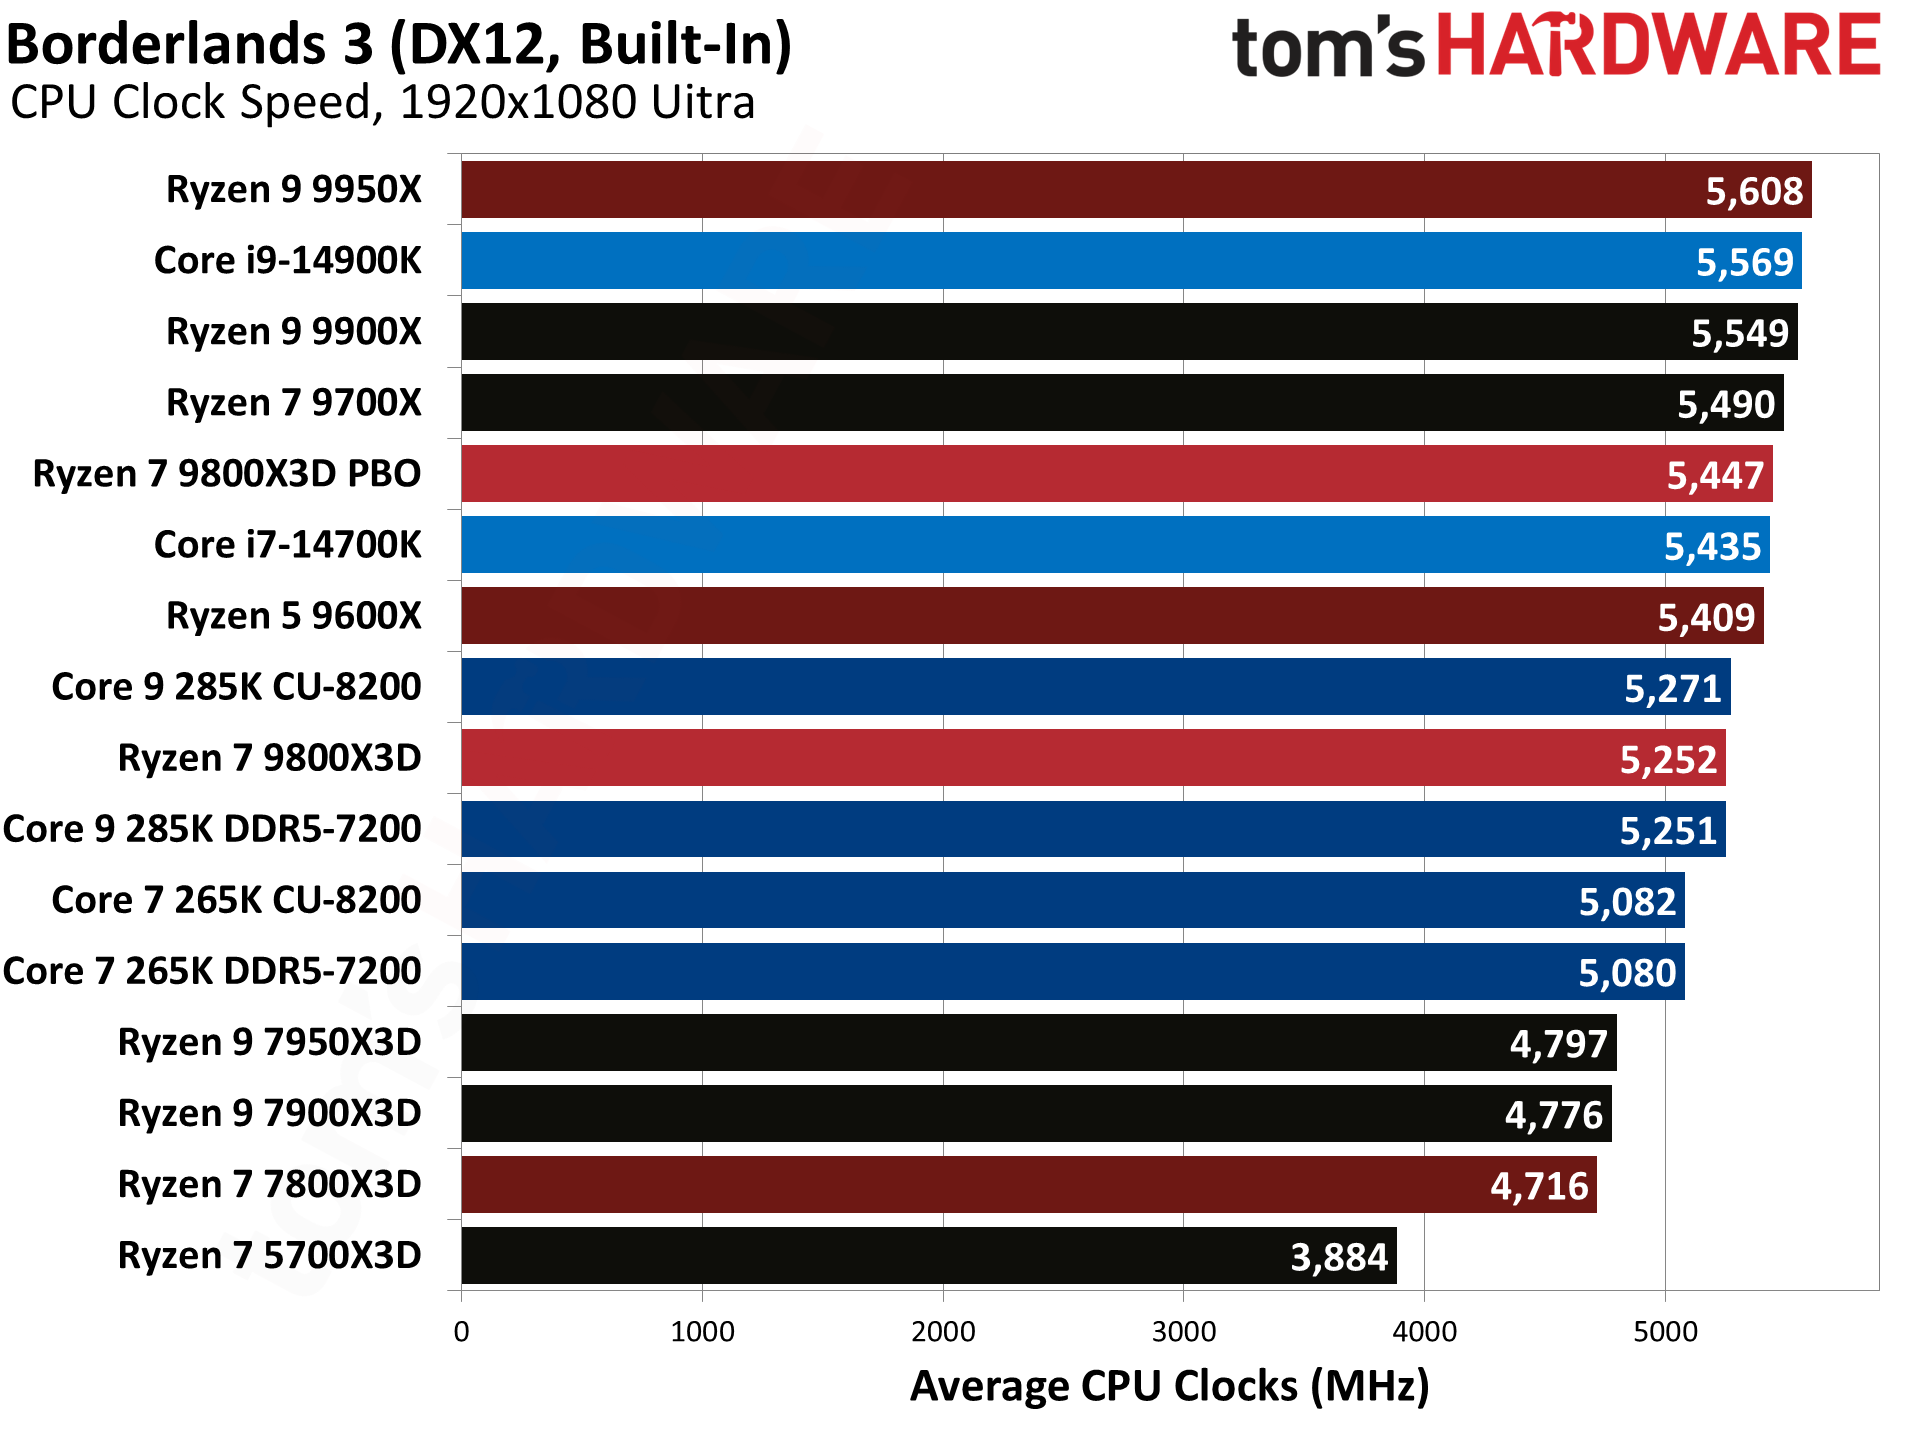
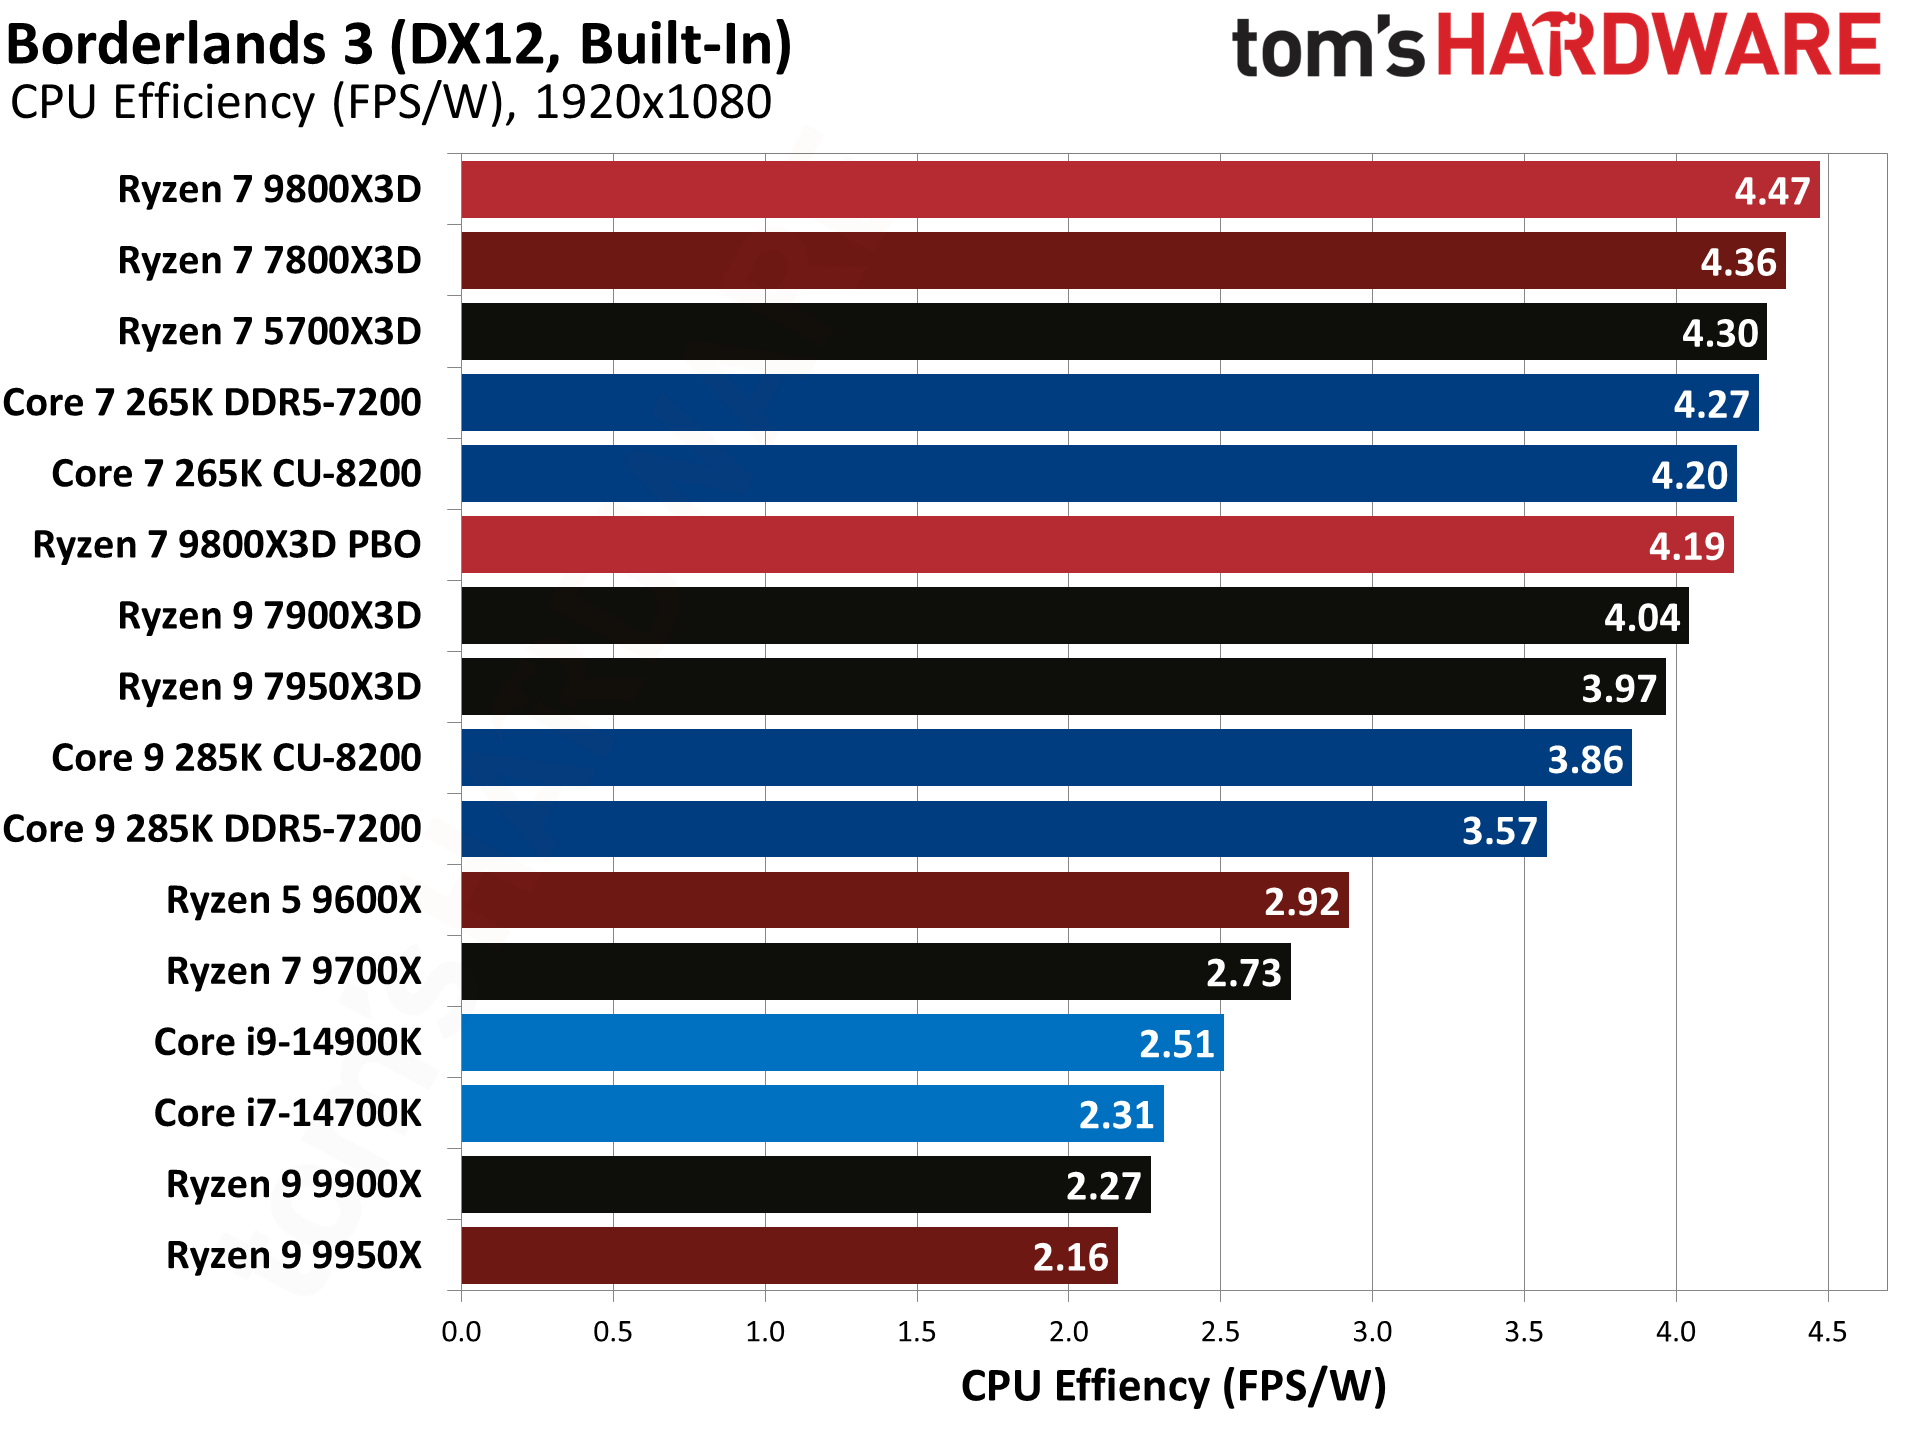
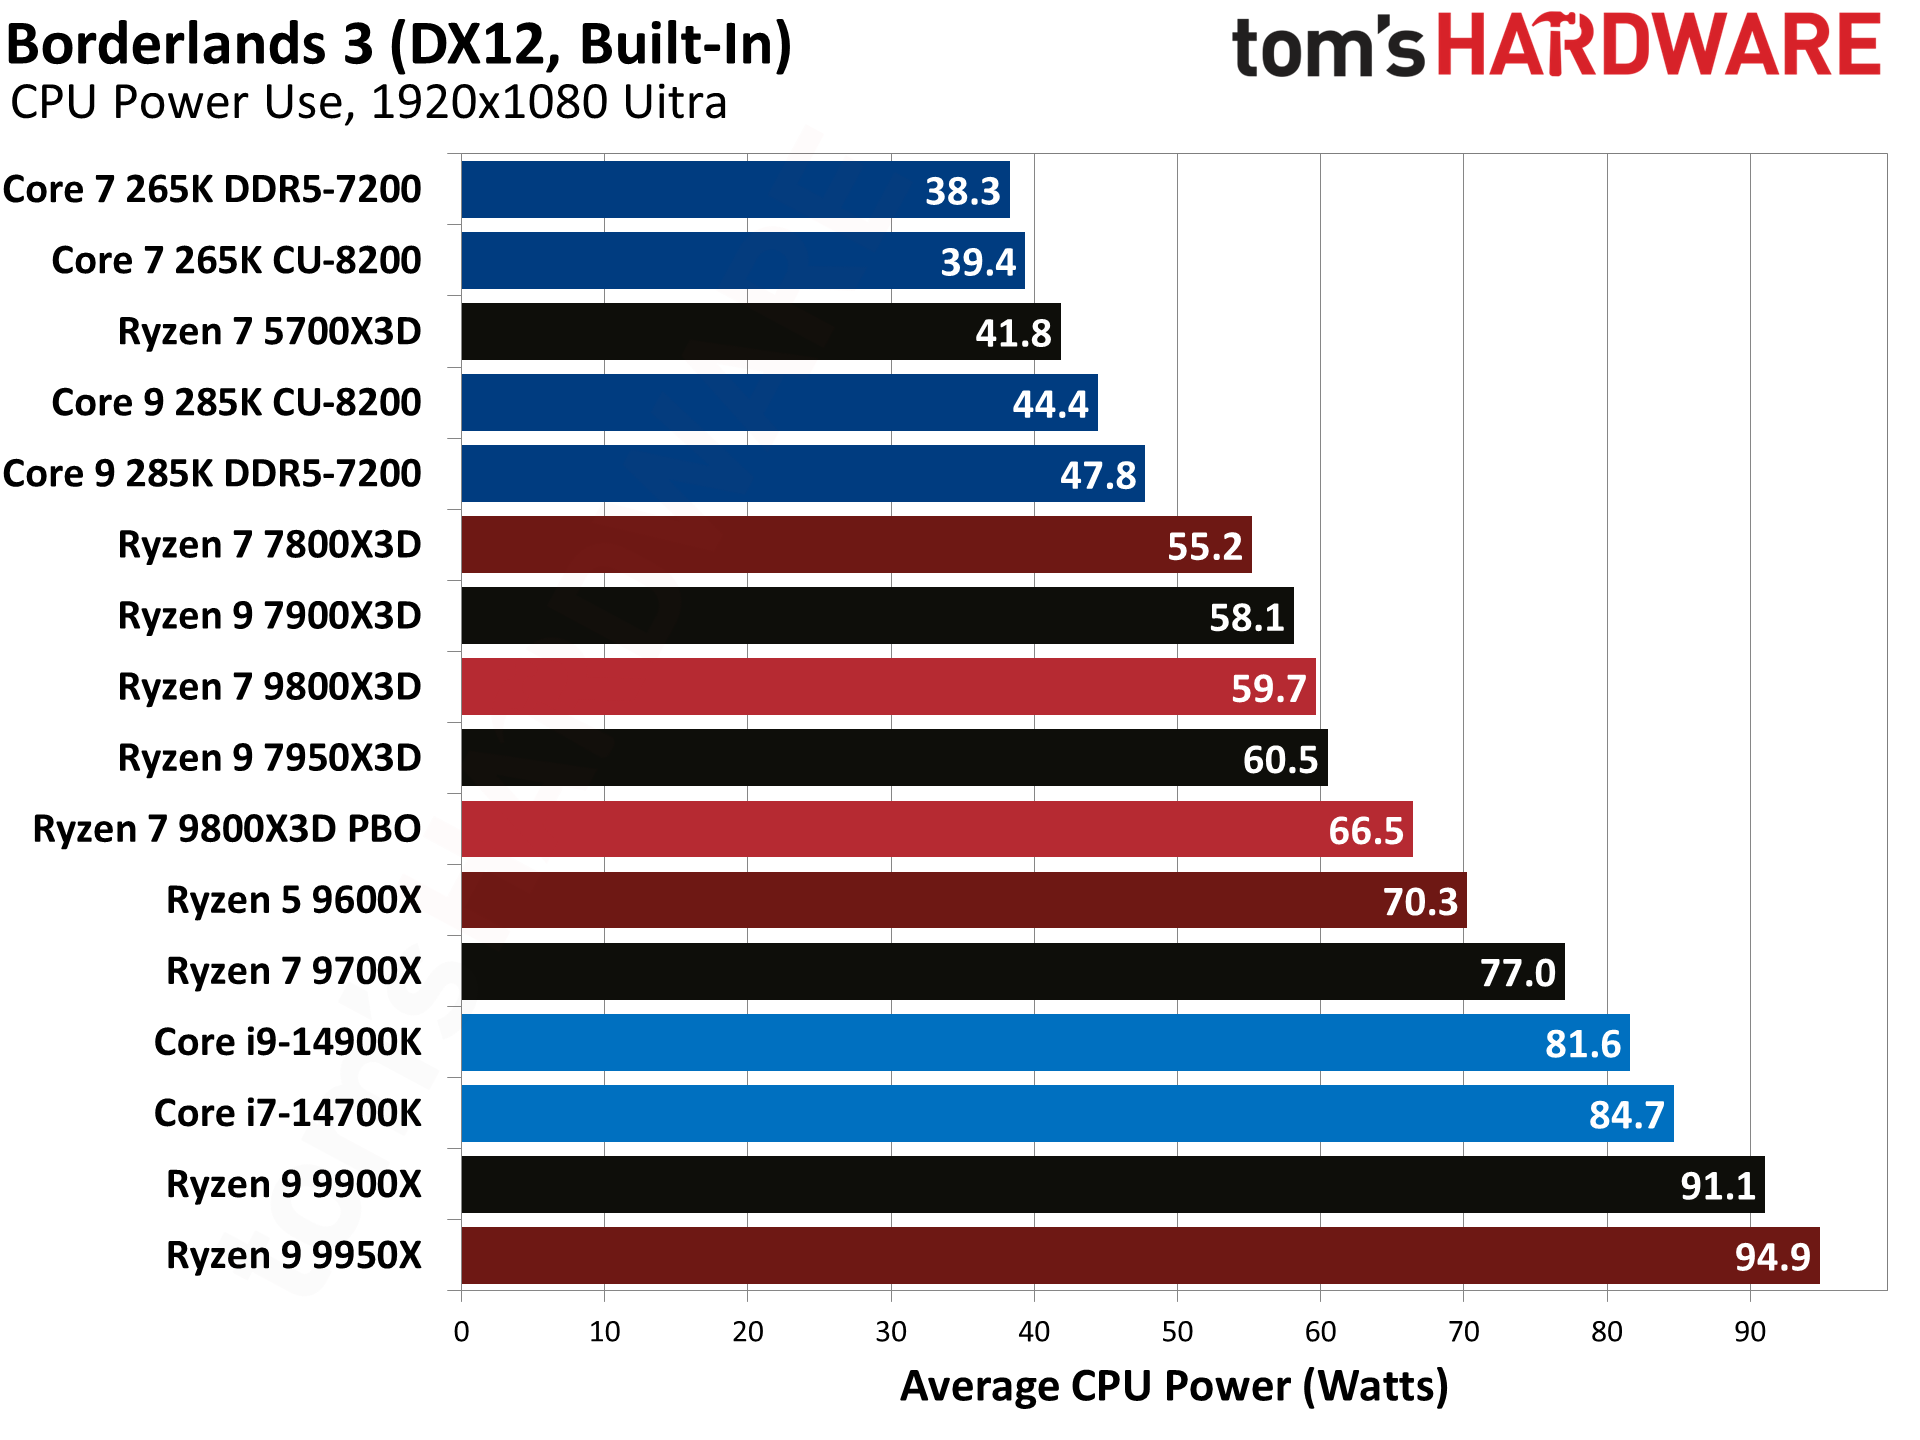
It's worth noting that Borderlands 3 was an AMD promotional title, and that might play a role in its performance. But here the 9800X3D only beats the 7800X3D by 11%, with a 30% lead over the 14900K and a 56% lead over the 285K. That's still a huge loss for Arrow Lake, but somewhat closer on the others.
Cyberpunk 2077 Benchmarks — AMD Ryzen 7 9800X3D
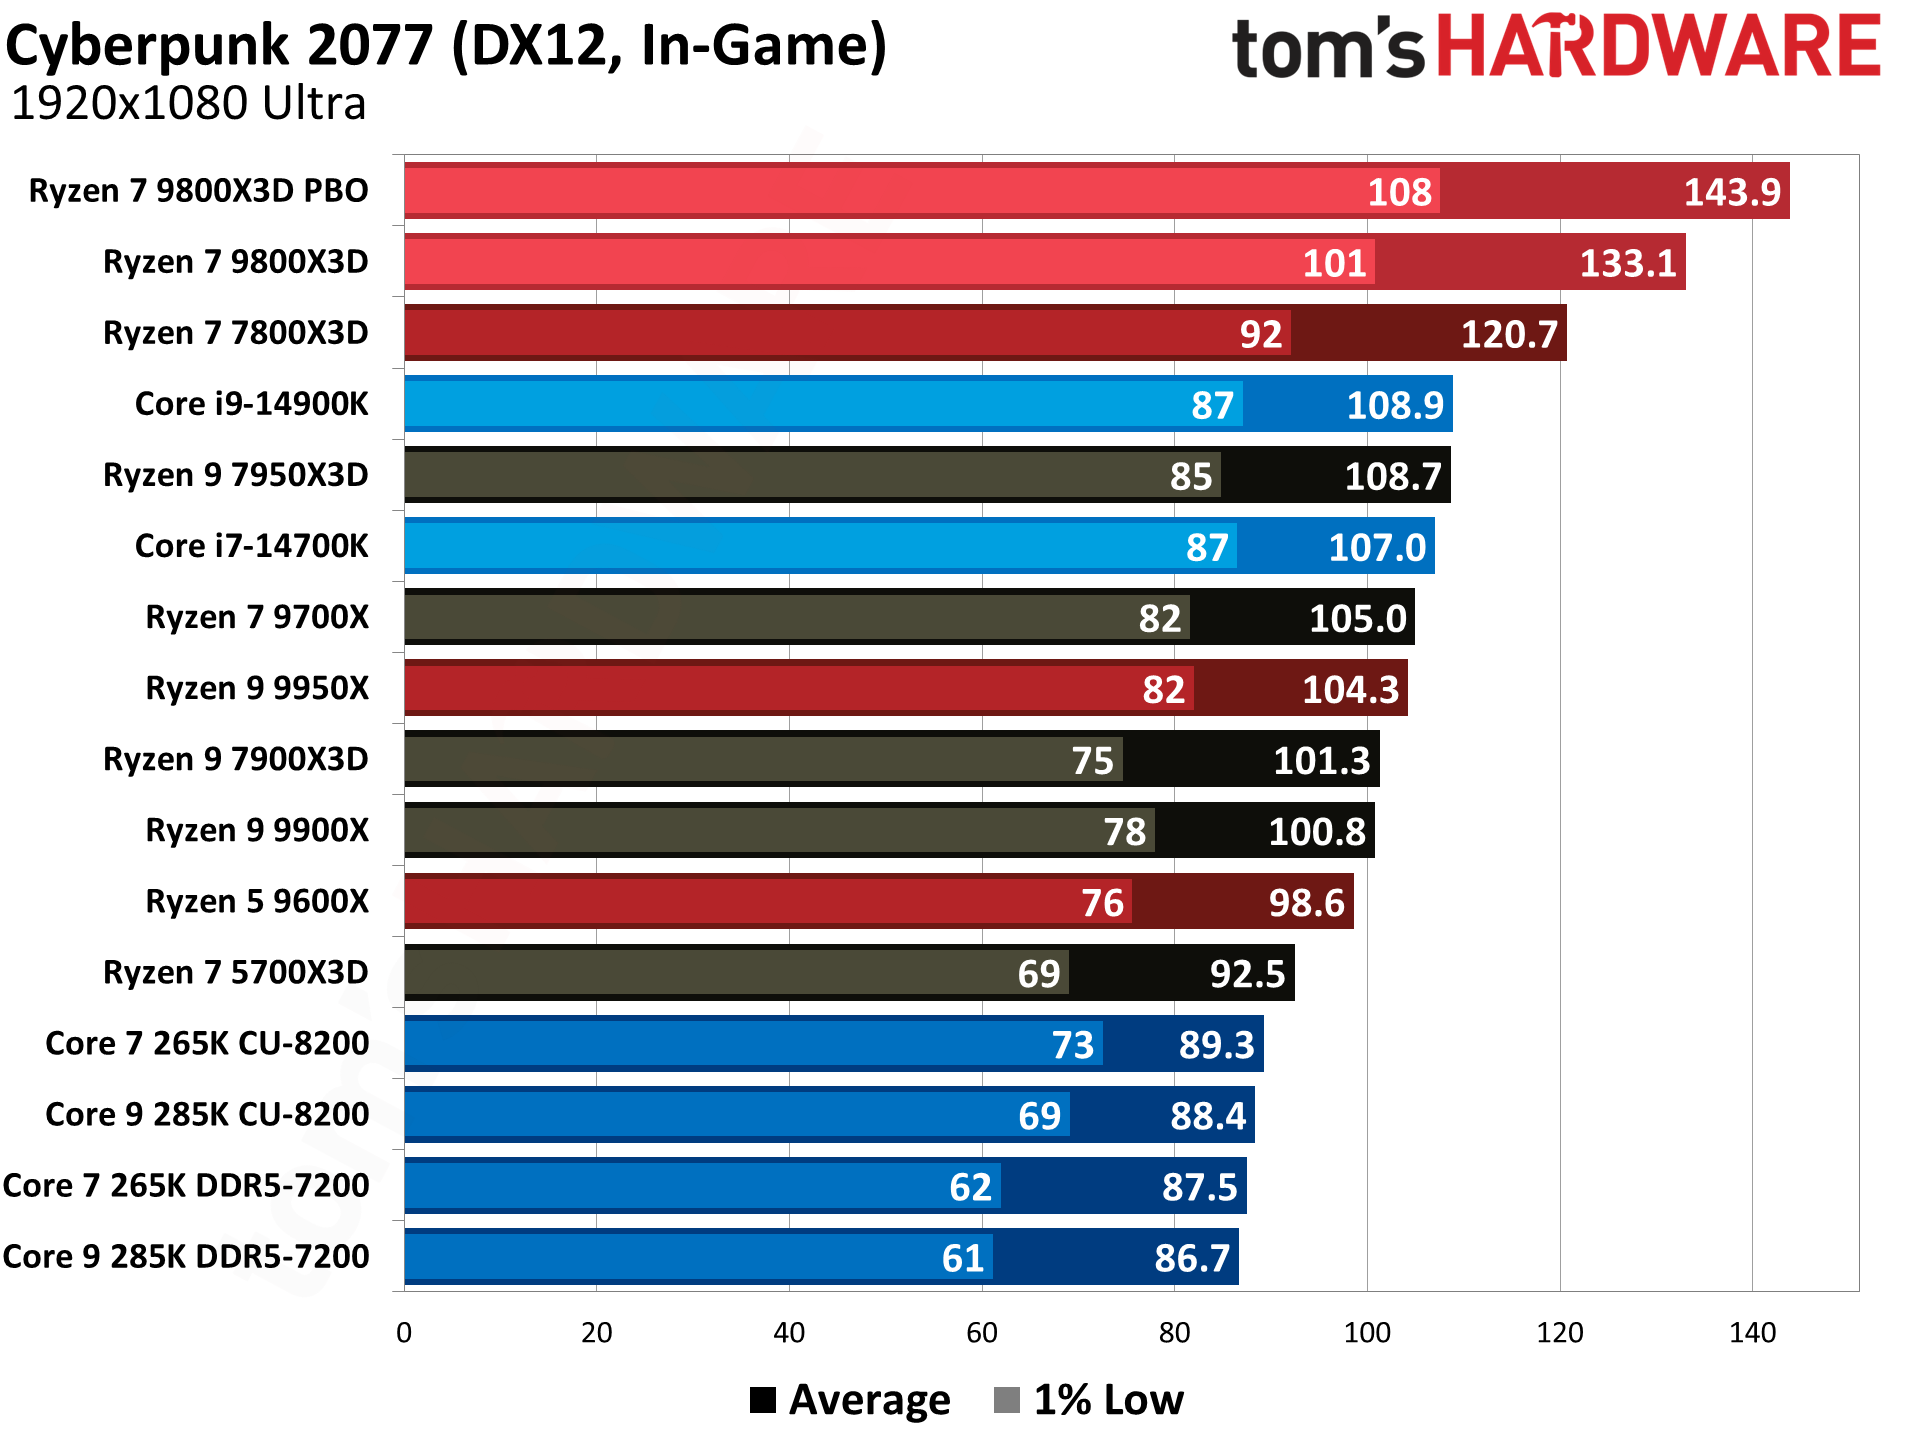
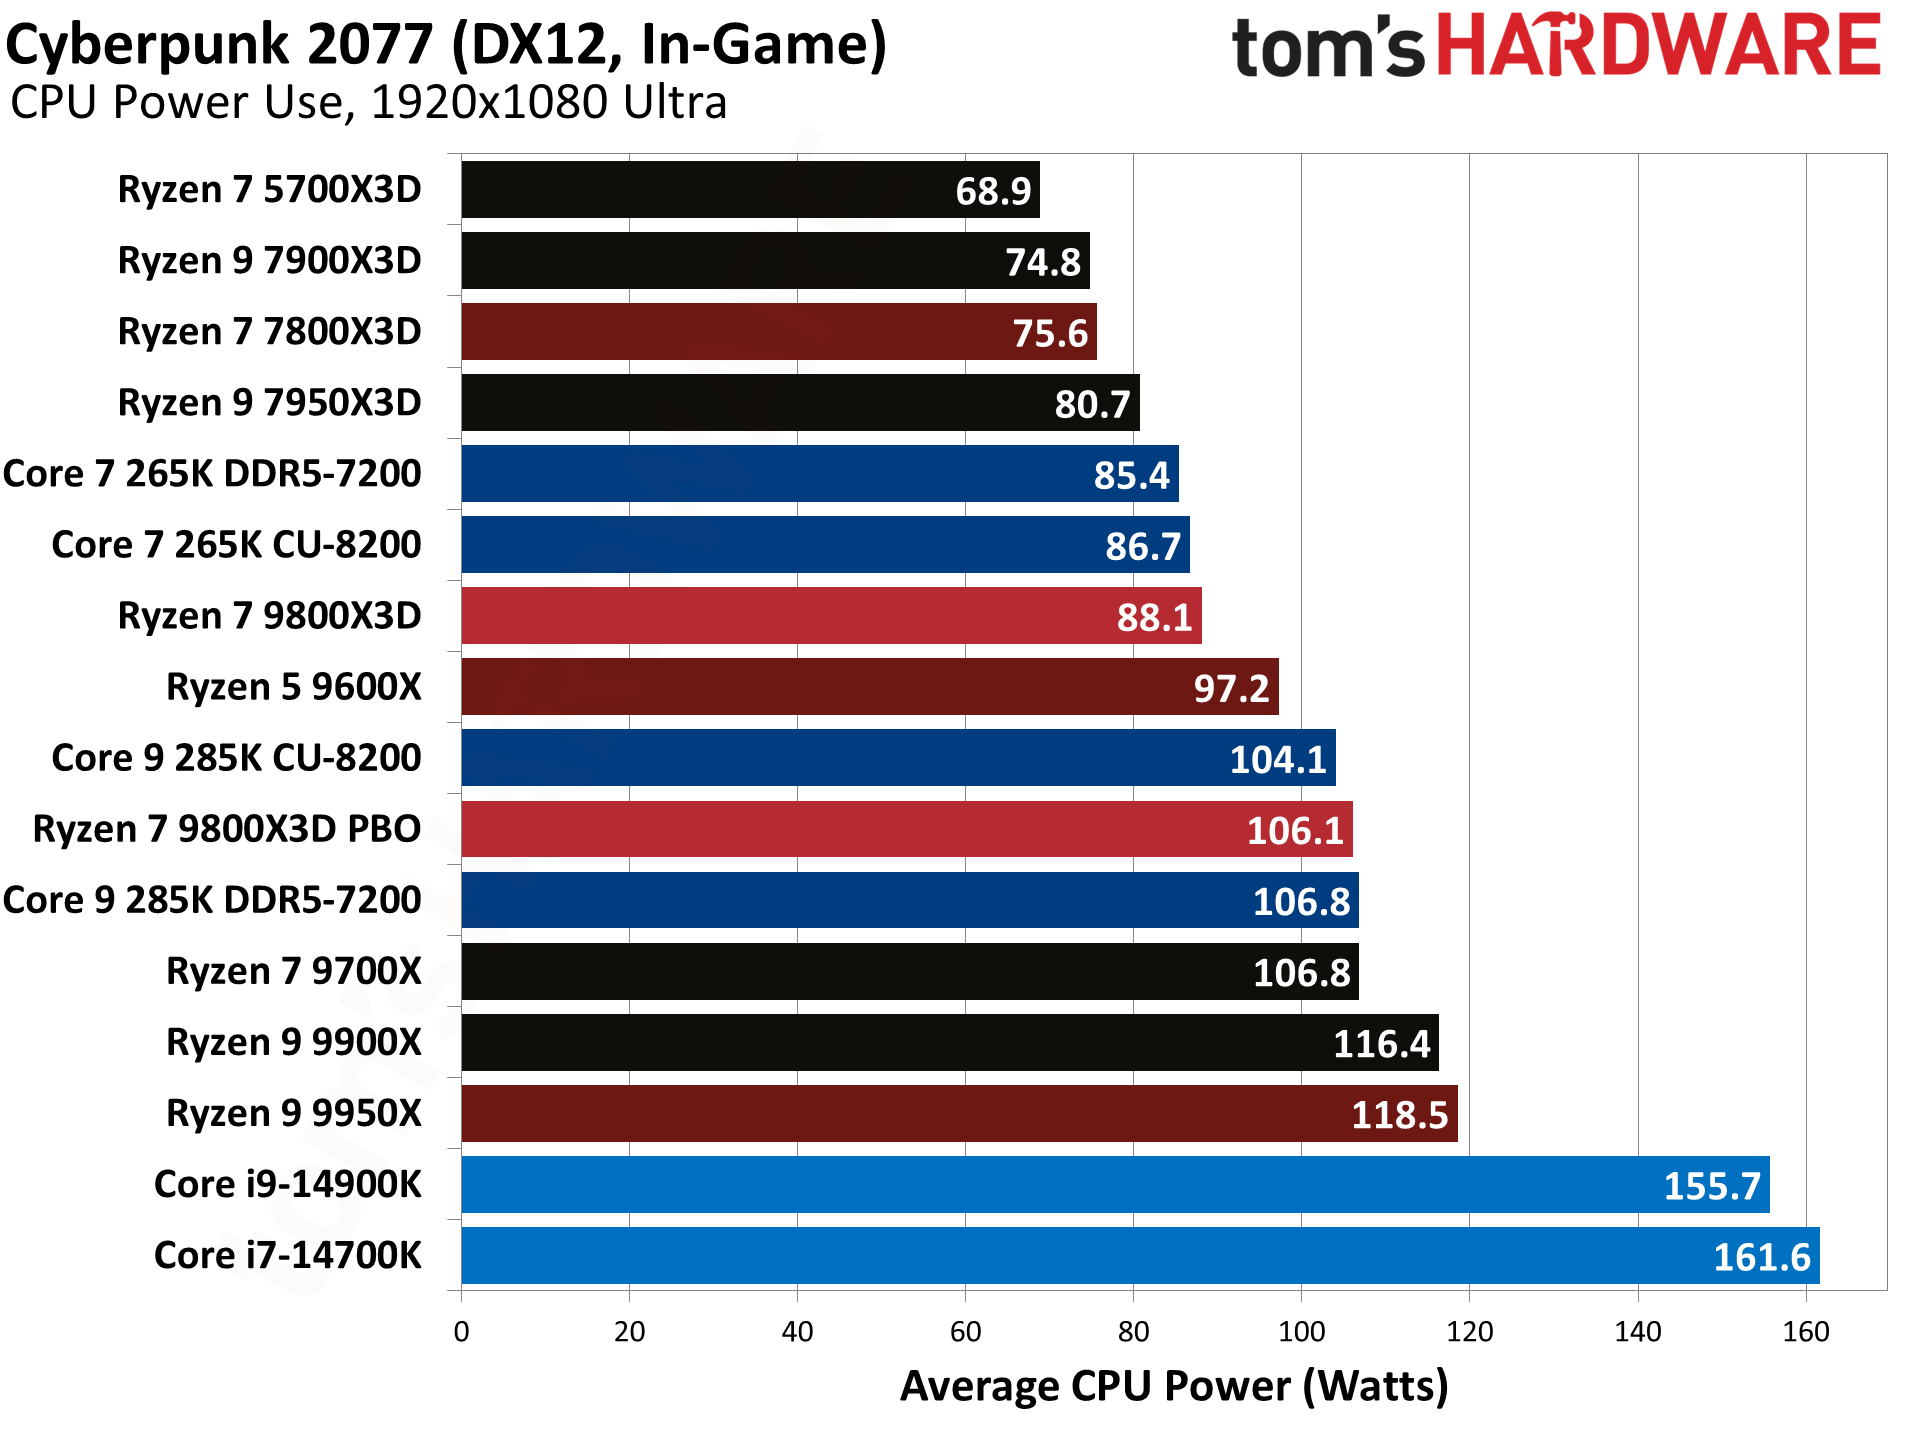
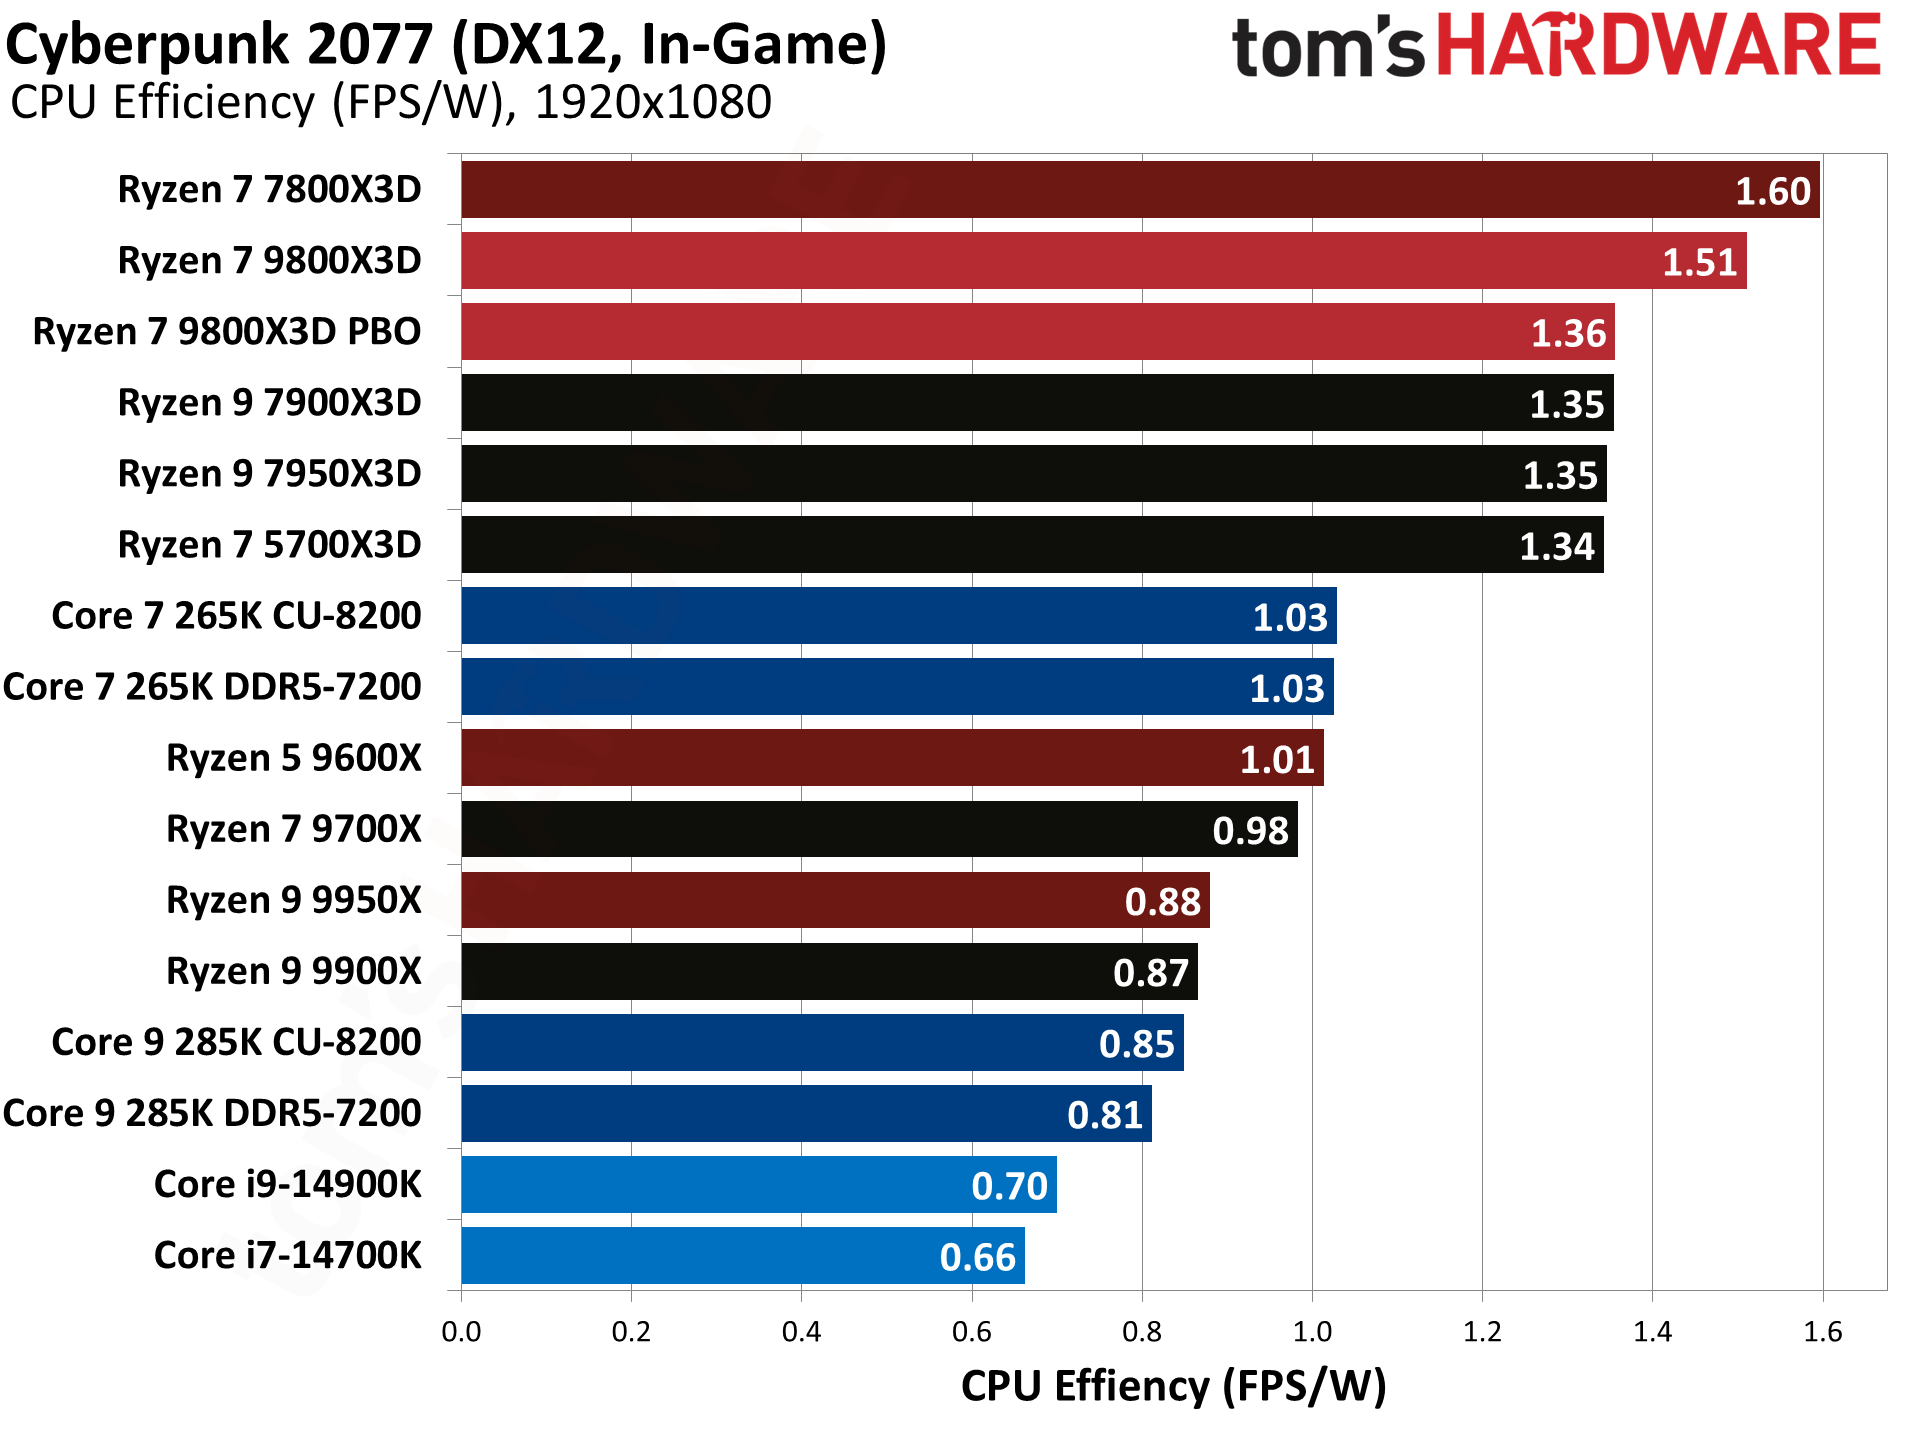
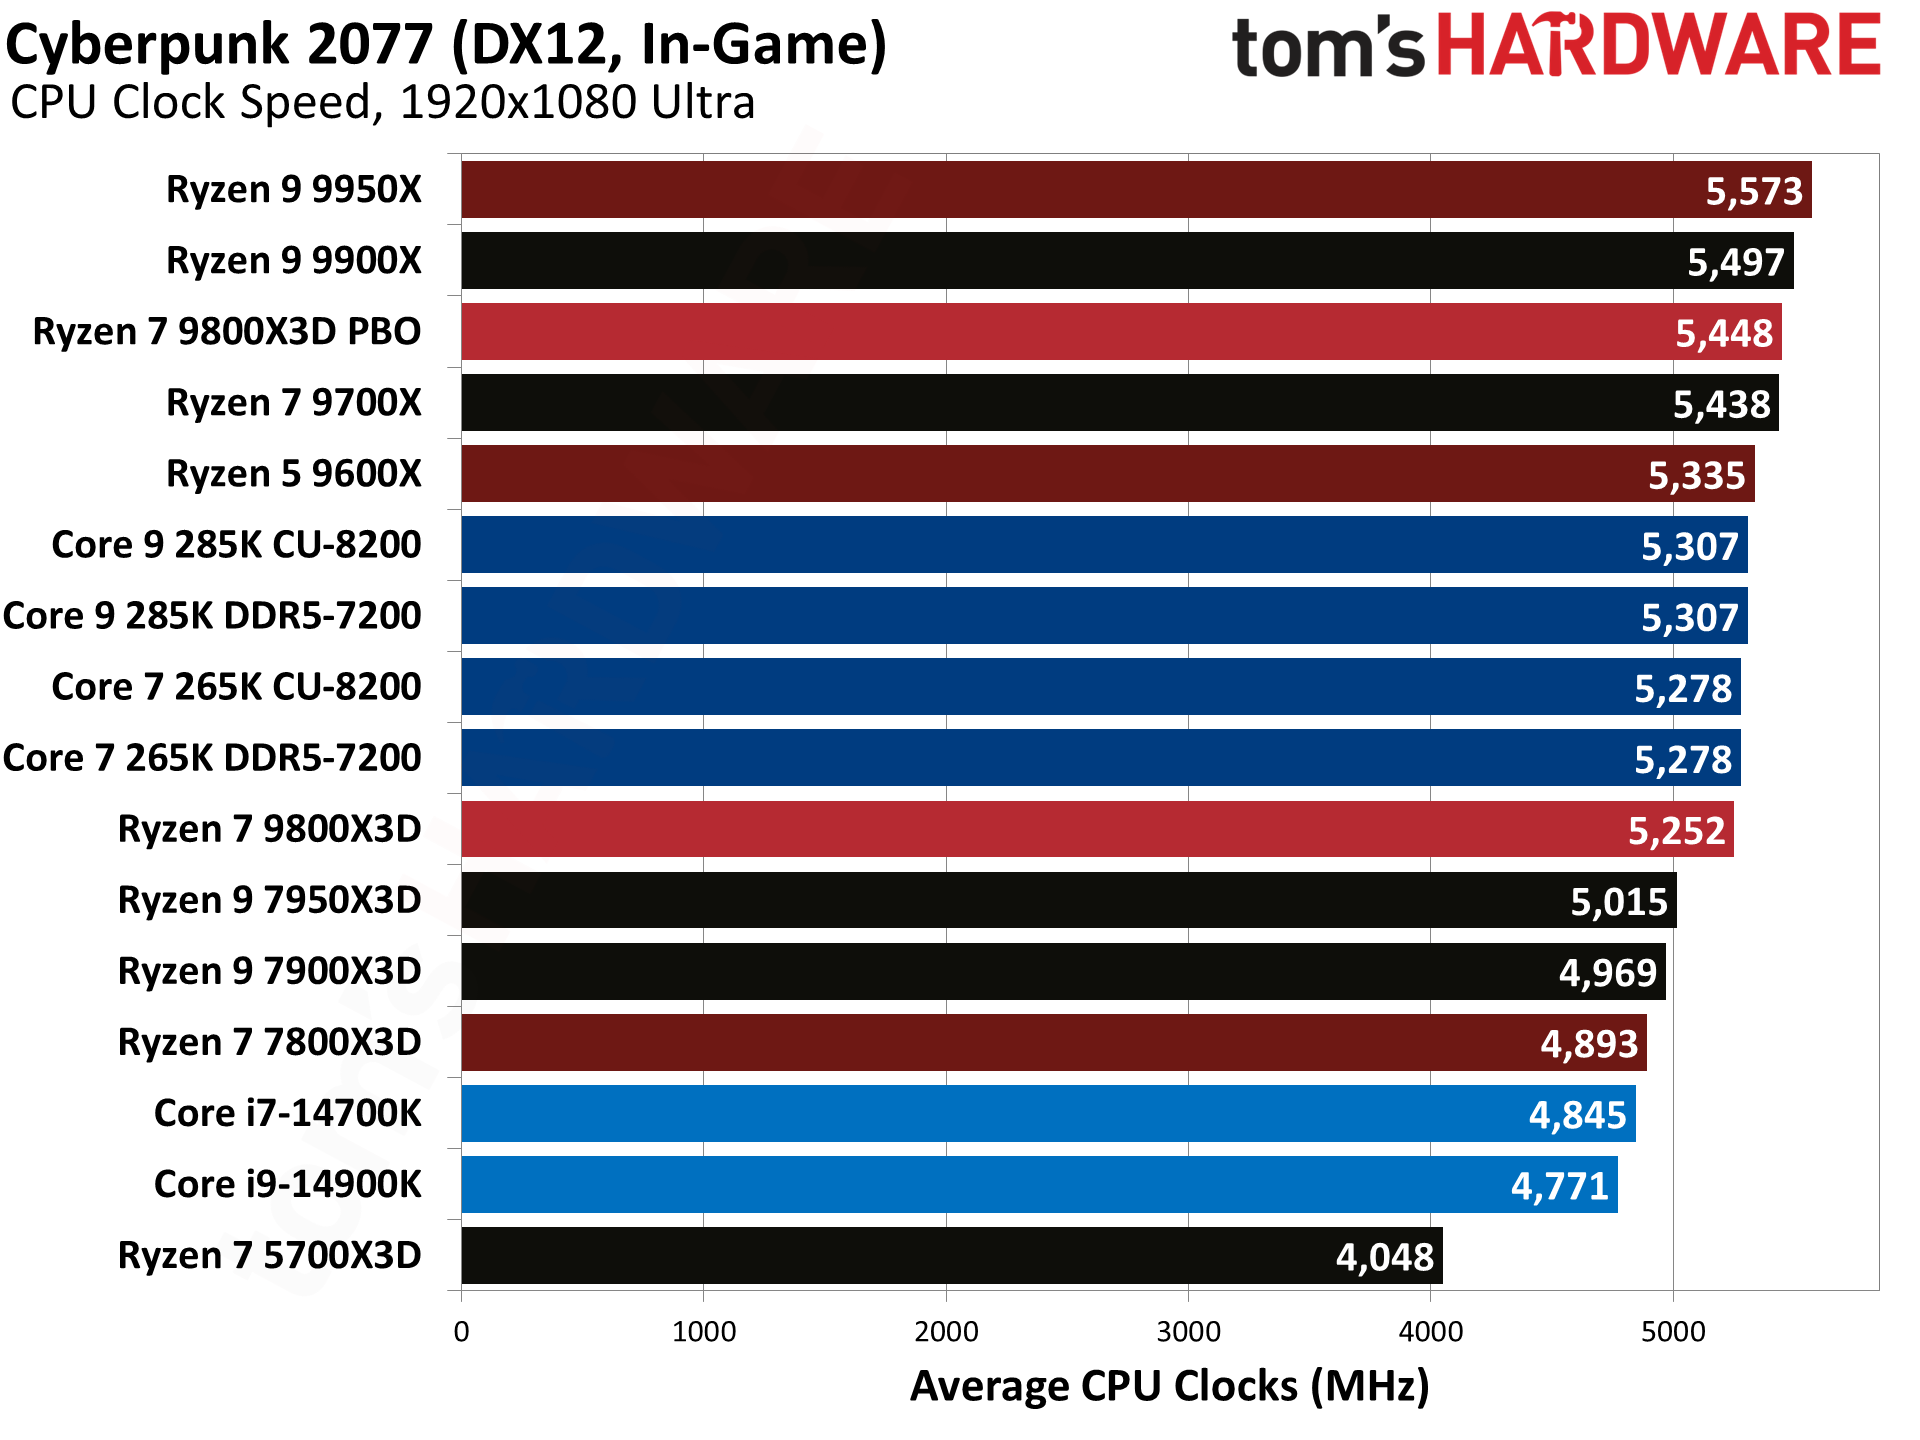
Cyberpunk 2077 can be an incredibly GPU heavy game with ray tracing, and we're opting for the more CPU constrained ultra (non-RT) settings, without upscaling — and note that none of our CPU gaming tests have upscaling of any form enabled. Even without RT, it's still more GPU limited than many of our other results, with the 9800X3D delivering a 10% lead over its predecessor, 22% lead over the 14900K, and a still very large 51% lead over the 285K.
F1 2024 Benchmarks — AMD Ryzen 7 9800X3D
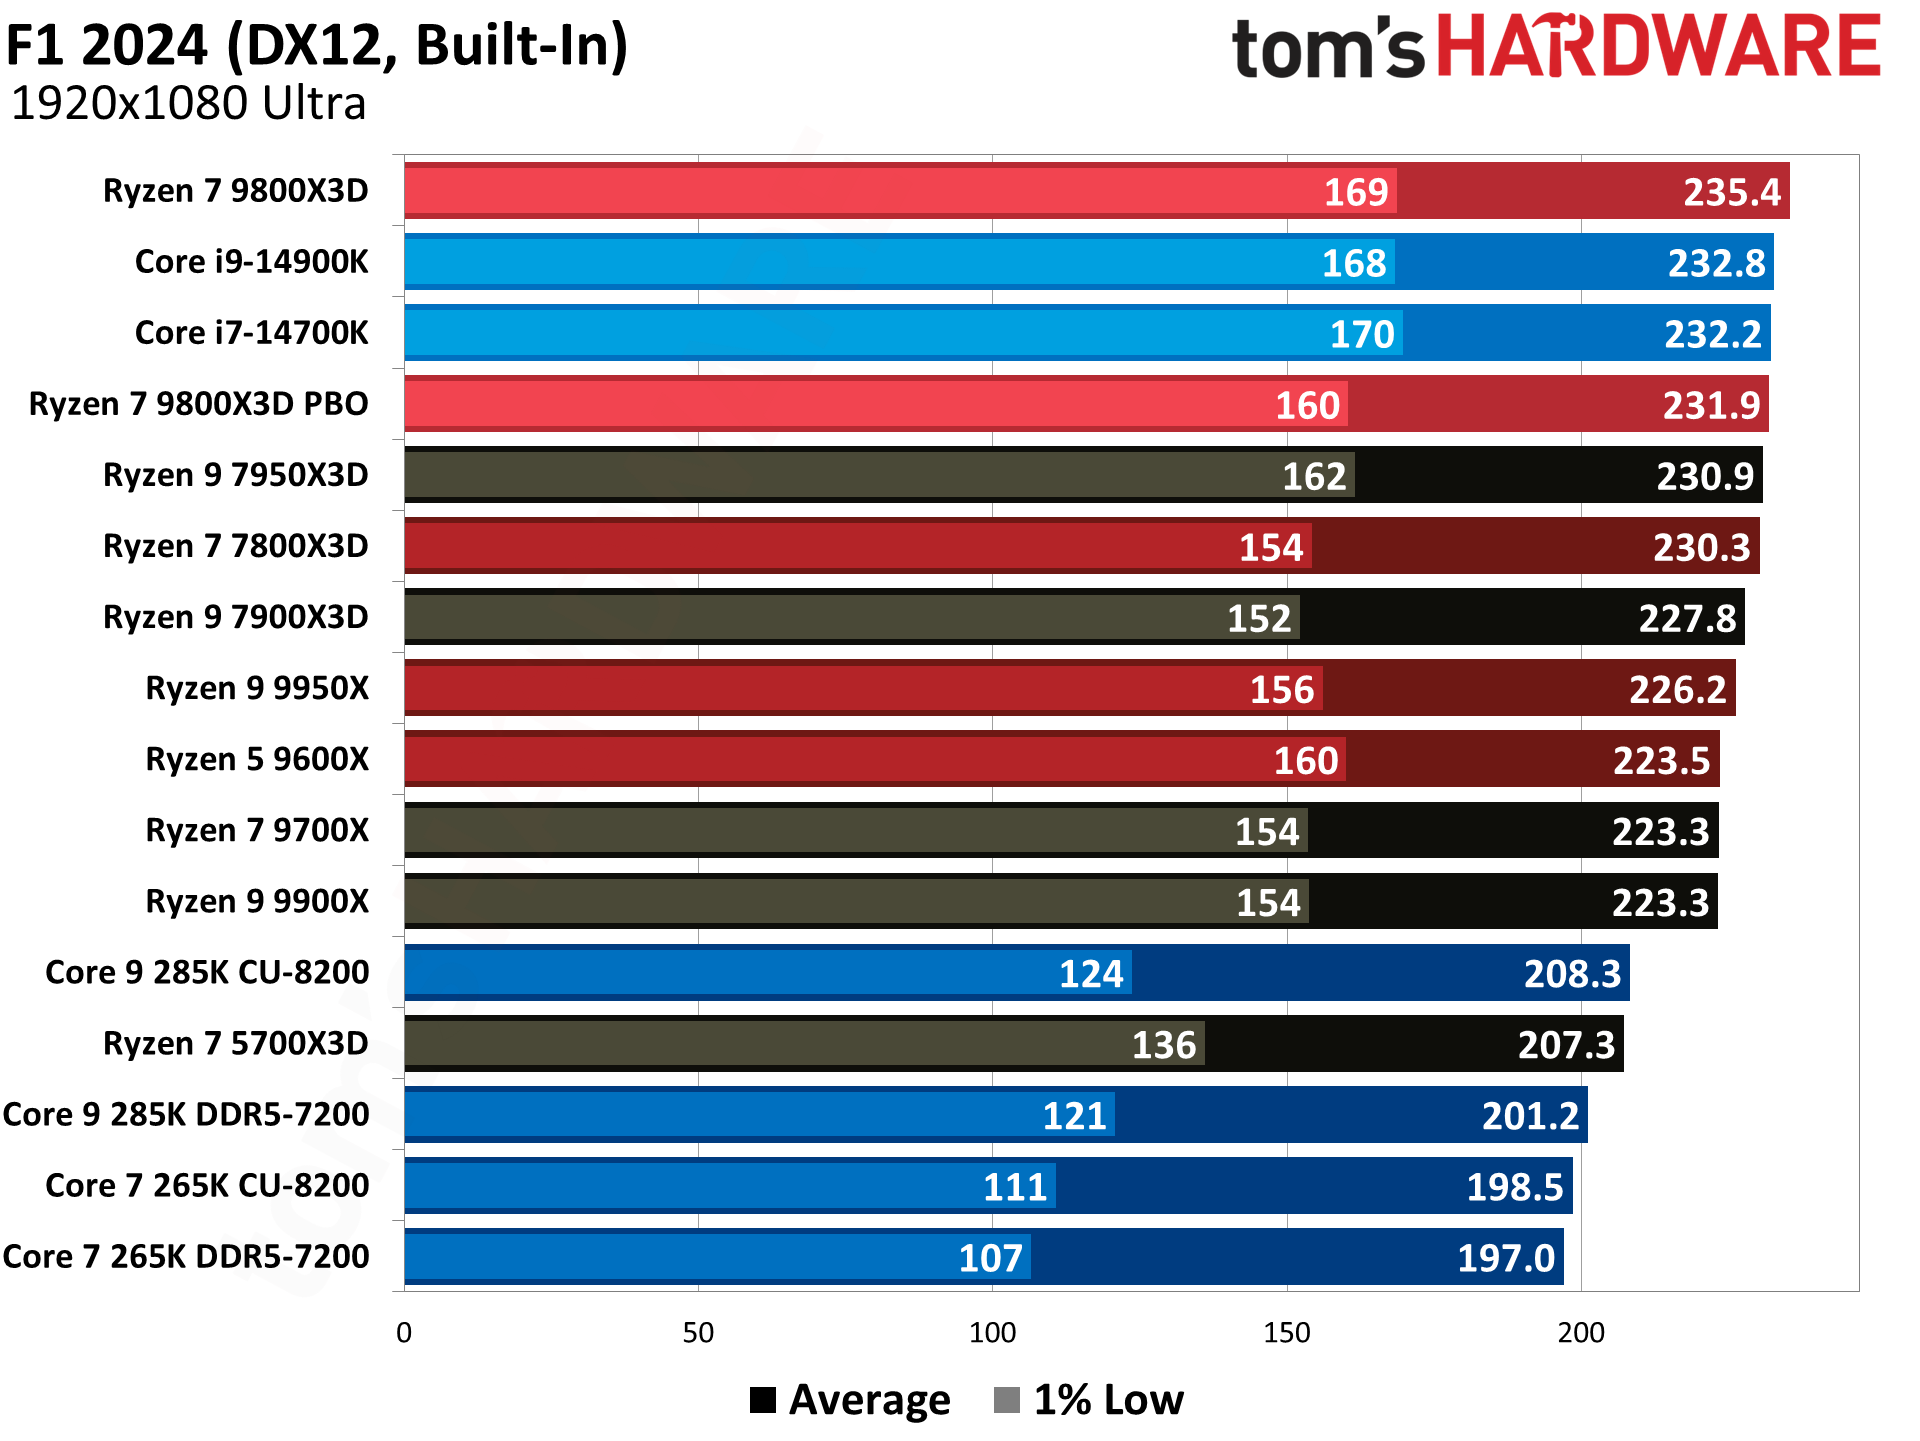
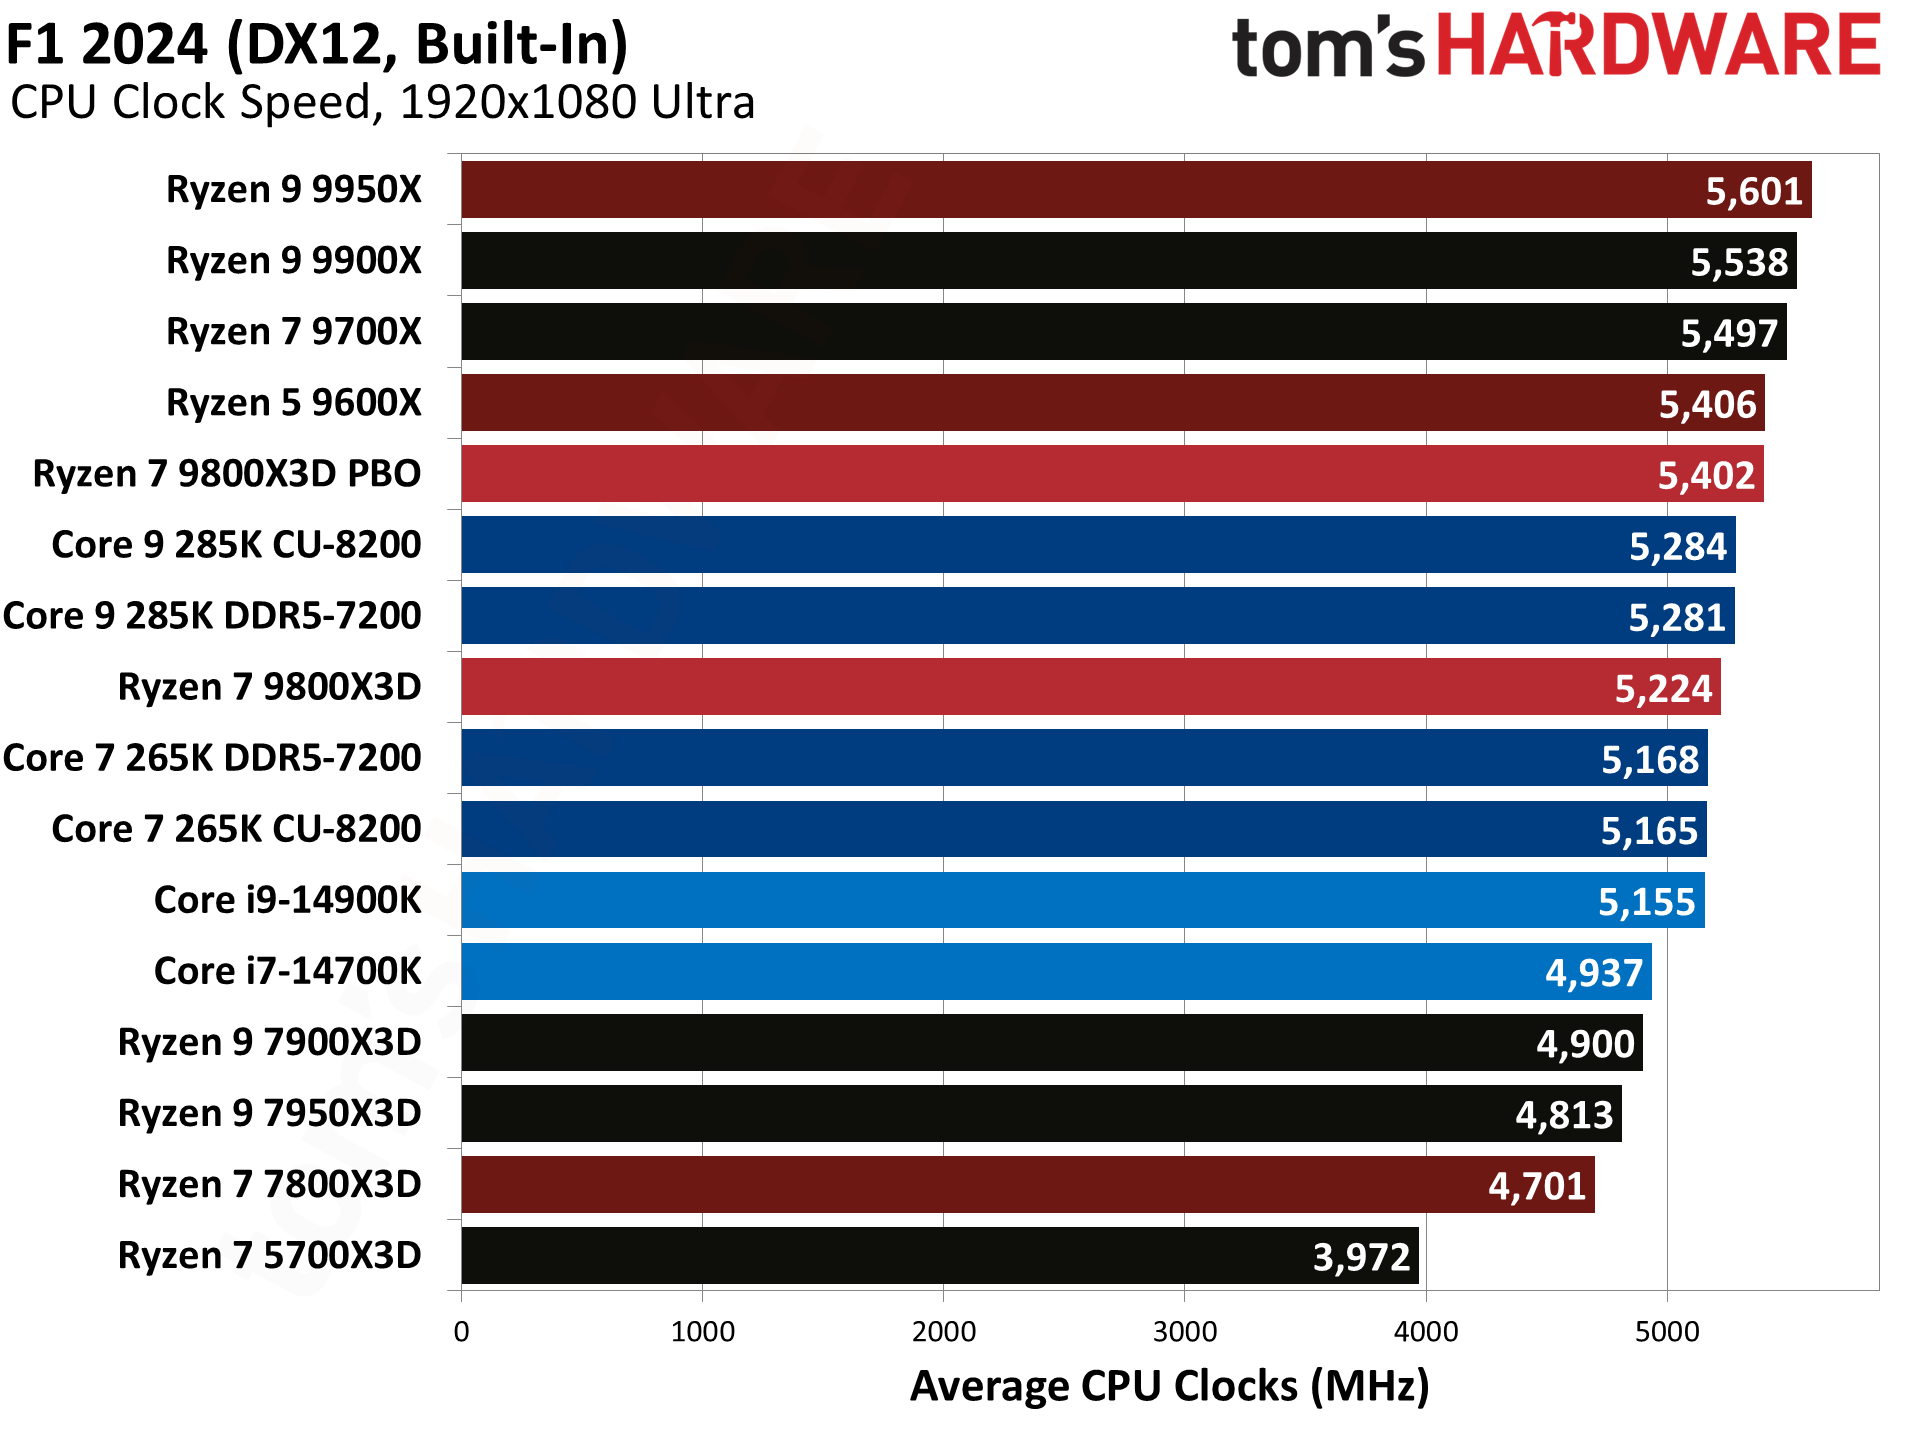
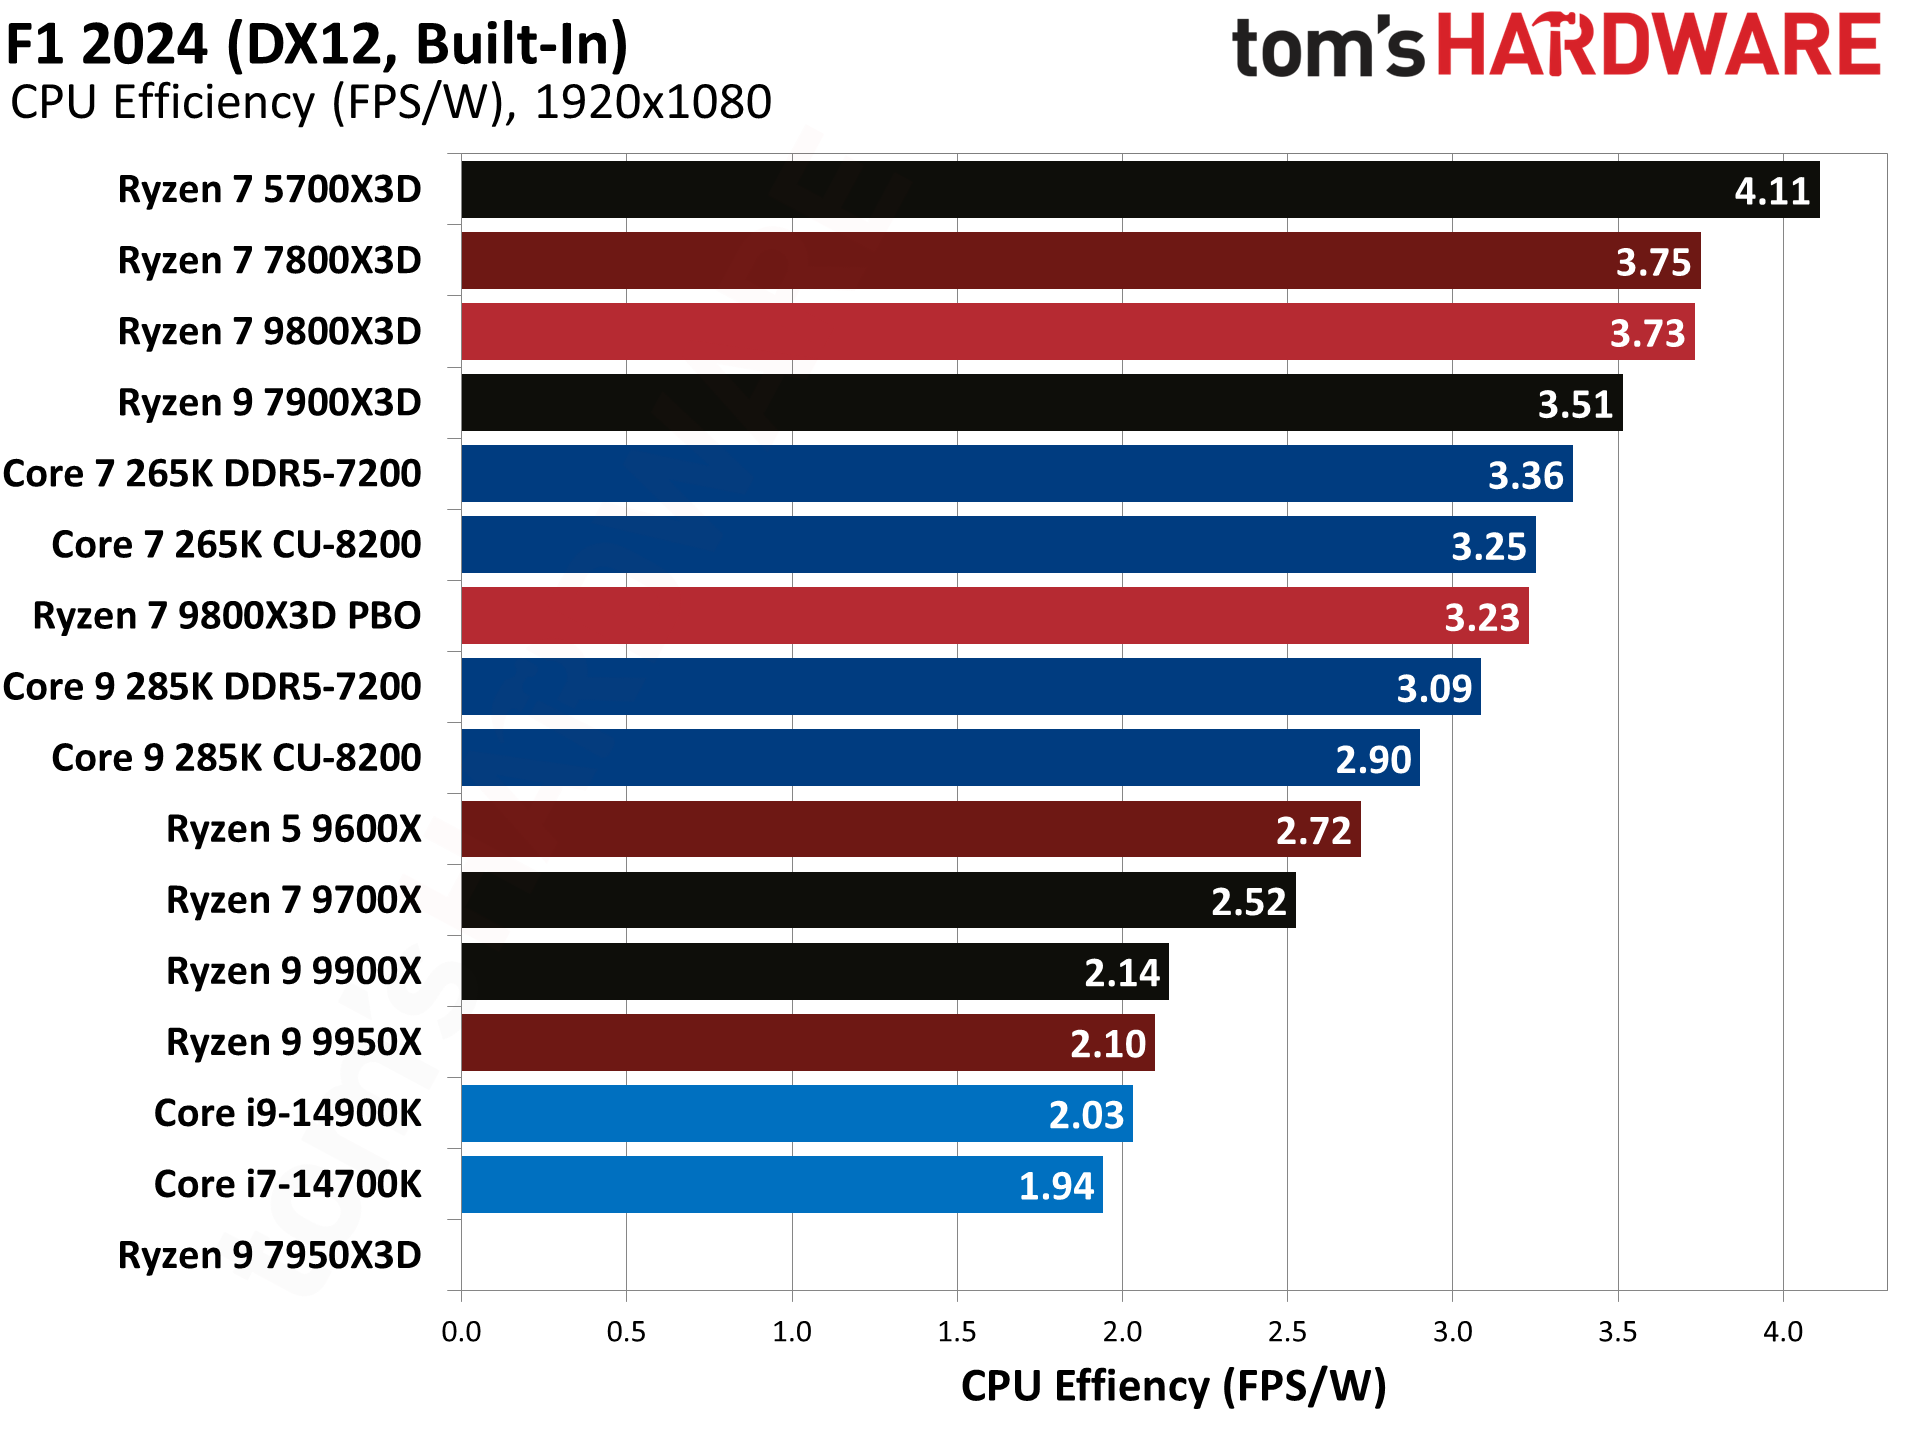
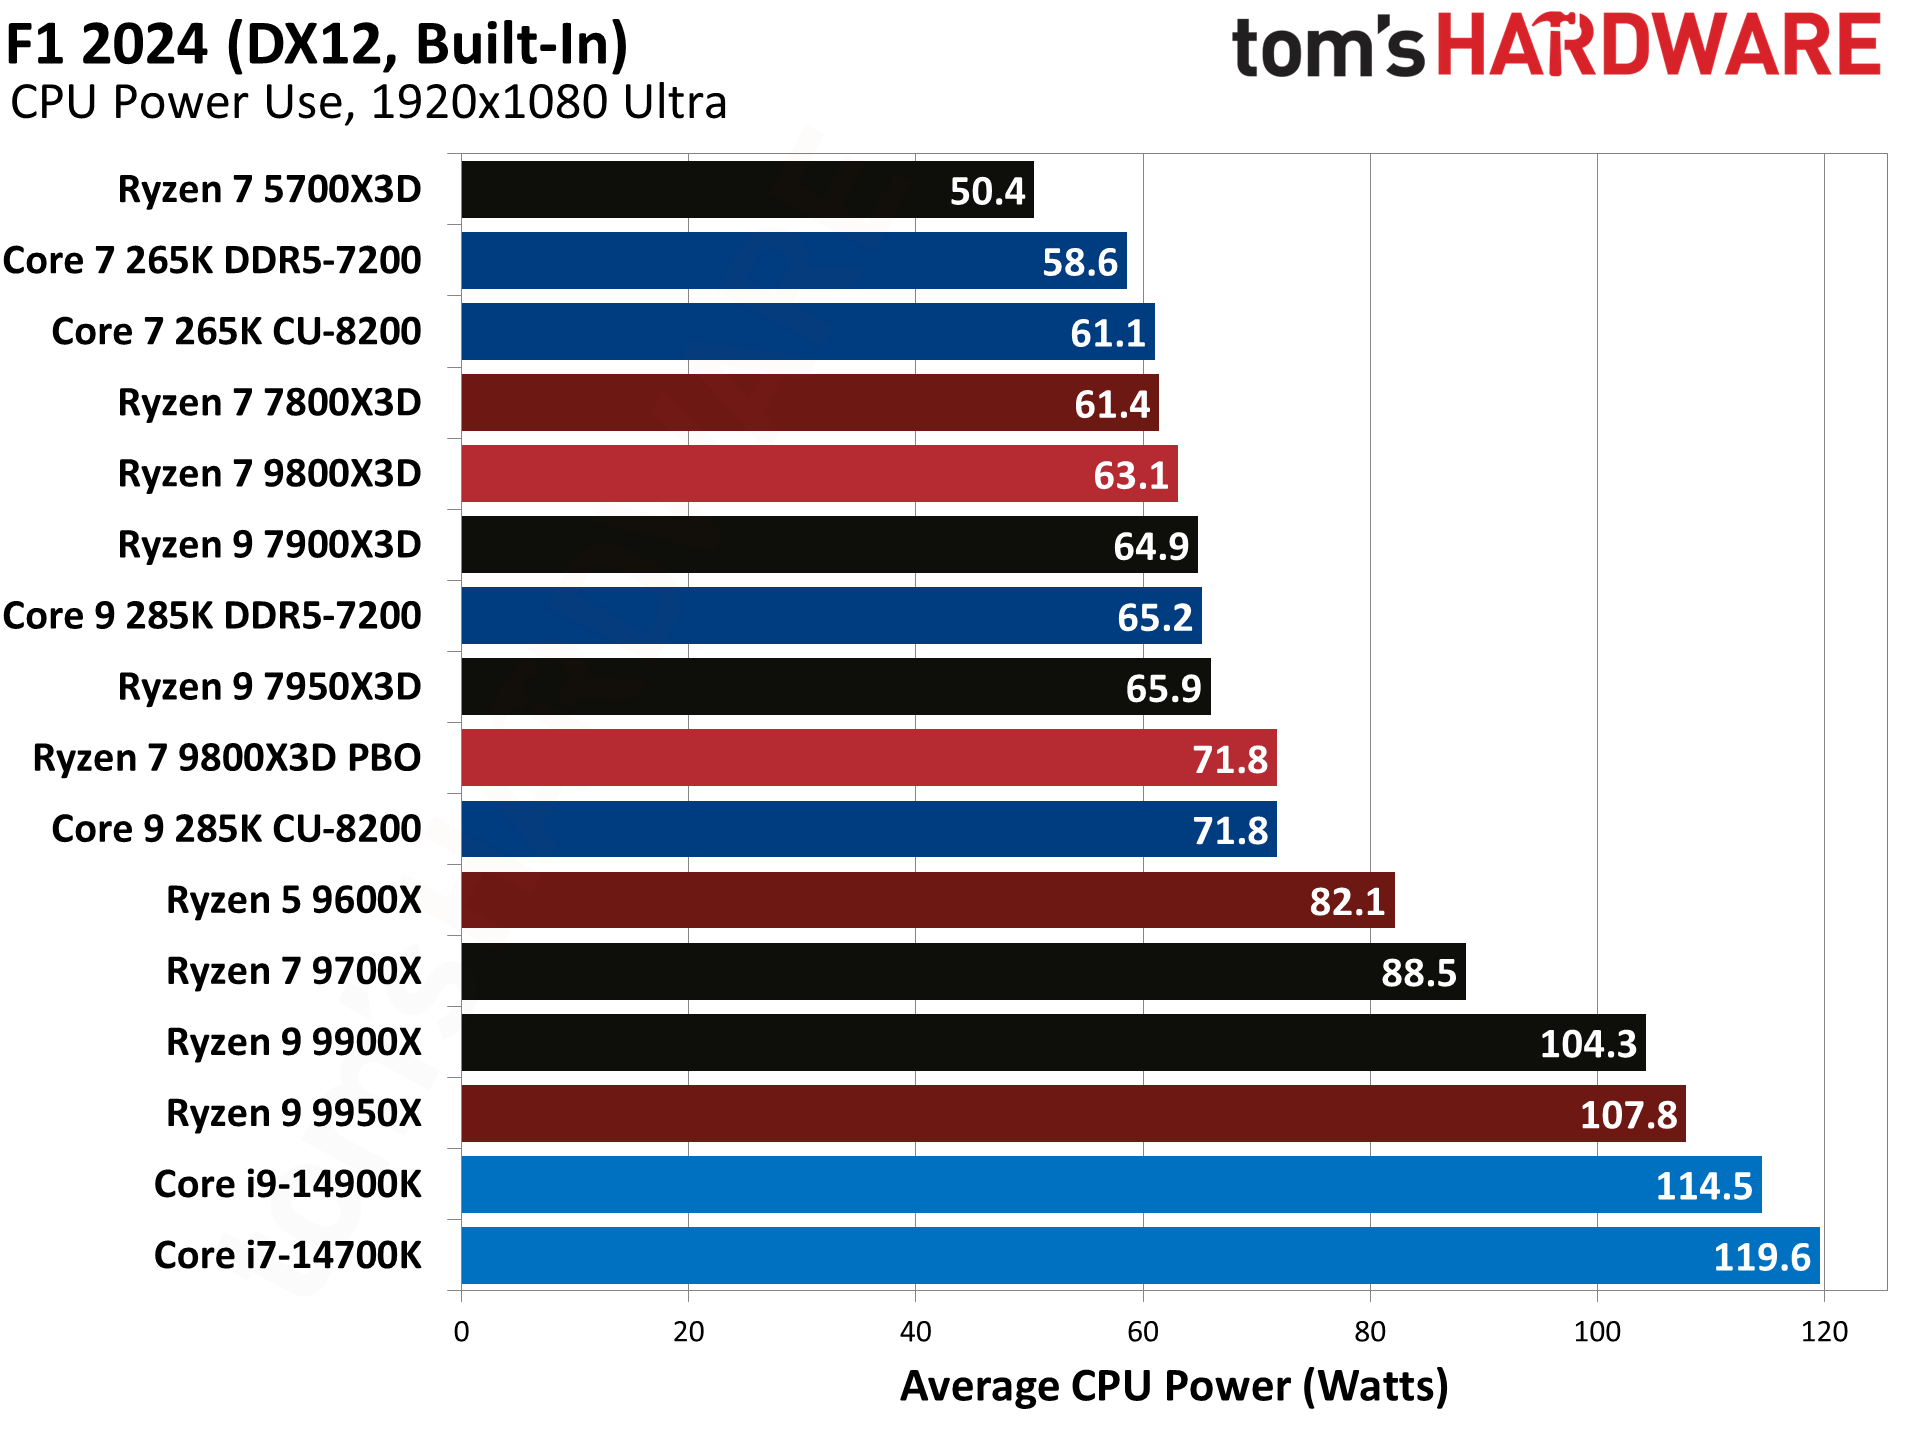
We test F1 24 with the ultra preset, which does enable some RT effects. They're relatively lightweight compared to other games, and of course we're still hitting 200+ FPS on most of the CPUs. Here the 9800X3D leads the 7800X3D by just 2%, it's a virtual tie with the 14900K (1% lead to AMD), and 'only' 13% faster than the 285K. This is the closest result we have from our gaming suite, no doubt due to F1 24's default enablement of RT at the ultra preset.
Get Tom's Hardware's best news and in-depth reviews, straight to your inbox.
Far Cry 6 Benchmarks — AMD Ryzen 7 9800X3D
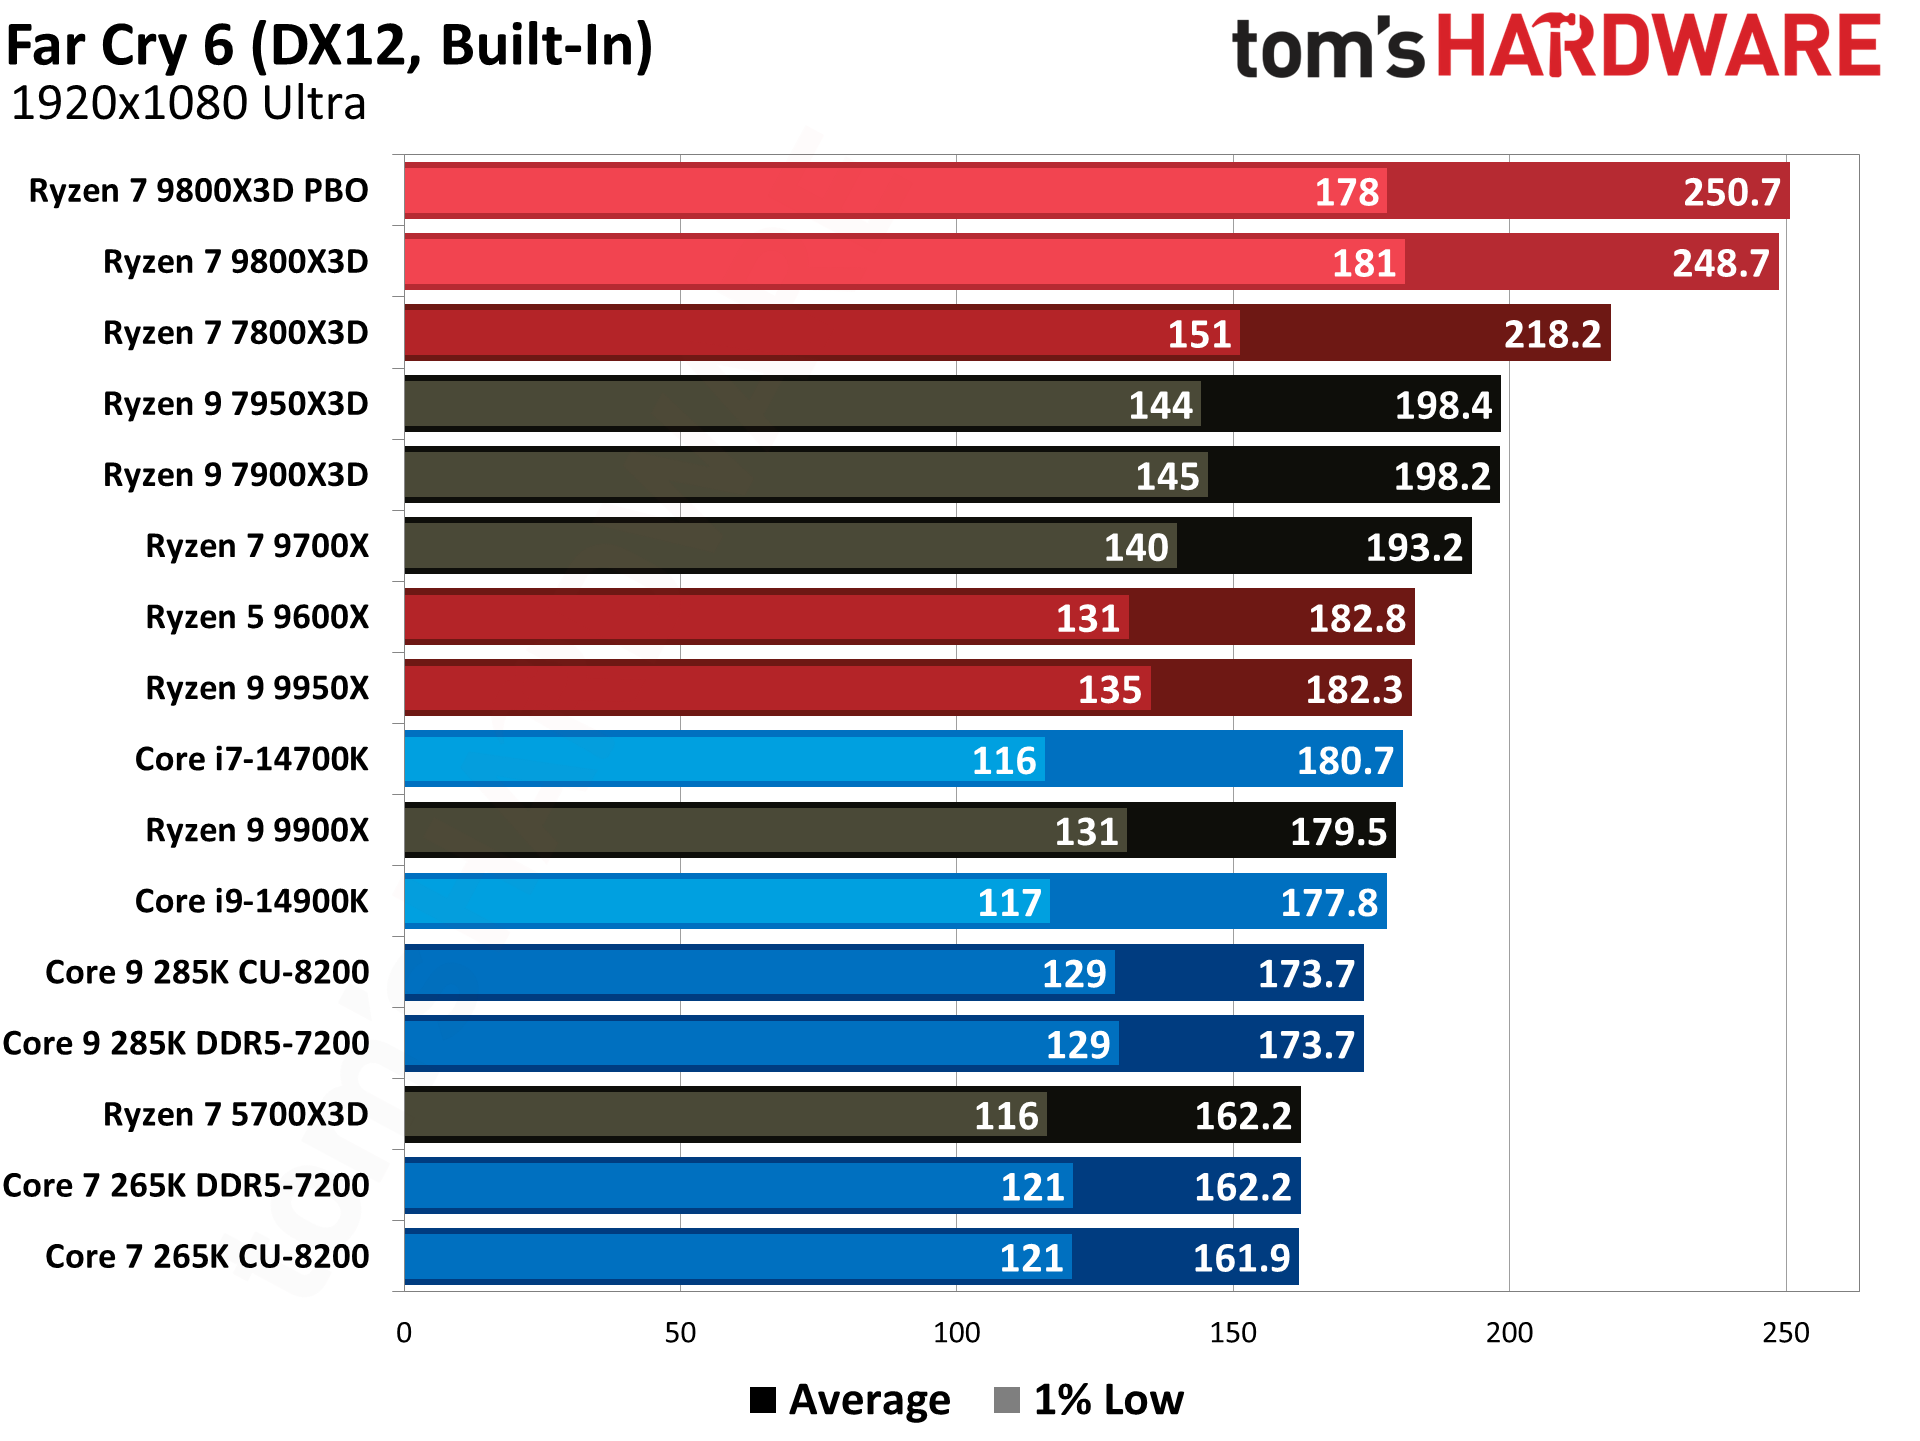
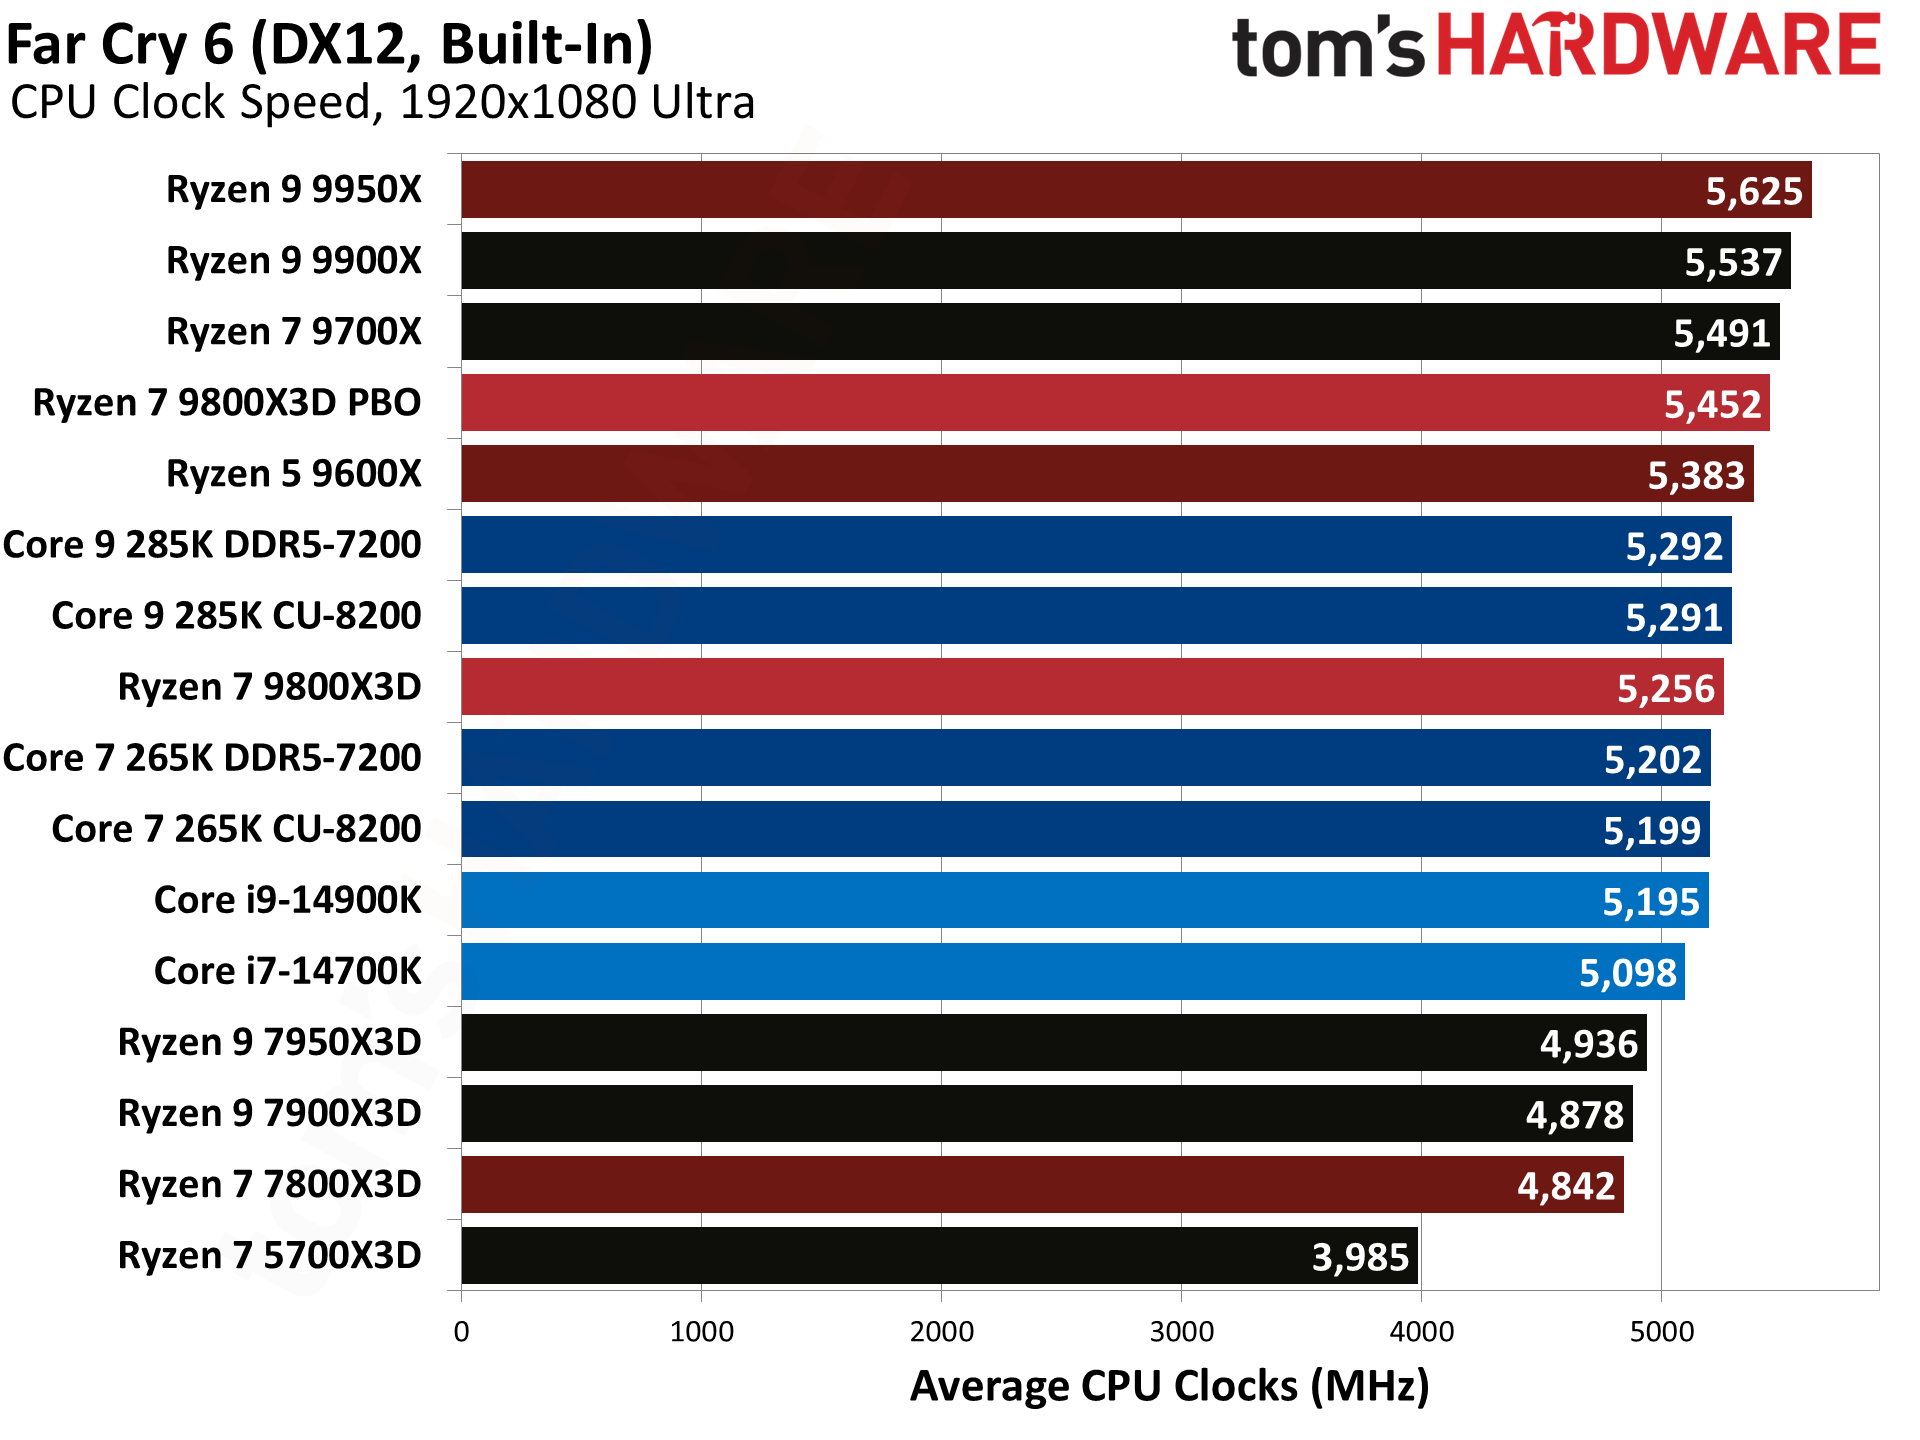
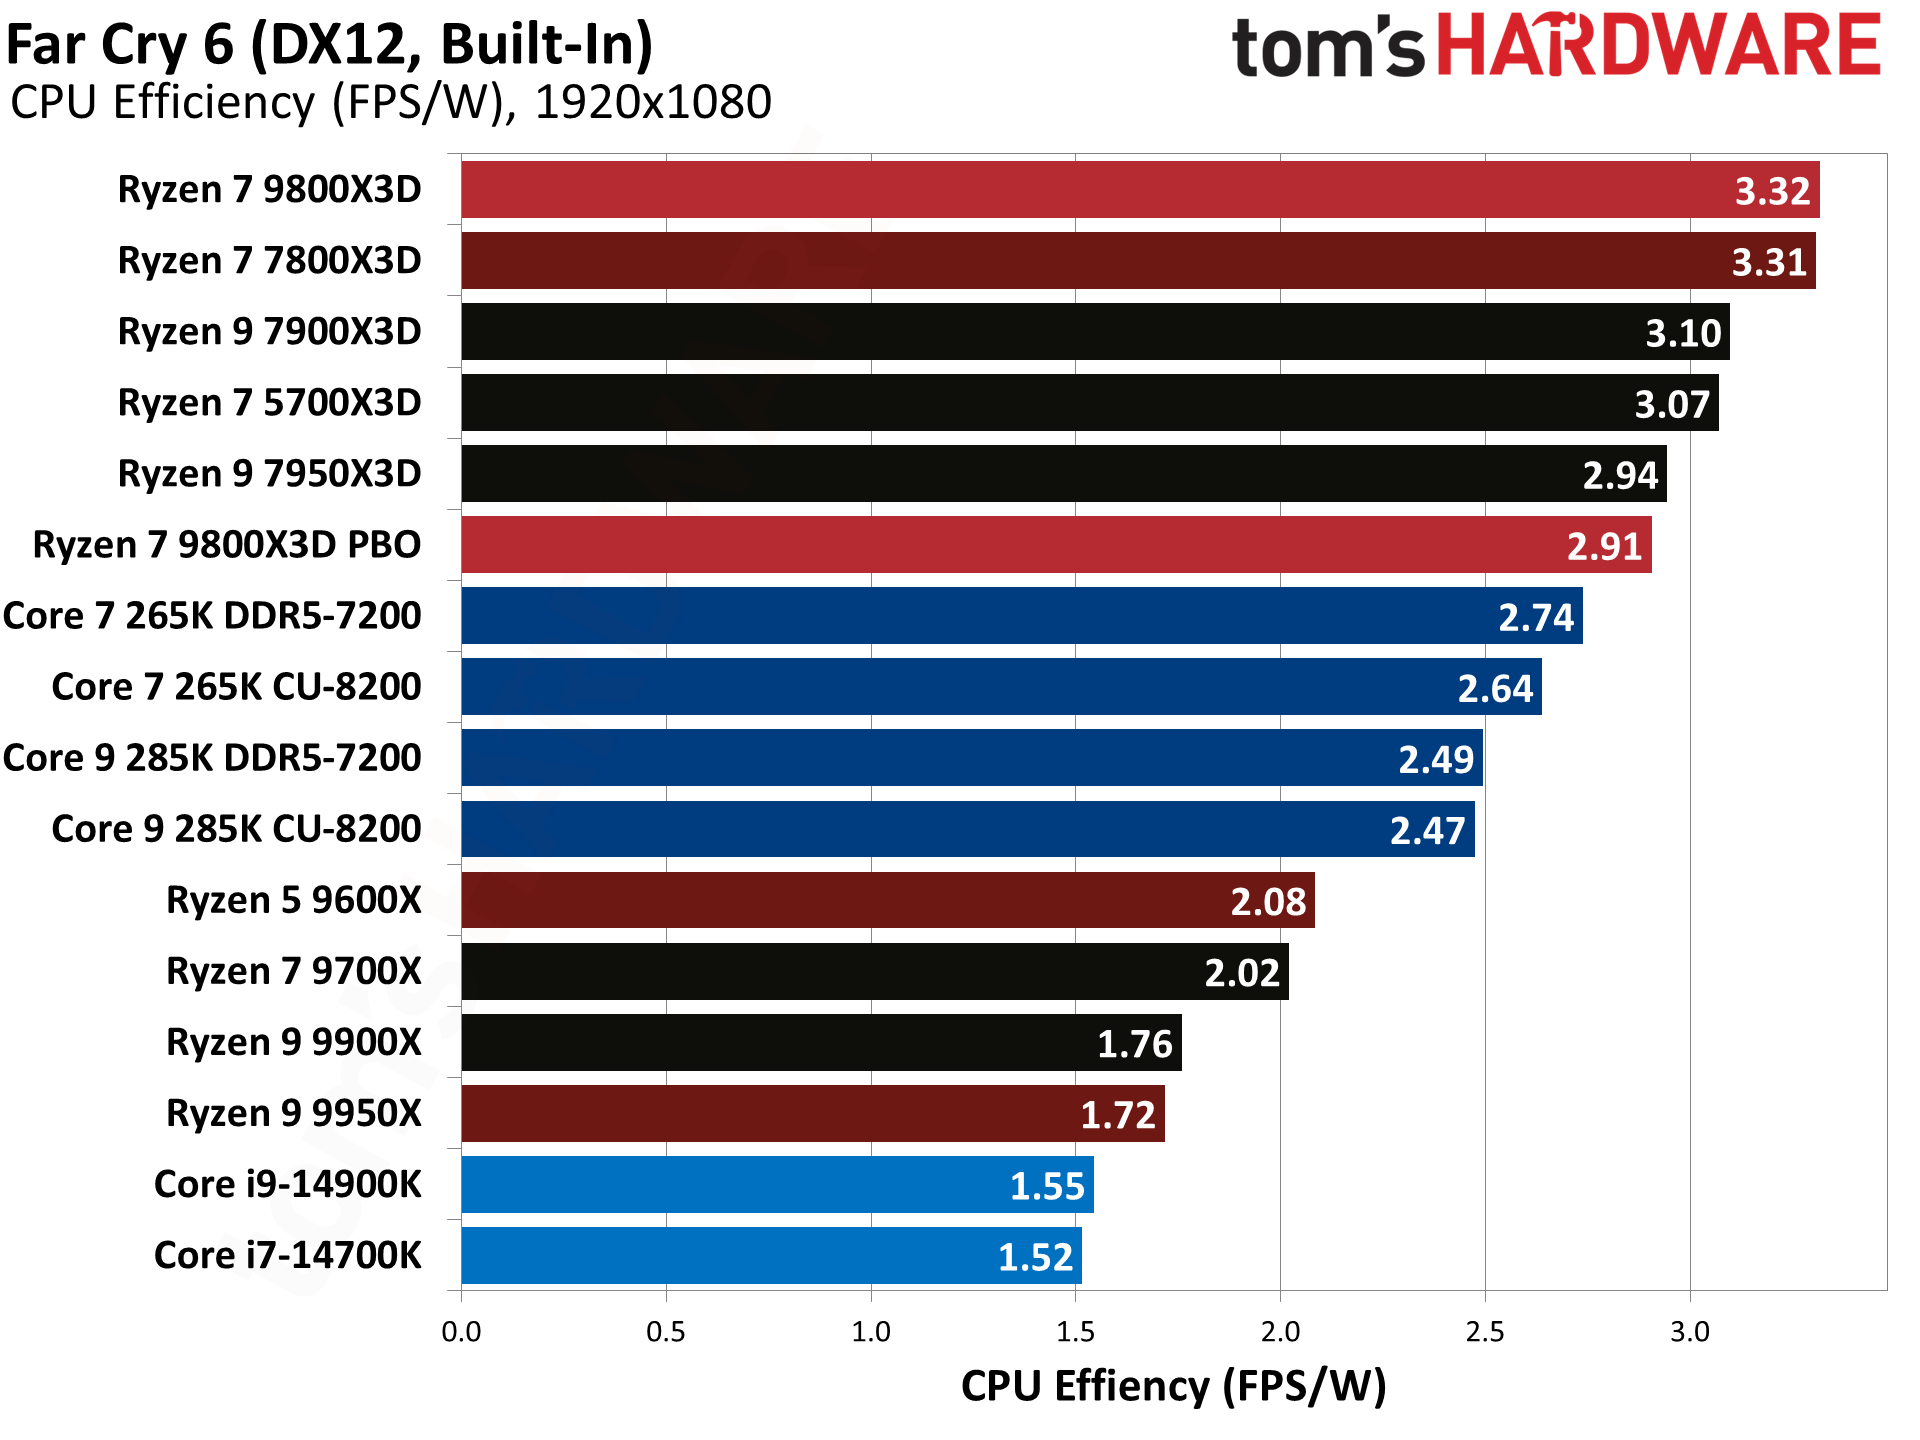
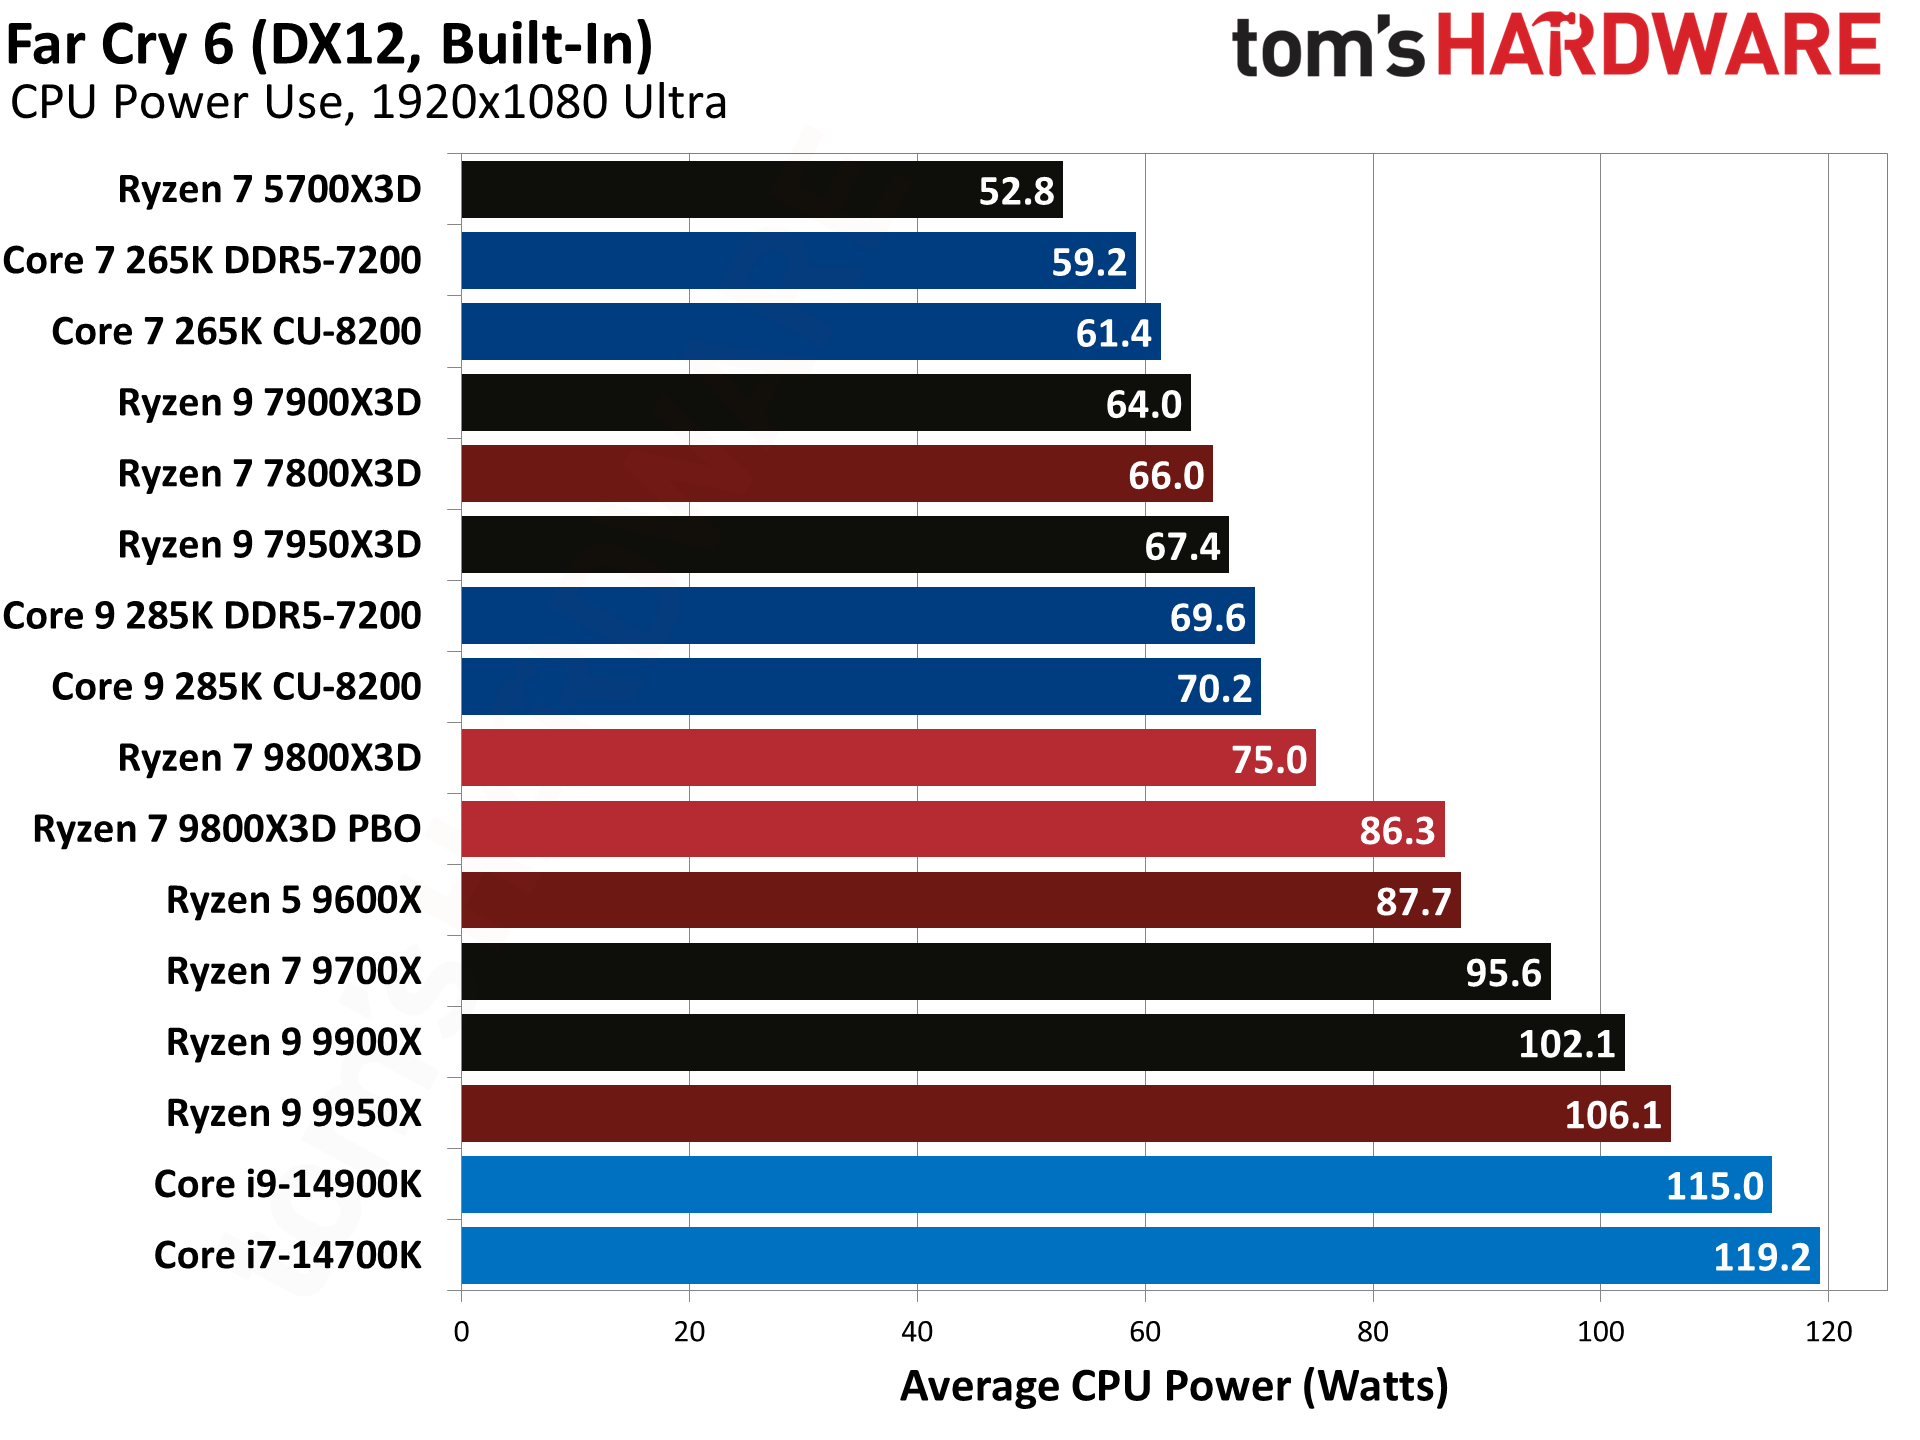
Far Cry 6 is another AMD-promoted game, which may impact the standing, though it's by no means one of the biggest outliers for our suite. The 9800X3D beats the incumbent 7800X3D by 14%, right about on par with our average result. But Intel CPUs fall well behind, with a 40% lead over the 14900K and a 43% lead over the 285K. So again, this is a game where Arrow Lake at least wasn't too far behind Raptor Lake.
Final Fantasy XIV Benchmarks — AMD Ryzen 7 9800X3D
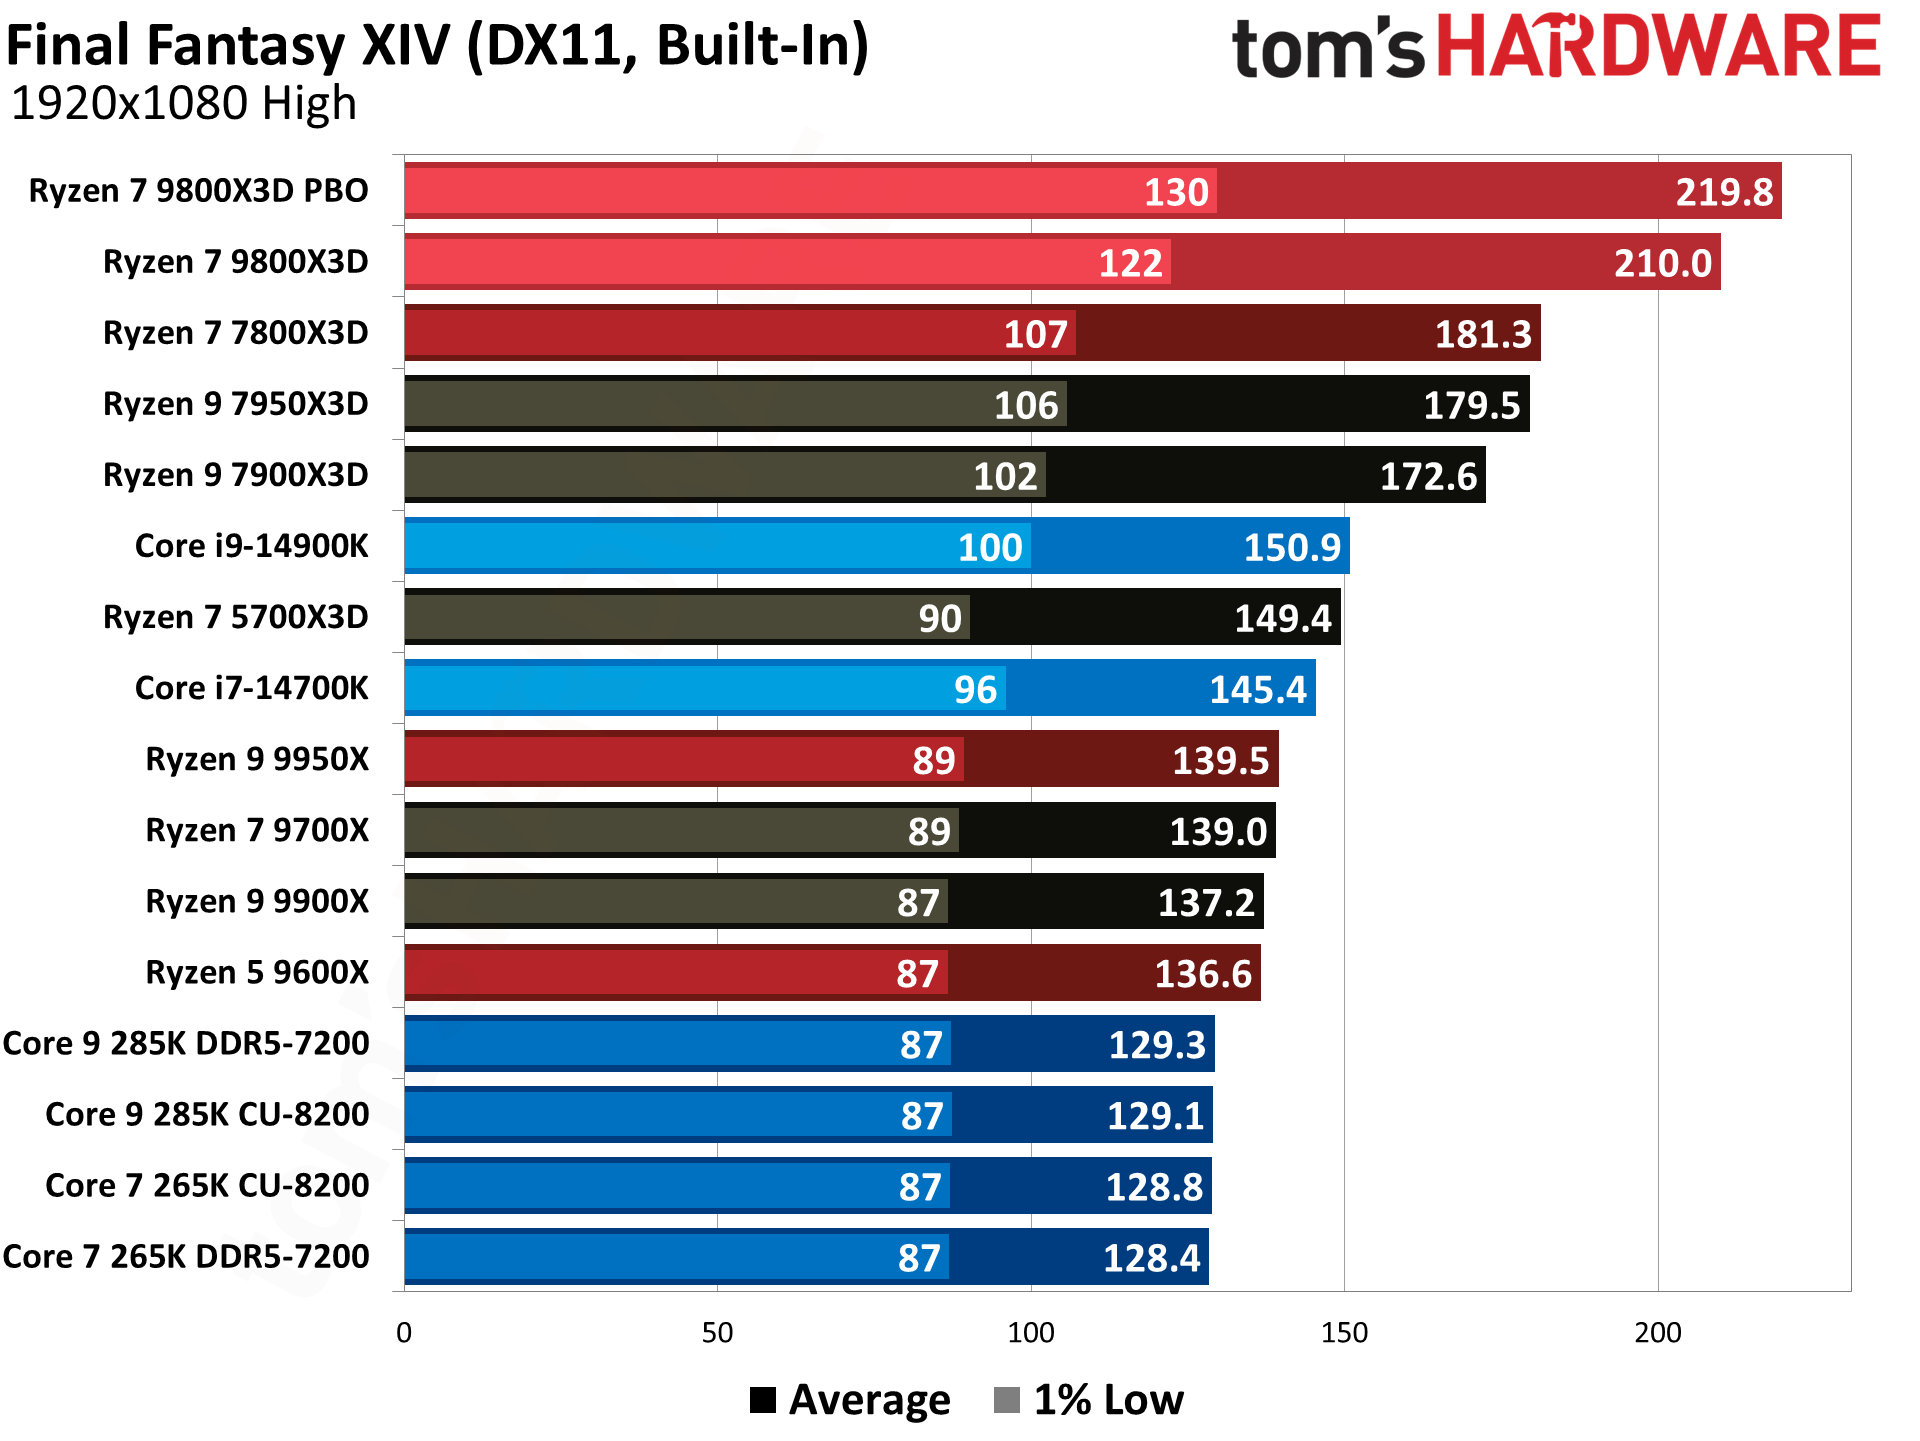
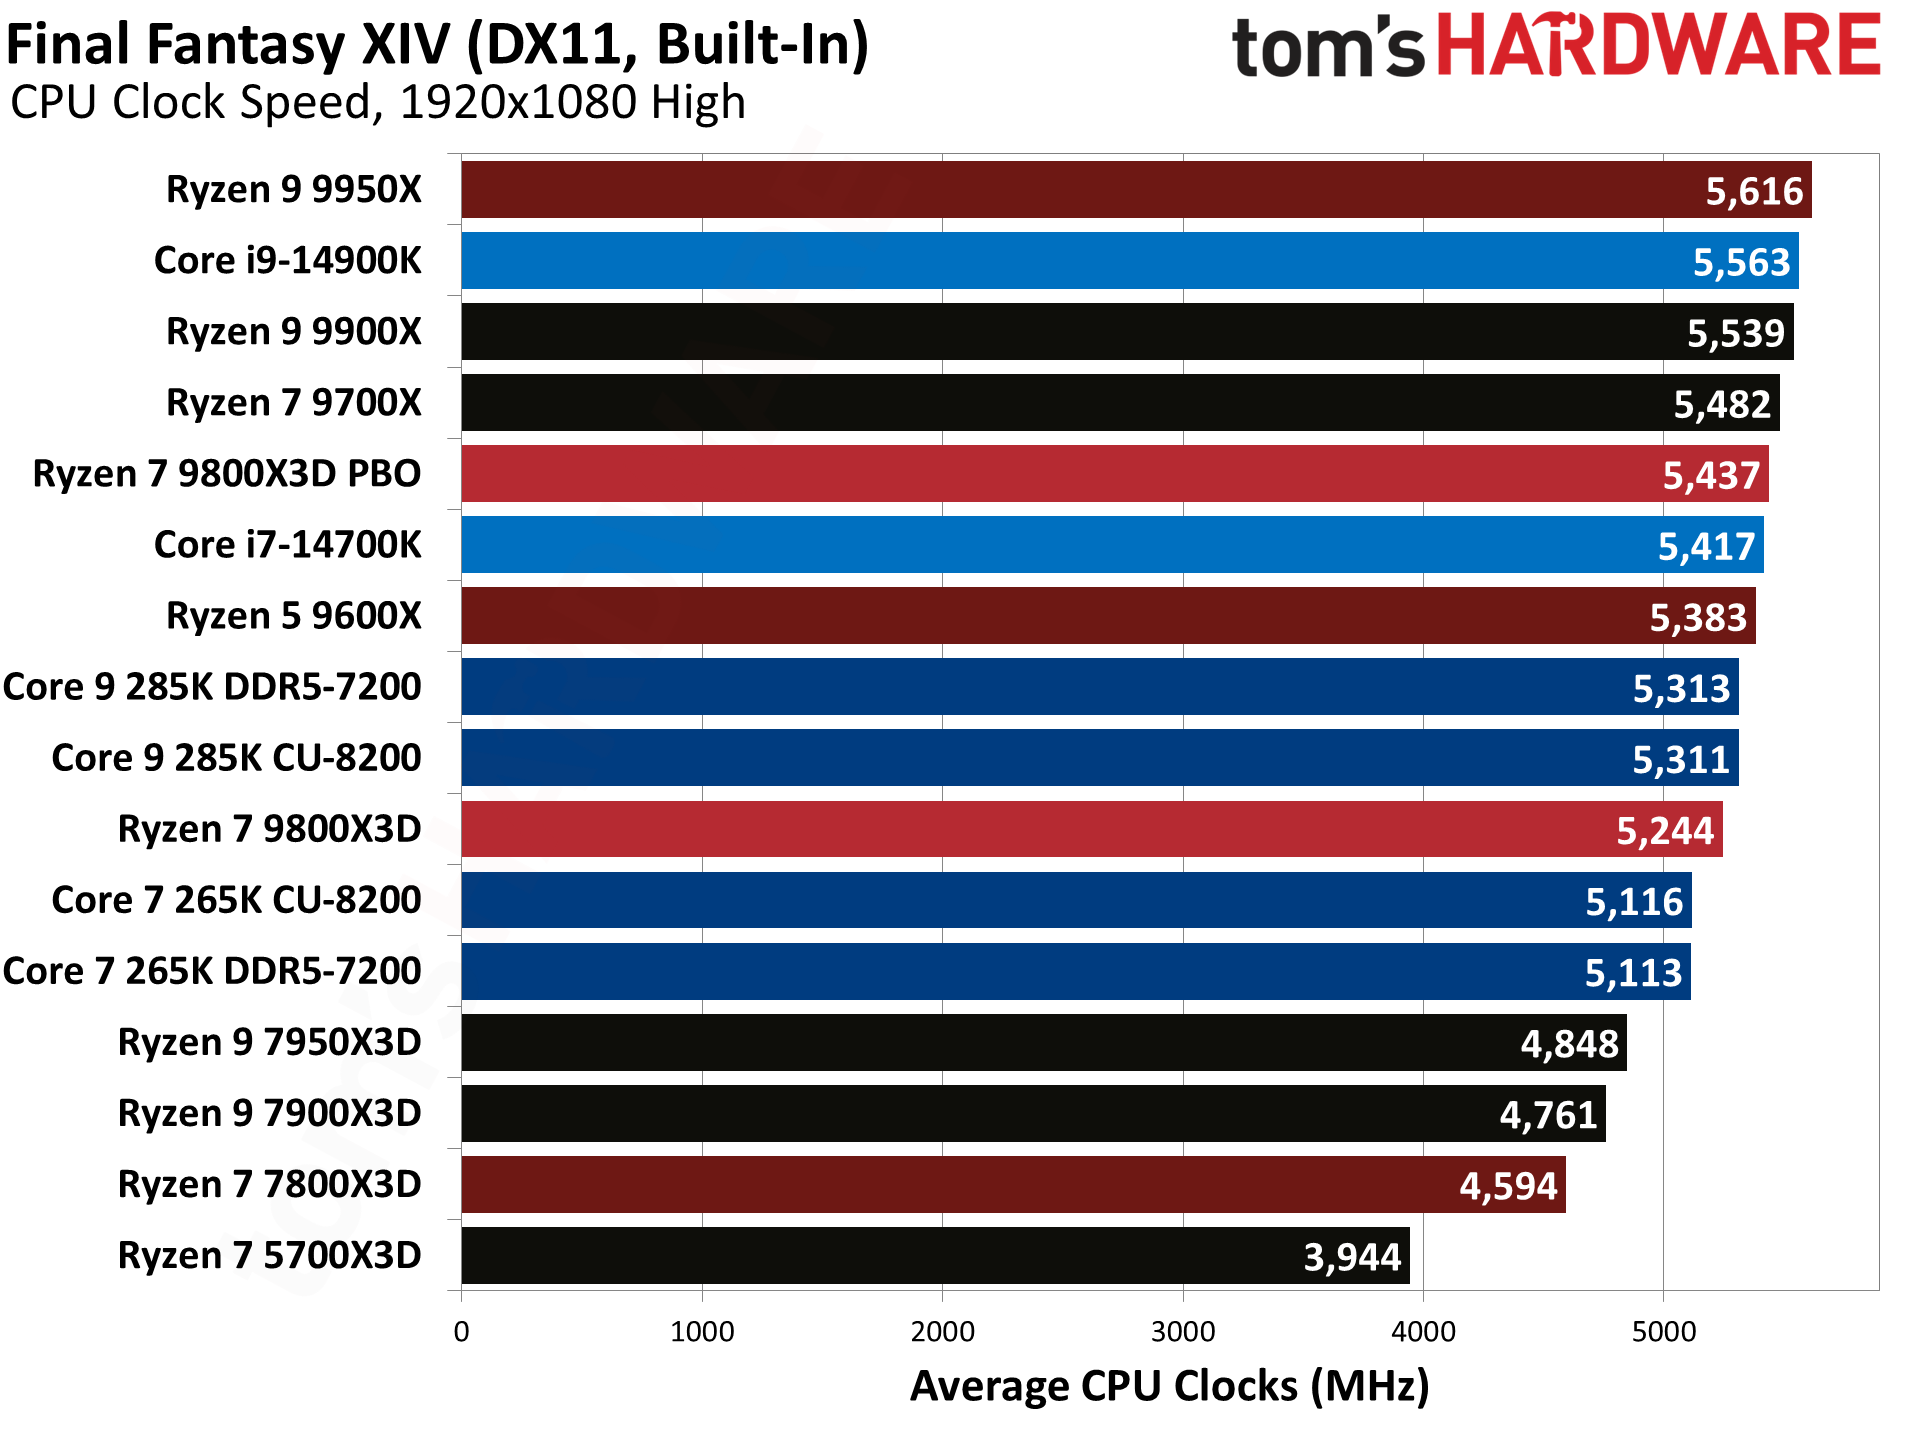
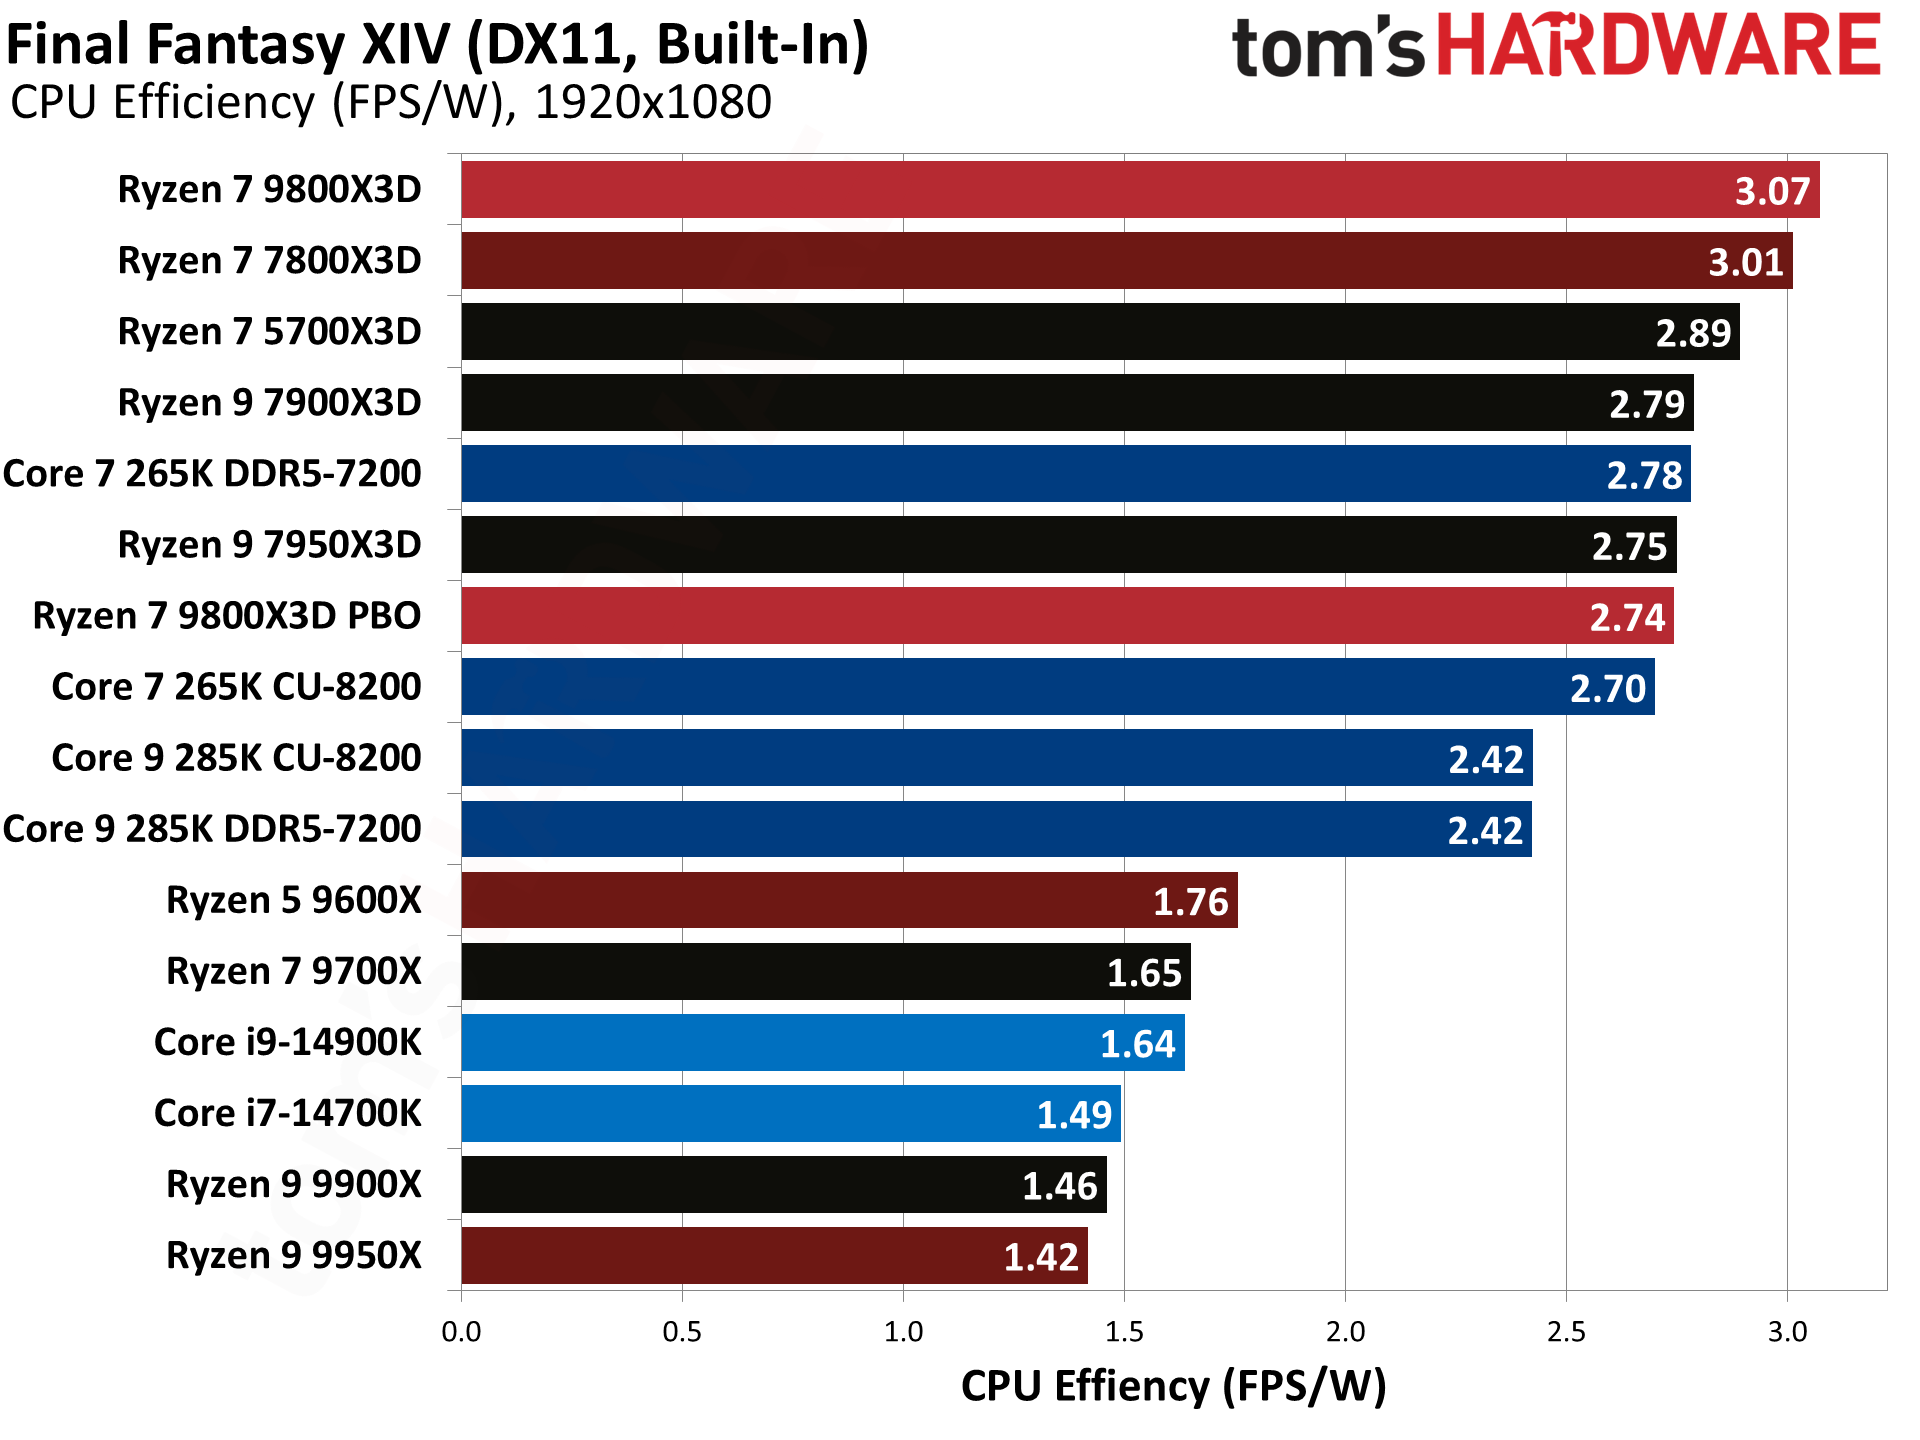
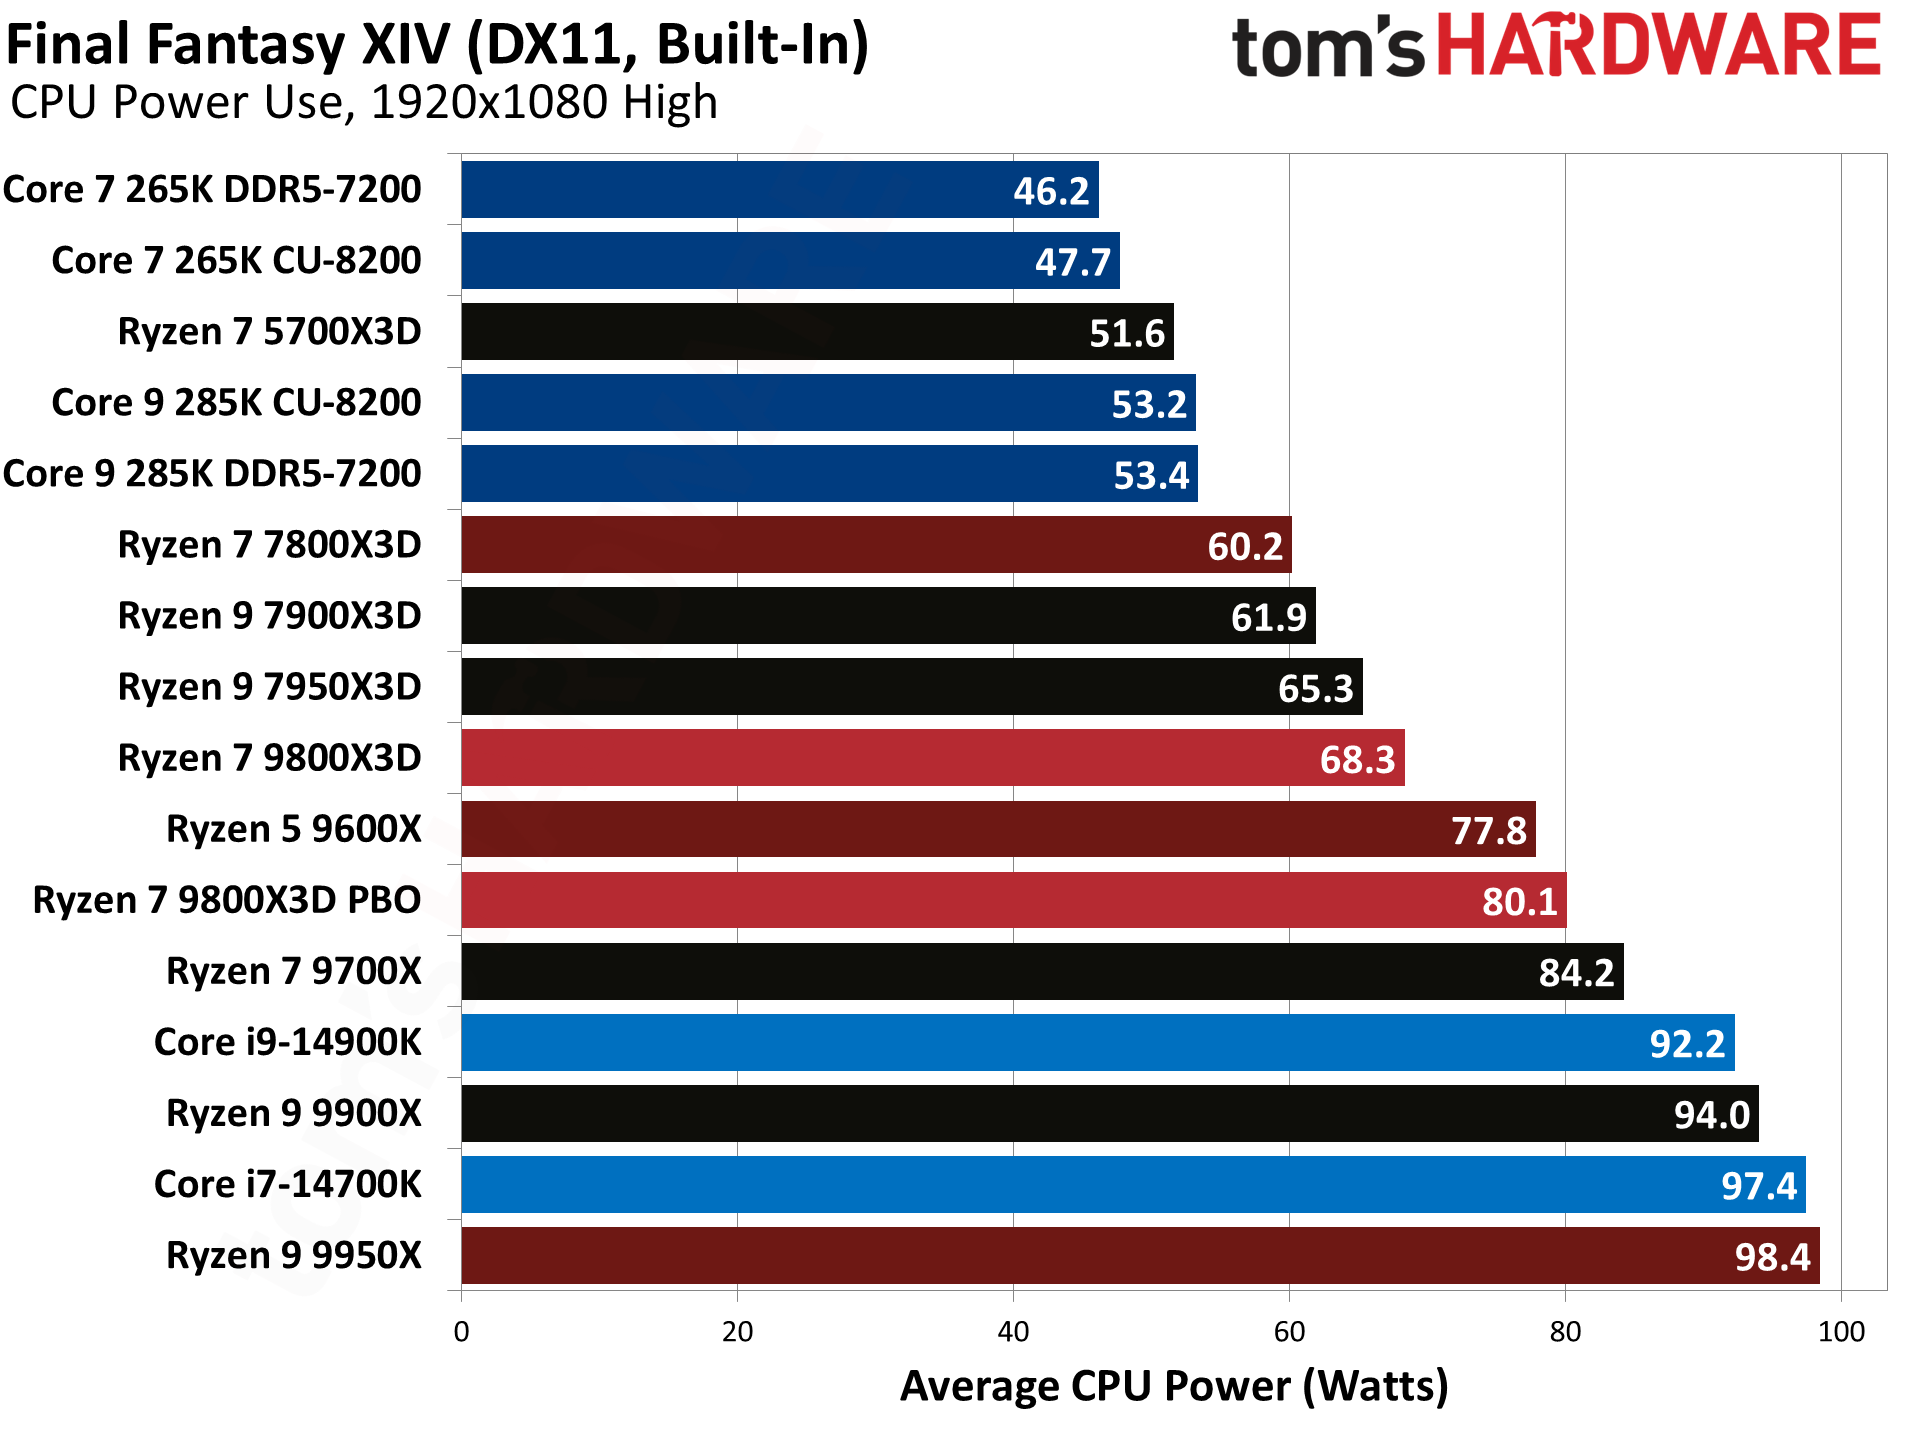
Final Fantasy XIV — not the newer Final Fantasy XVI — gives the 9800X3D yet another 16% win over its predecessor. Intel CPUs fail to impress once again, with the new Zen 5 X3D chip beating the 14900K by 39%, and the 285K by 63%. That's the biggest lead over Arrow Lake, if you're wondering.
Hitman 3 Benchmarks — AMD Ryzen 7 9800X3D
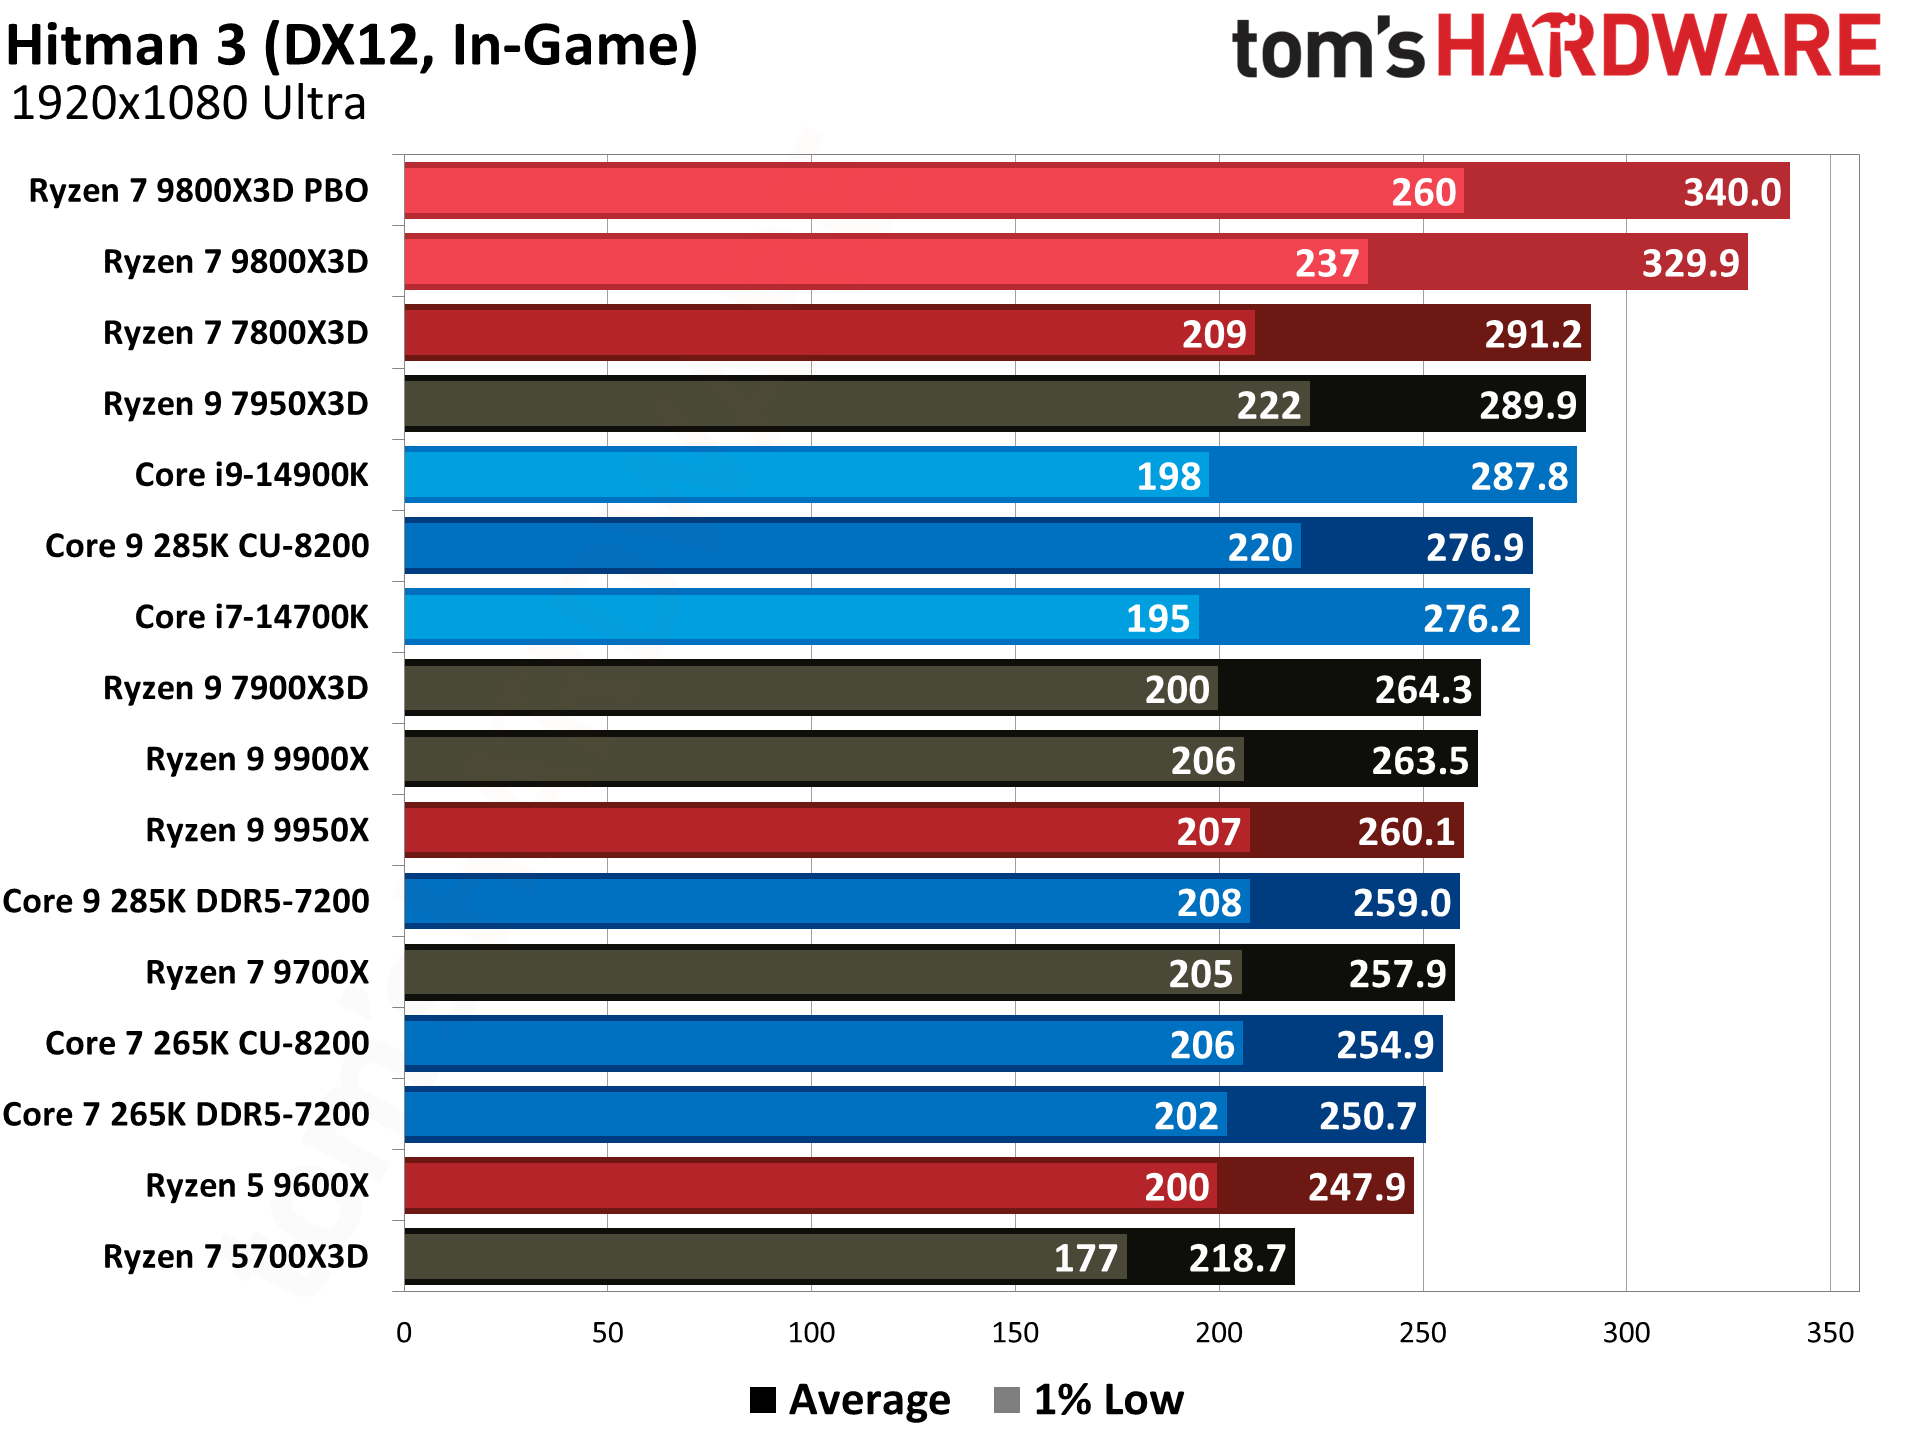
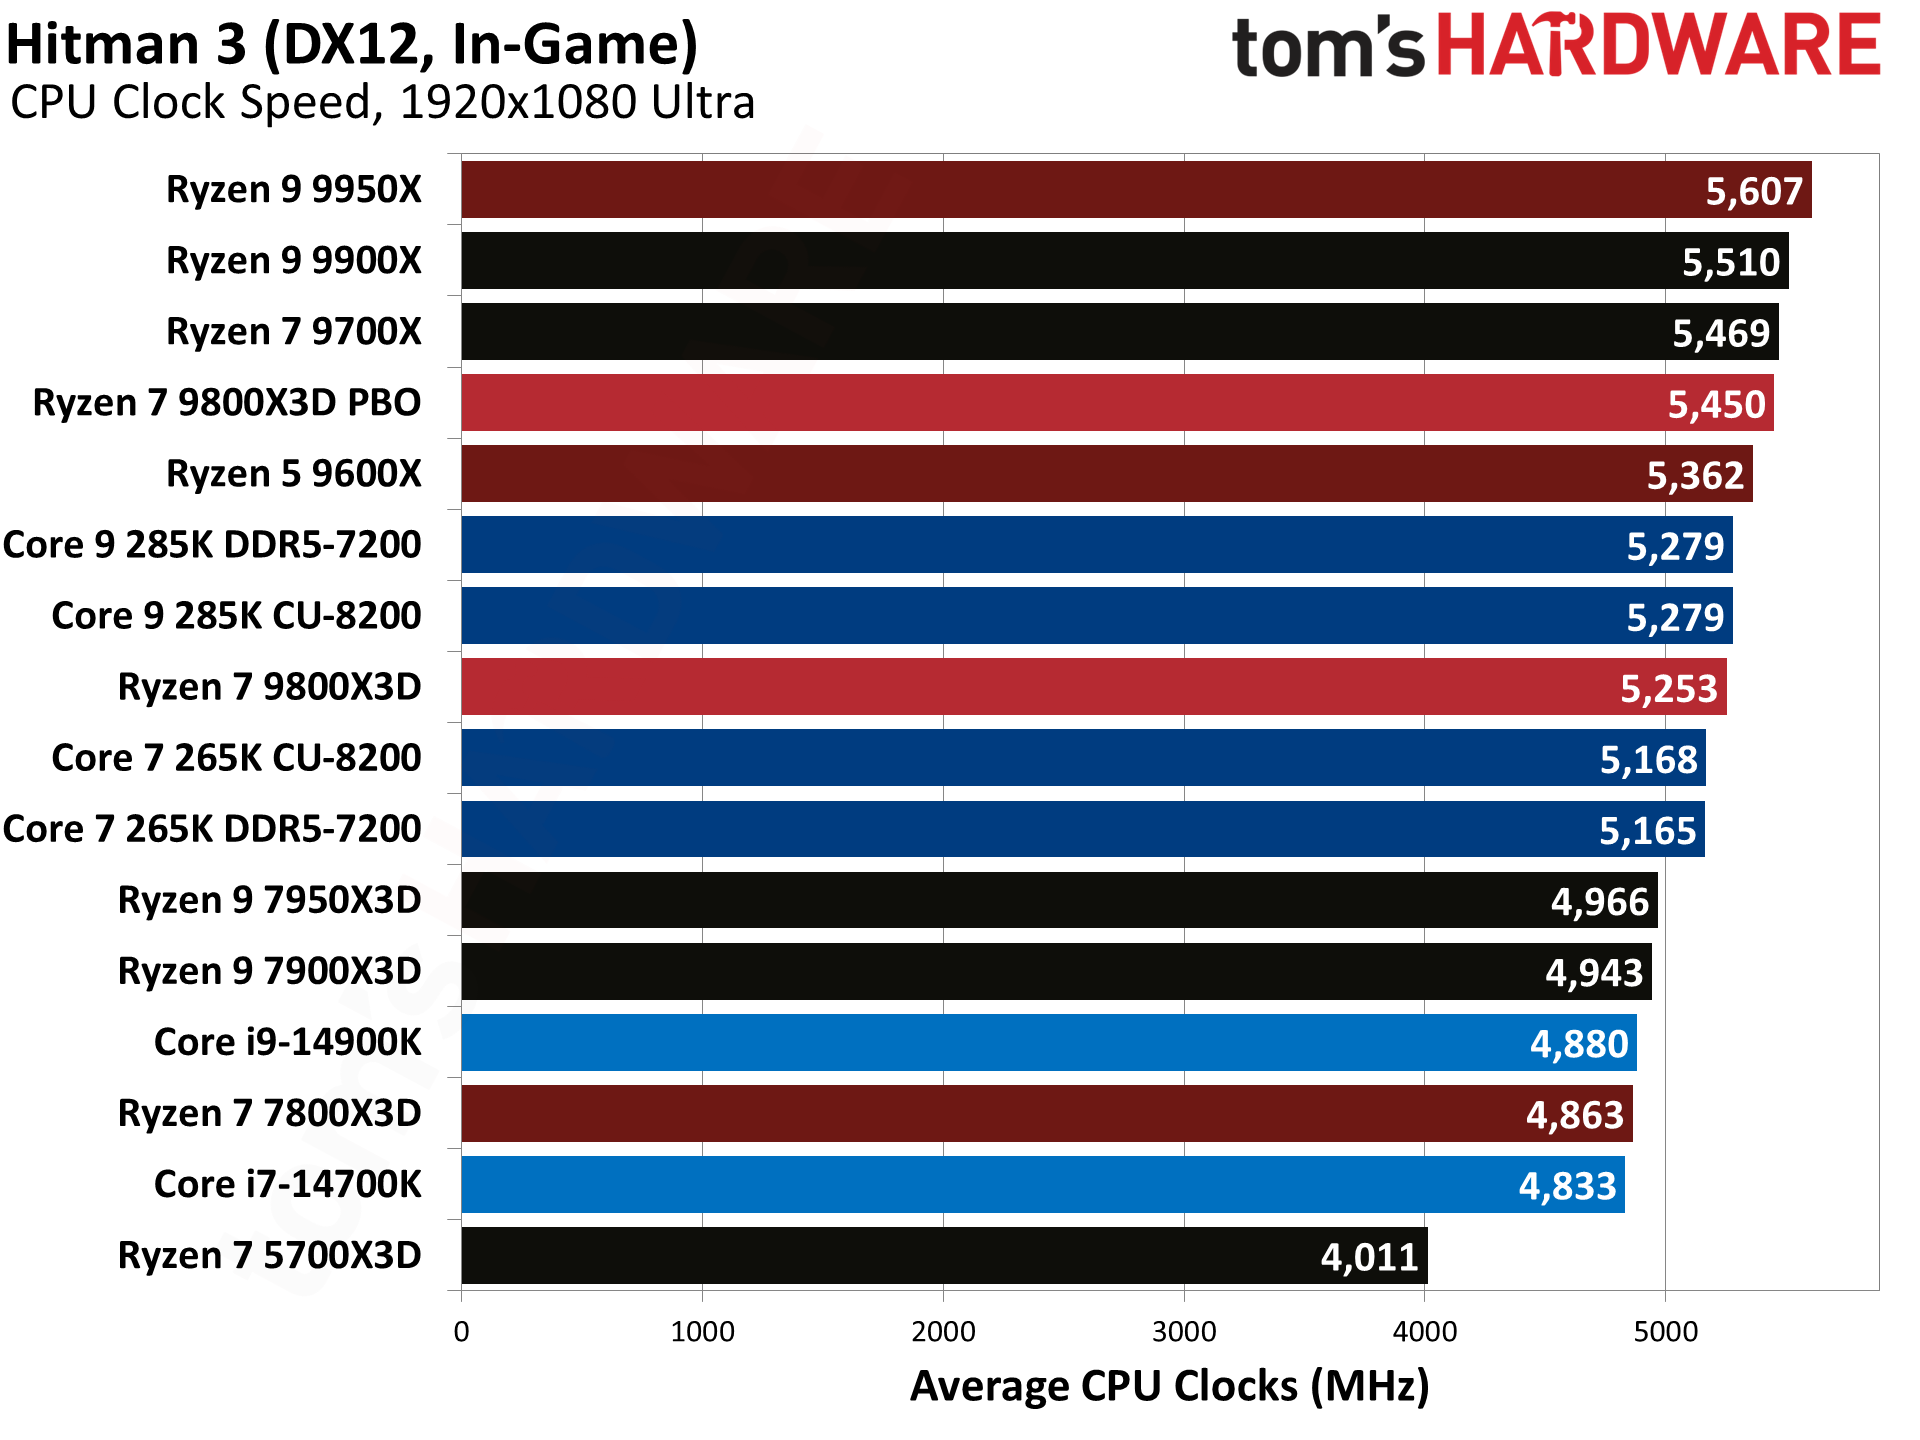
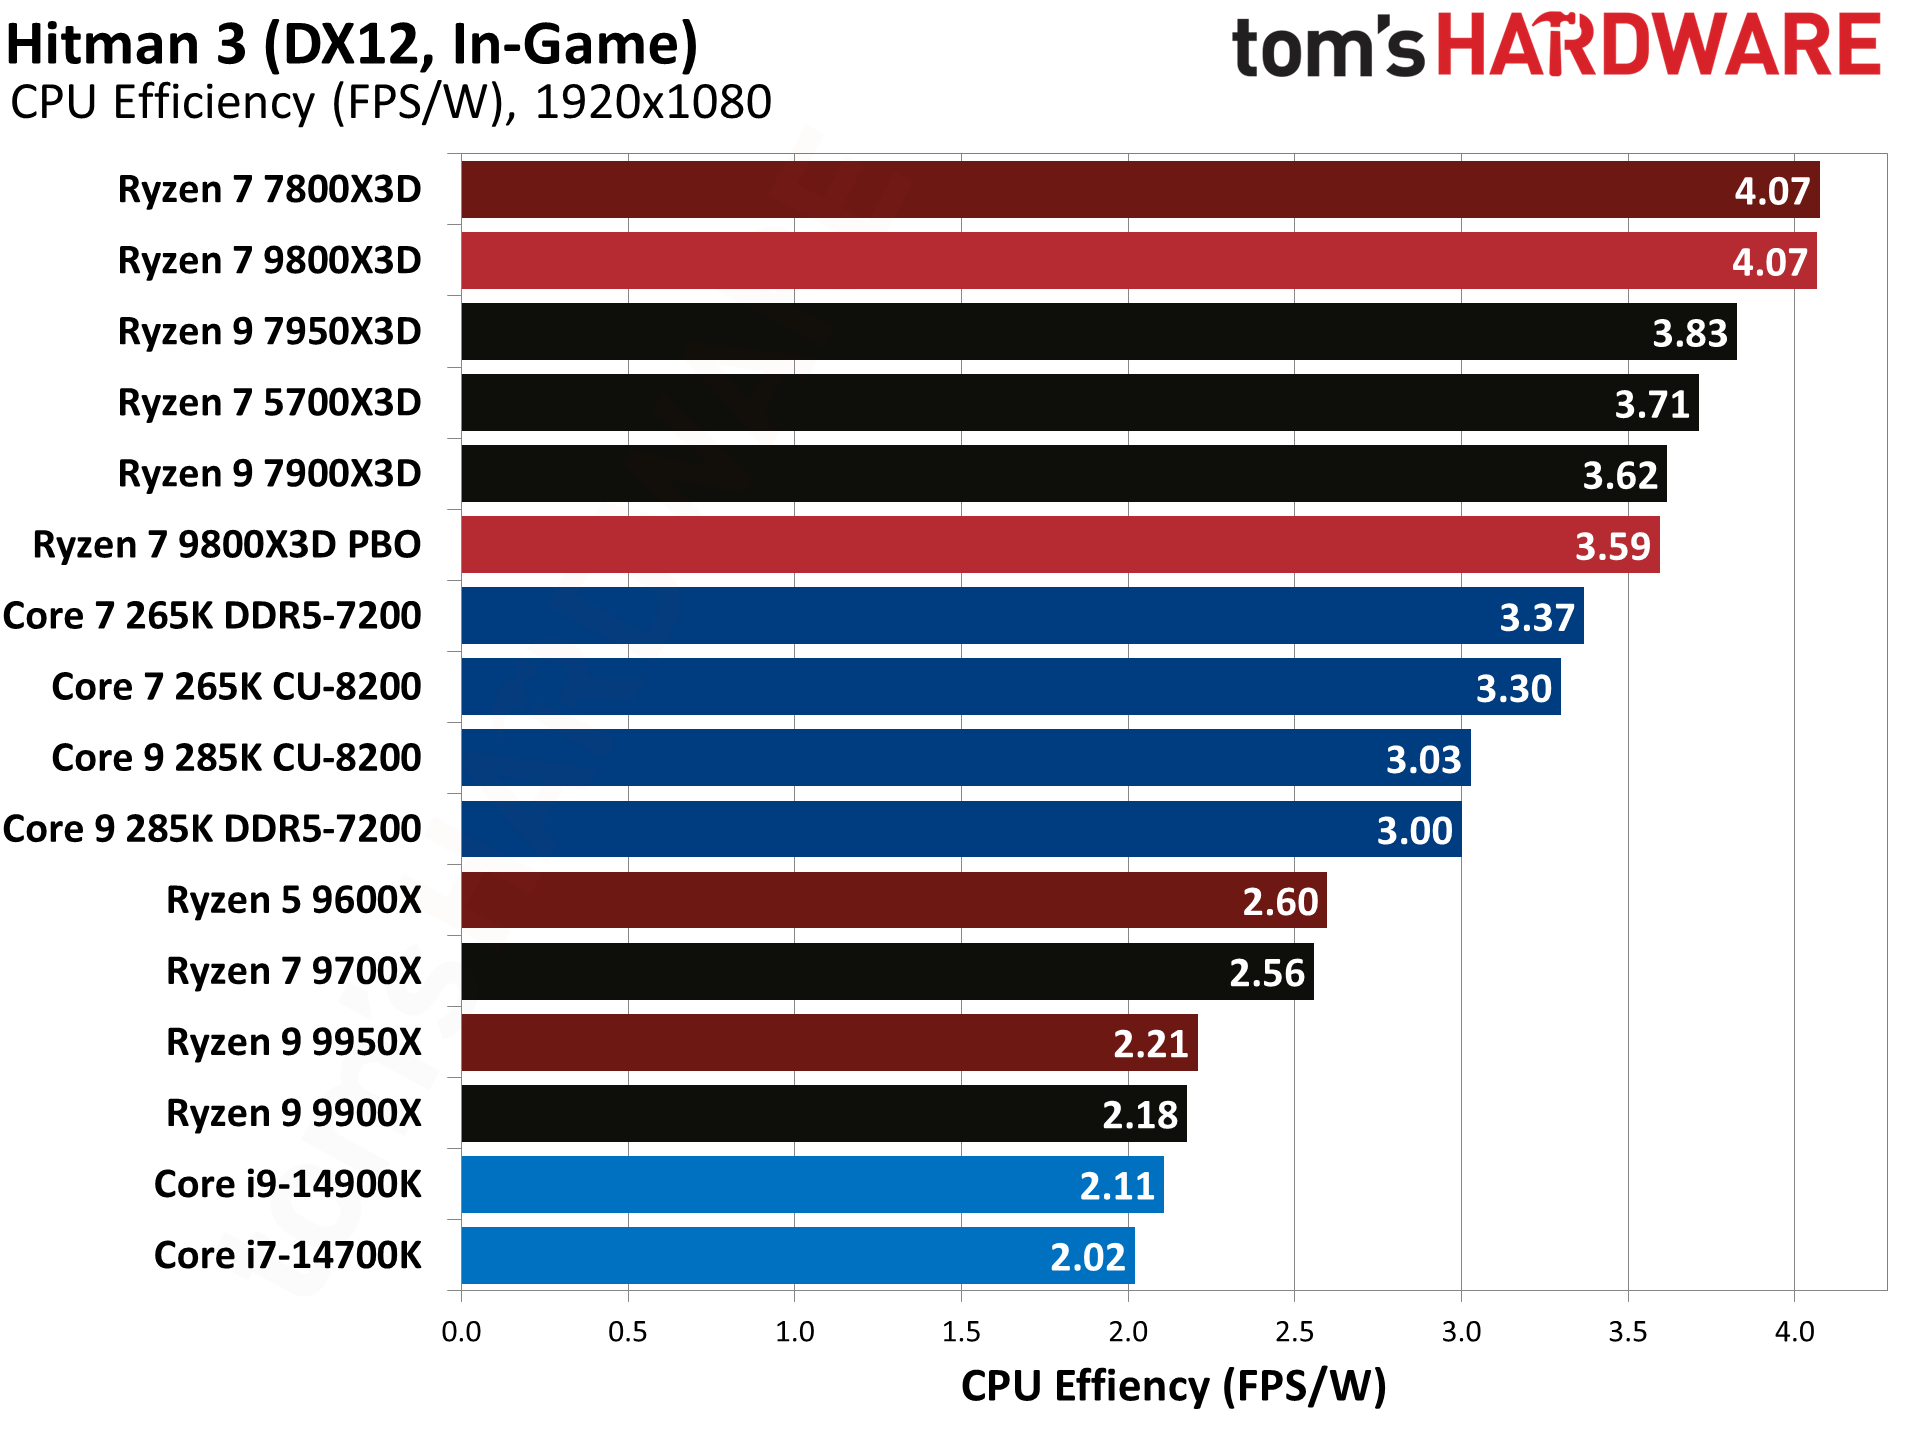
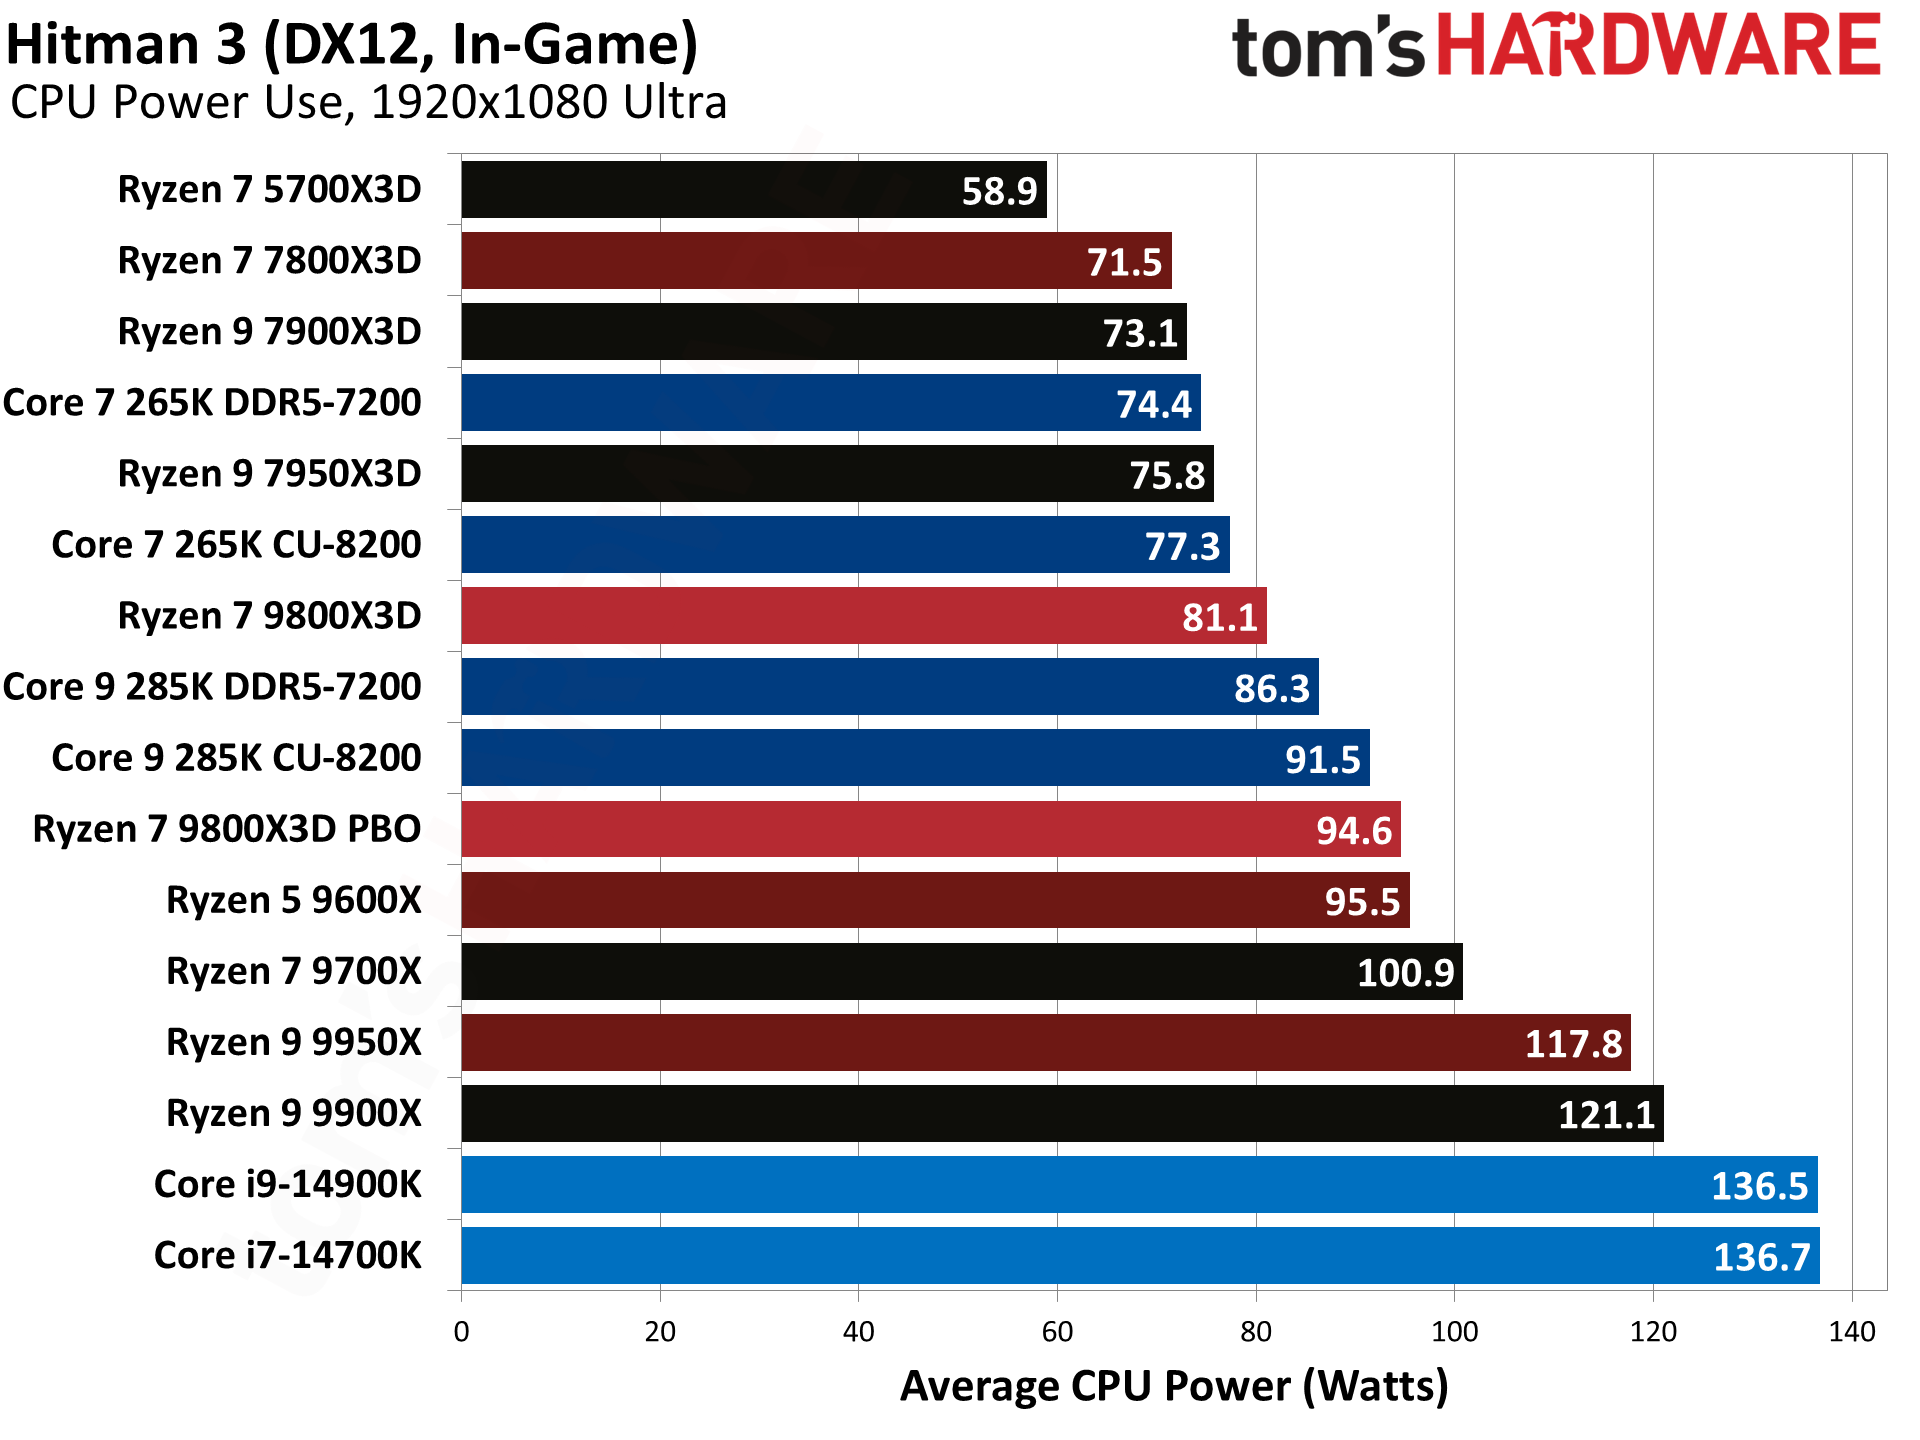
Hitman 3 leverages Intel's E-cores for certain game functions, but it also likes Ryzen X3D's voluminous L3 cache. The 9800X3D leads the 7800X3D by 13%, with a less dramatic 15% lead over the 14900K and 'only' a 19% lead over the 285K.
Hogwarts Legacy Benchmarks — AMD Ryzen 7 9800X3D
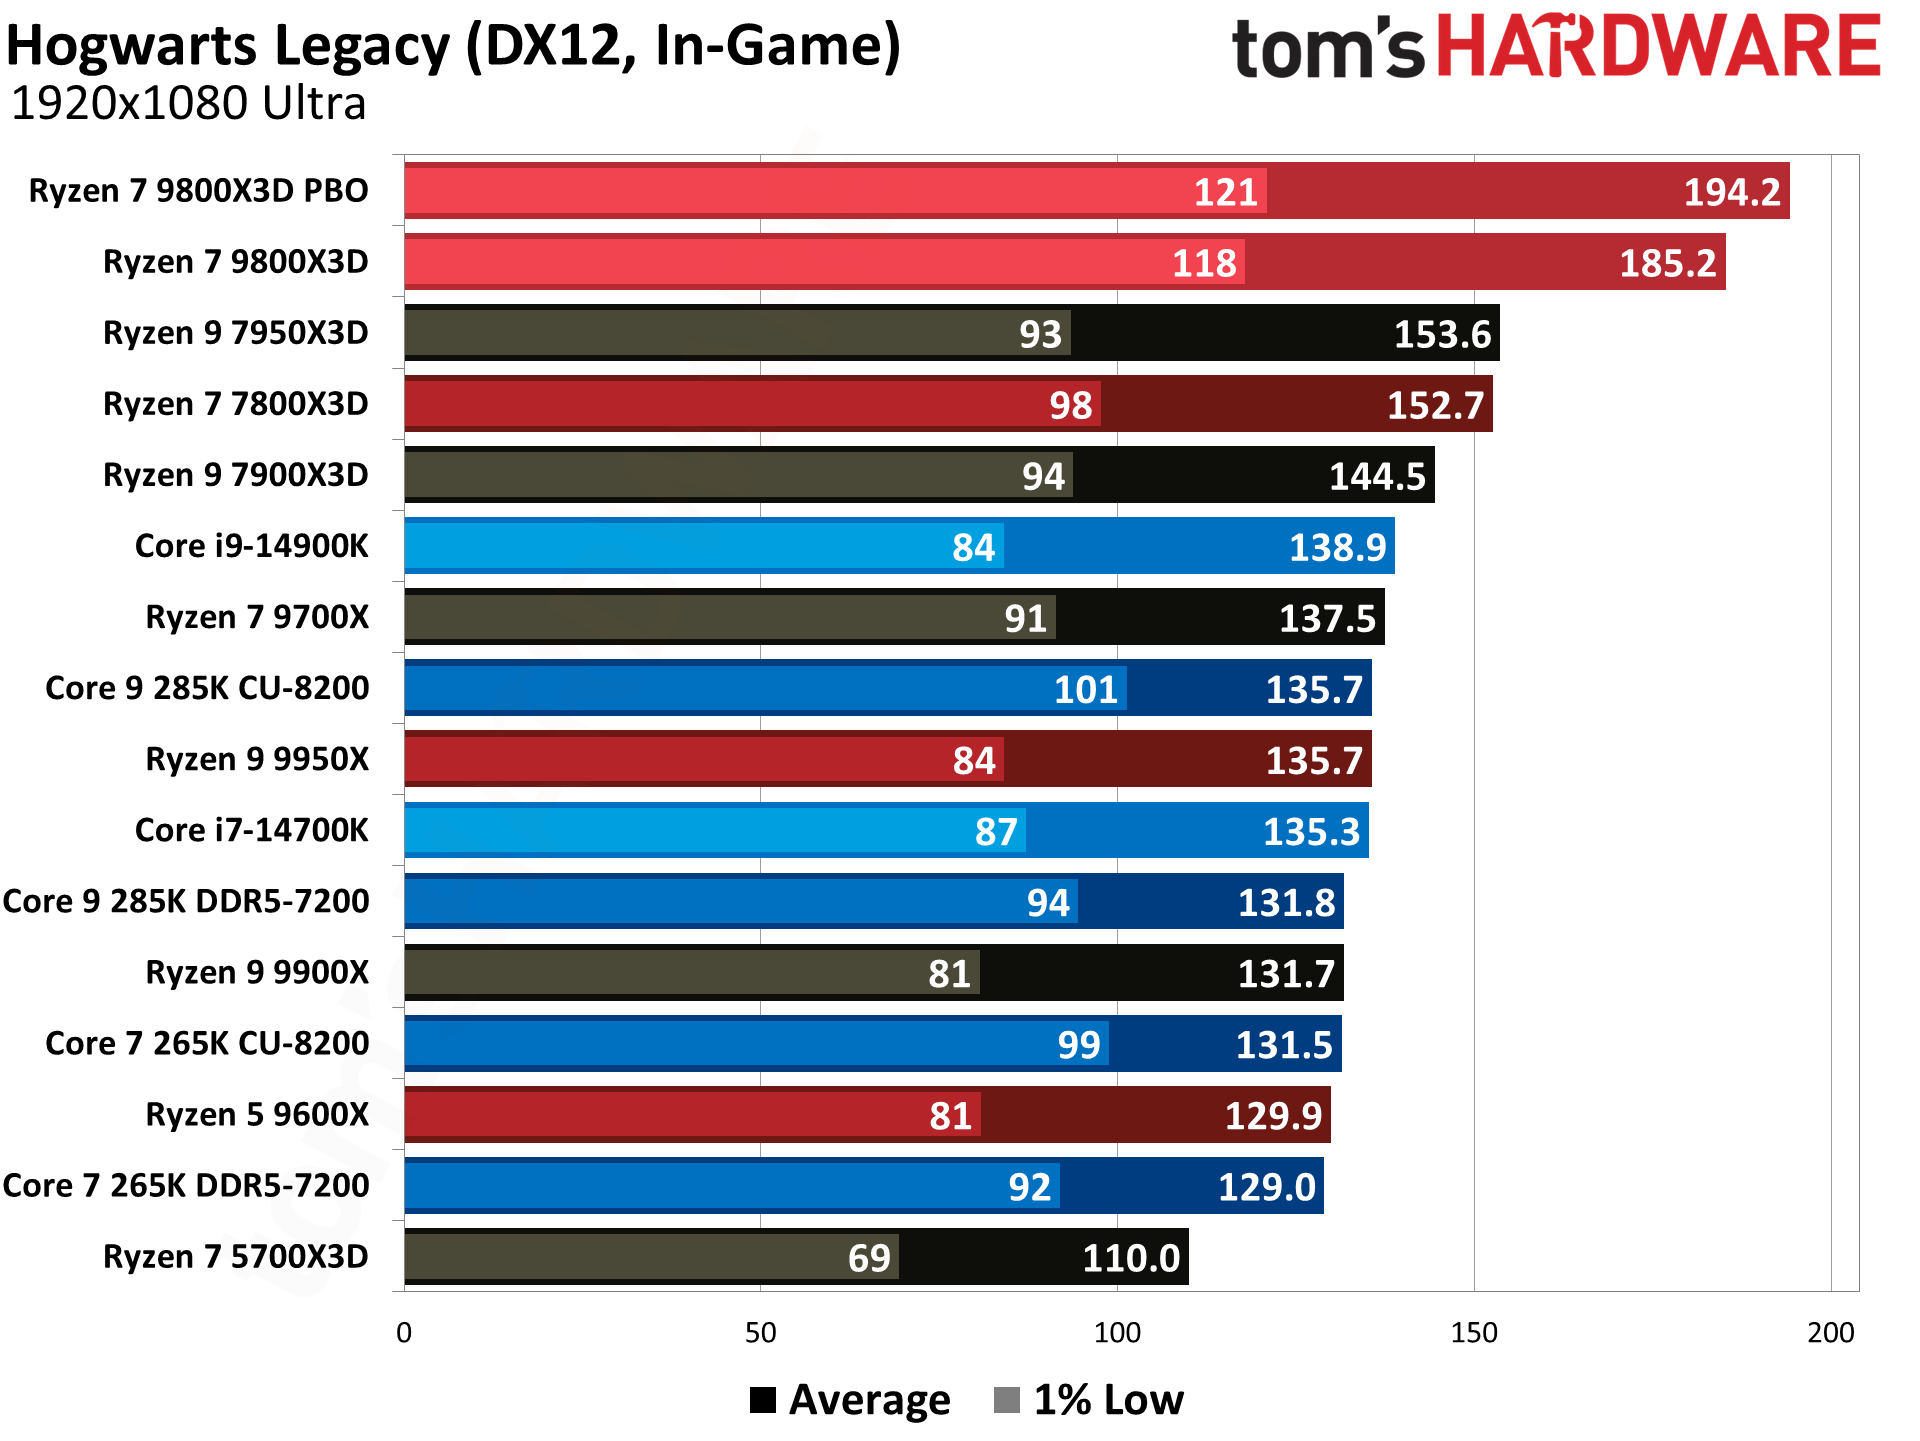
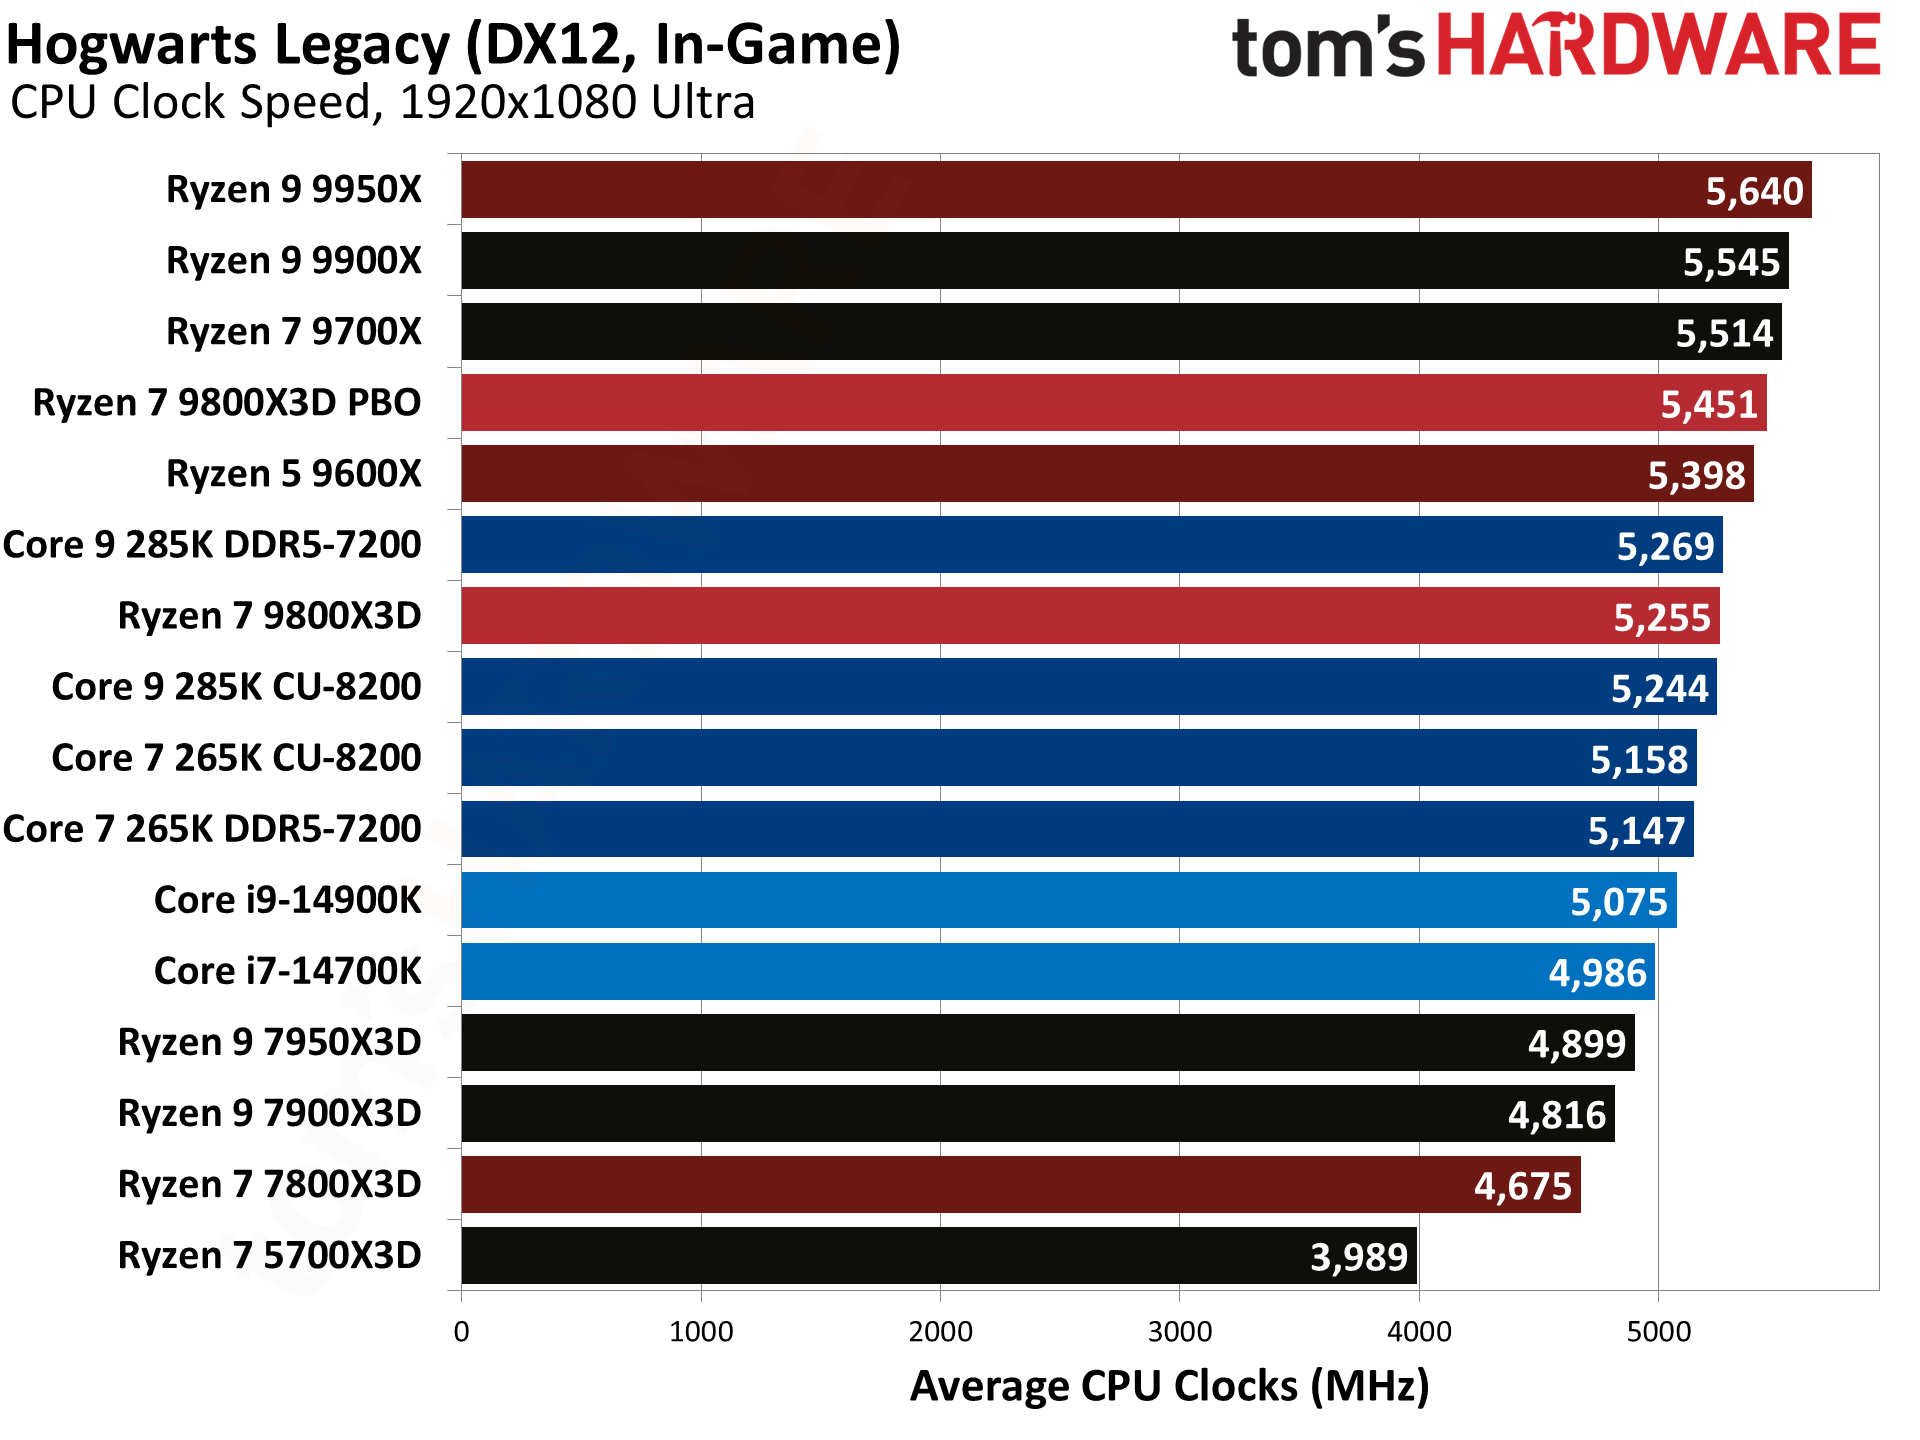
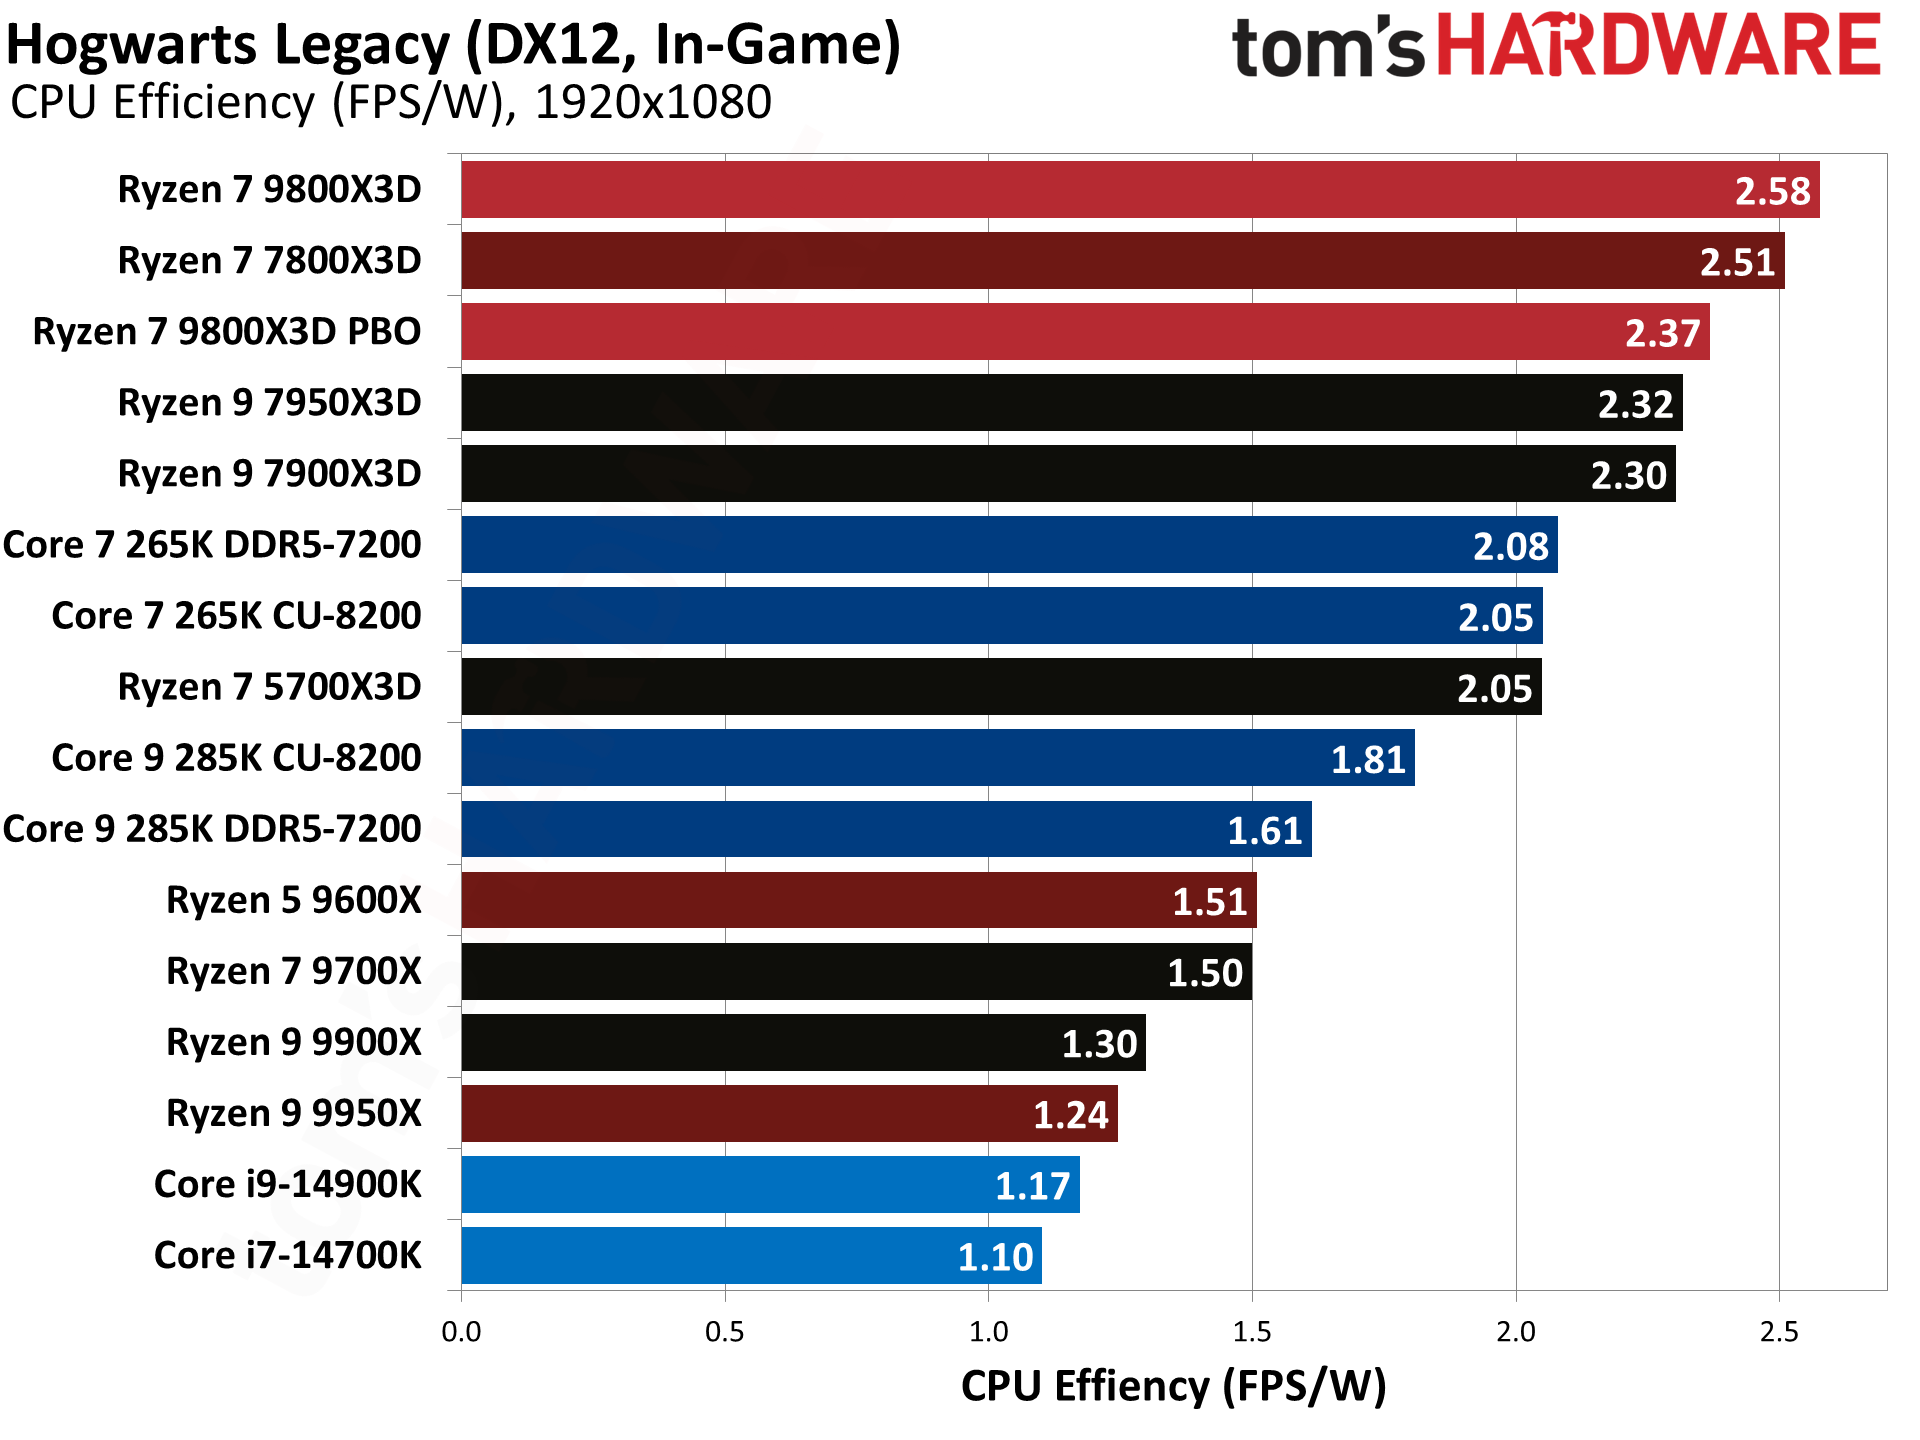
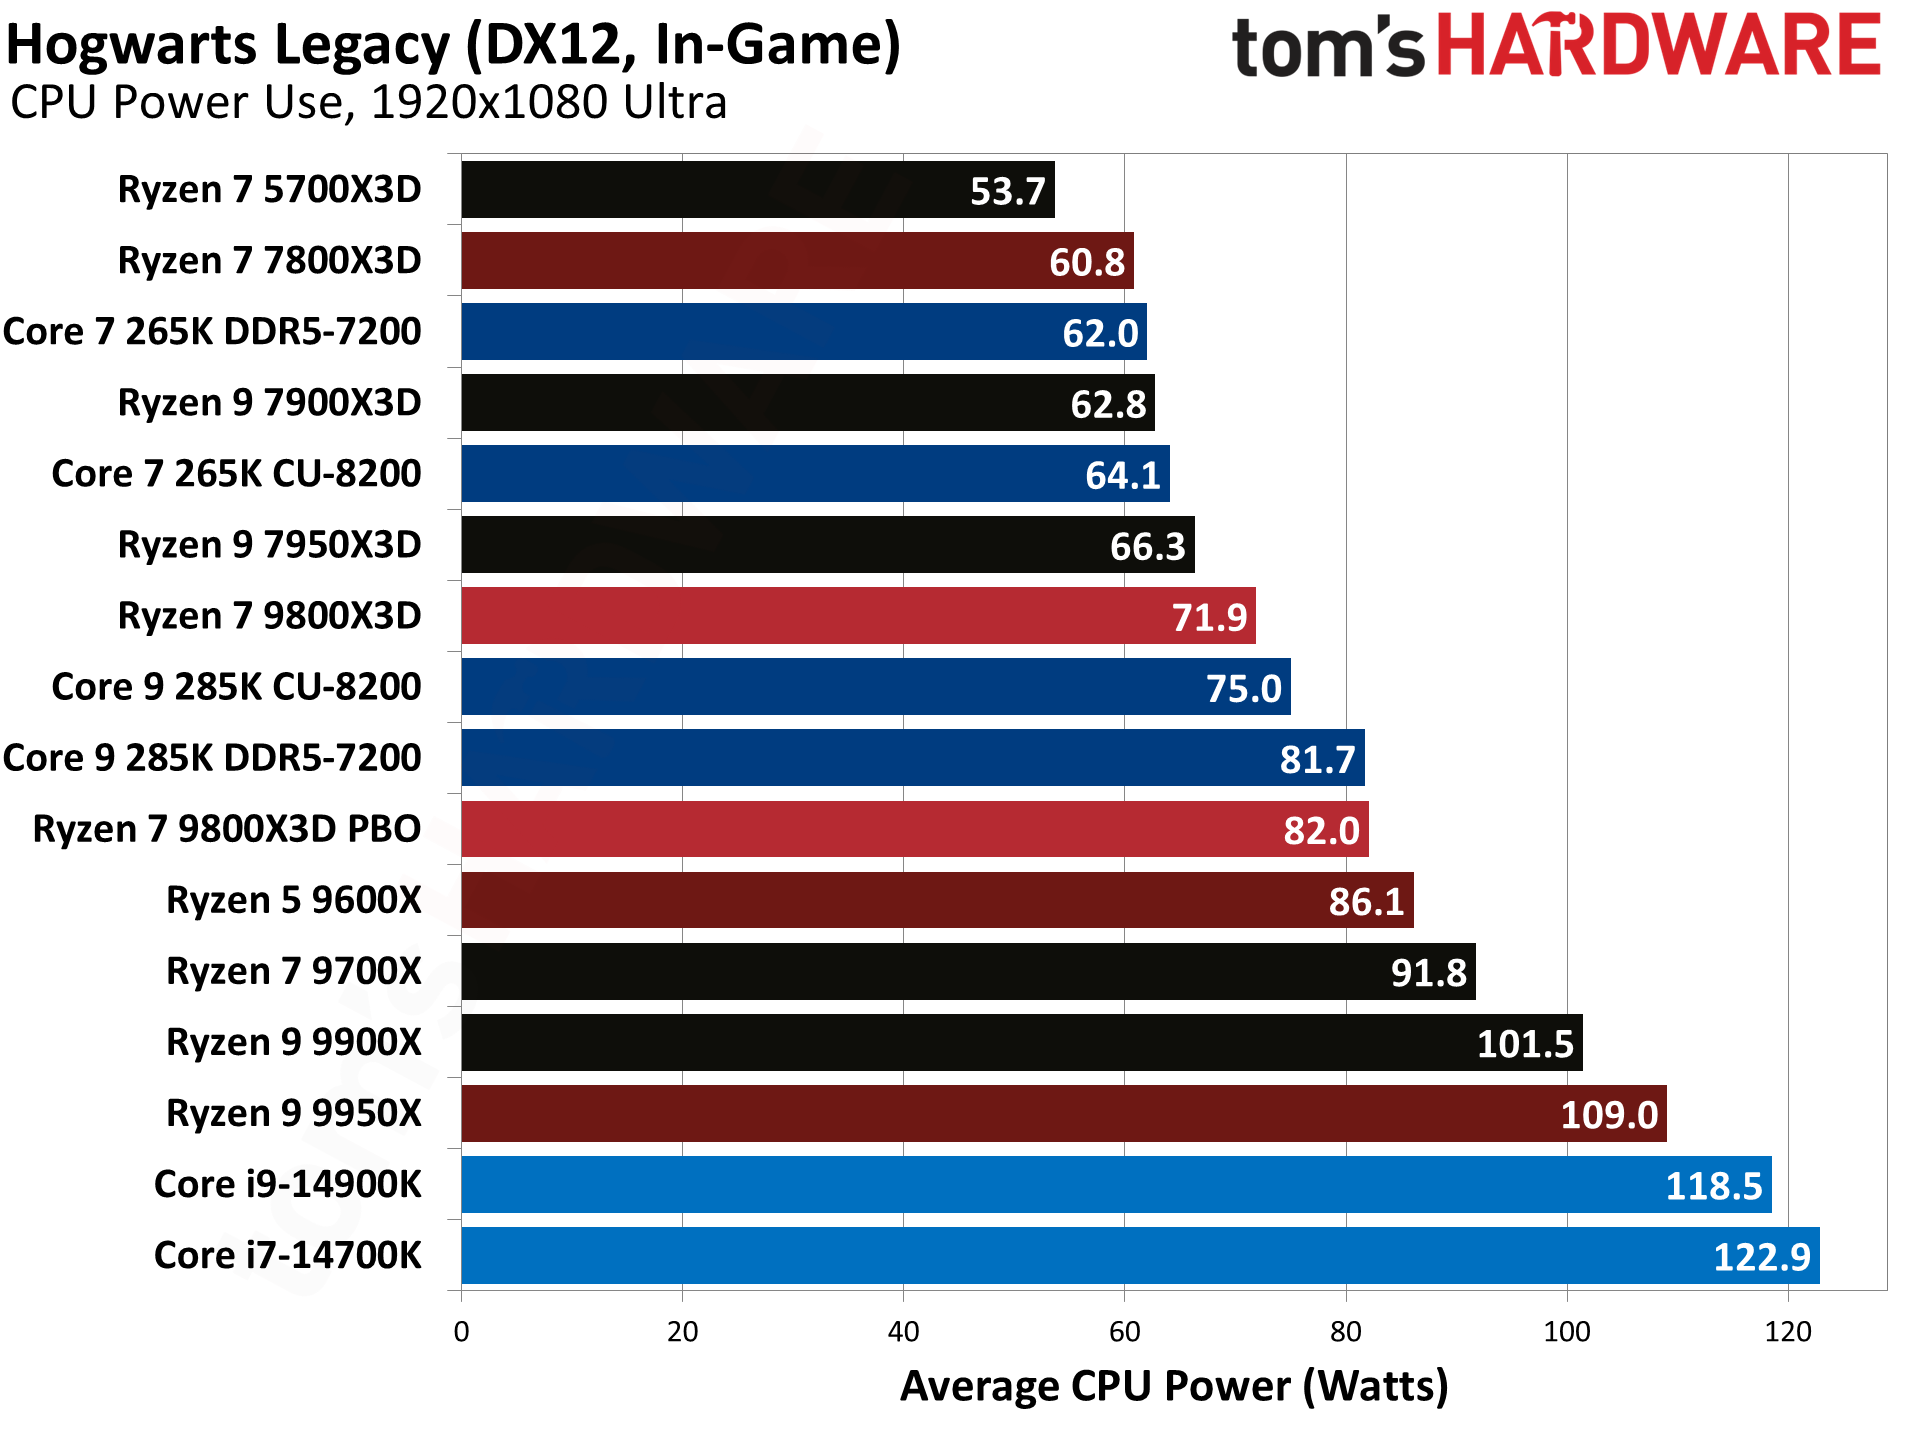
Hogwarts Legacy is the second most favorable result for 9800X3D compared to 7800X3D, with a 21% overall victory by the new chip. Intel's results are basically in line with our overall average: the 9800X3D ends up 33% faster than the 14900K and 37% faster than the 285K.
Microsoft Flight Simulator Benchmarks — AMD Ryzen 7 9800X3D
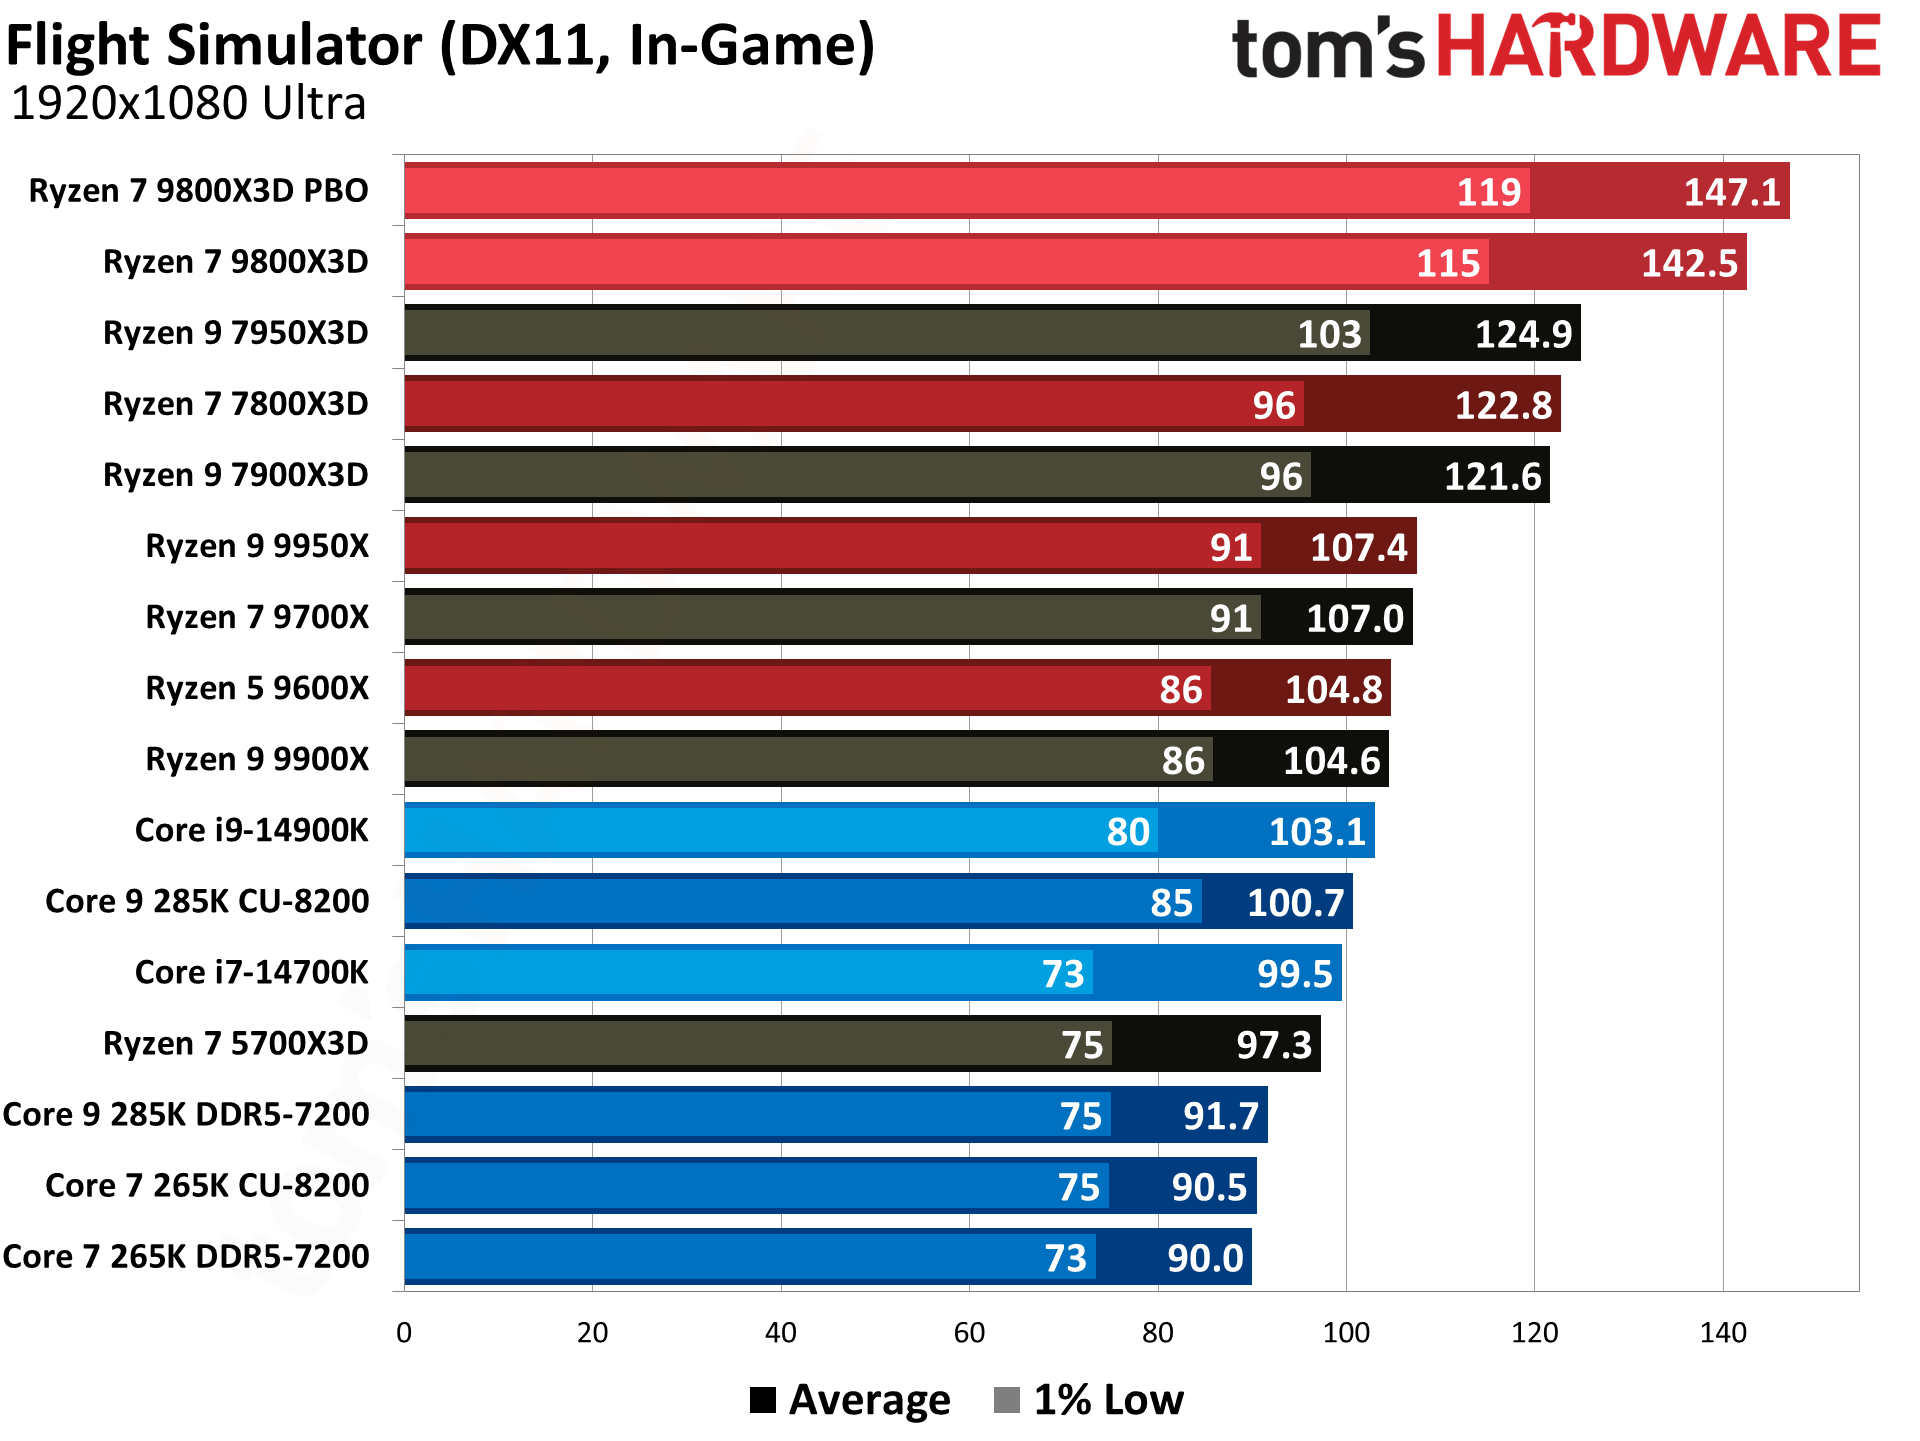
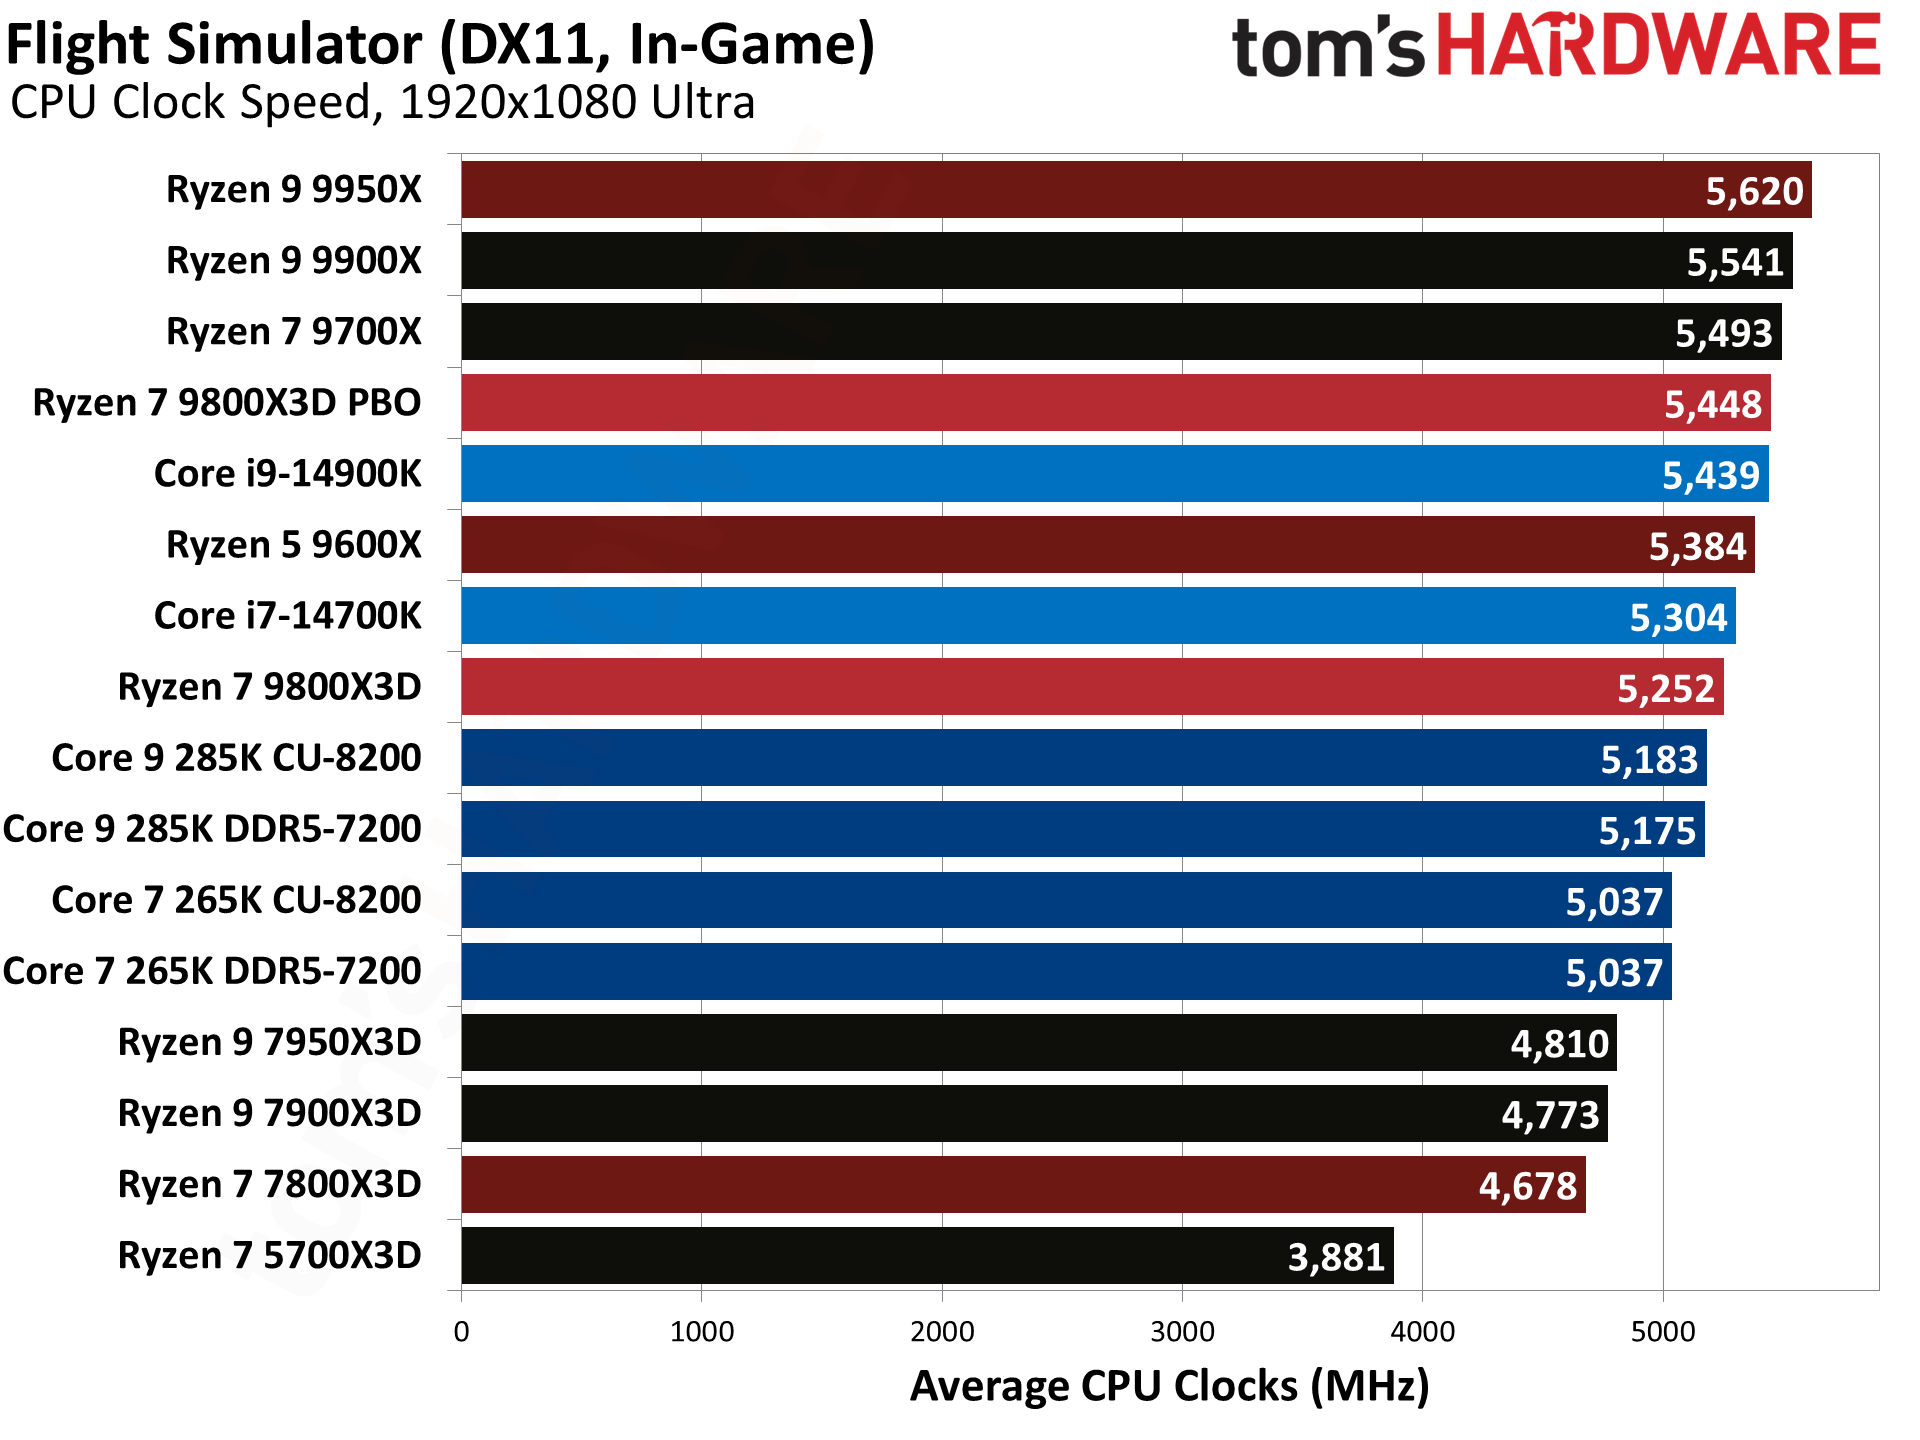
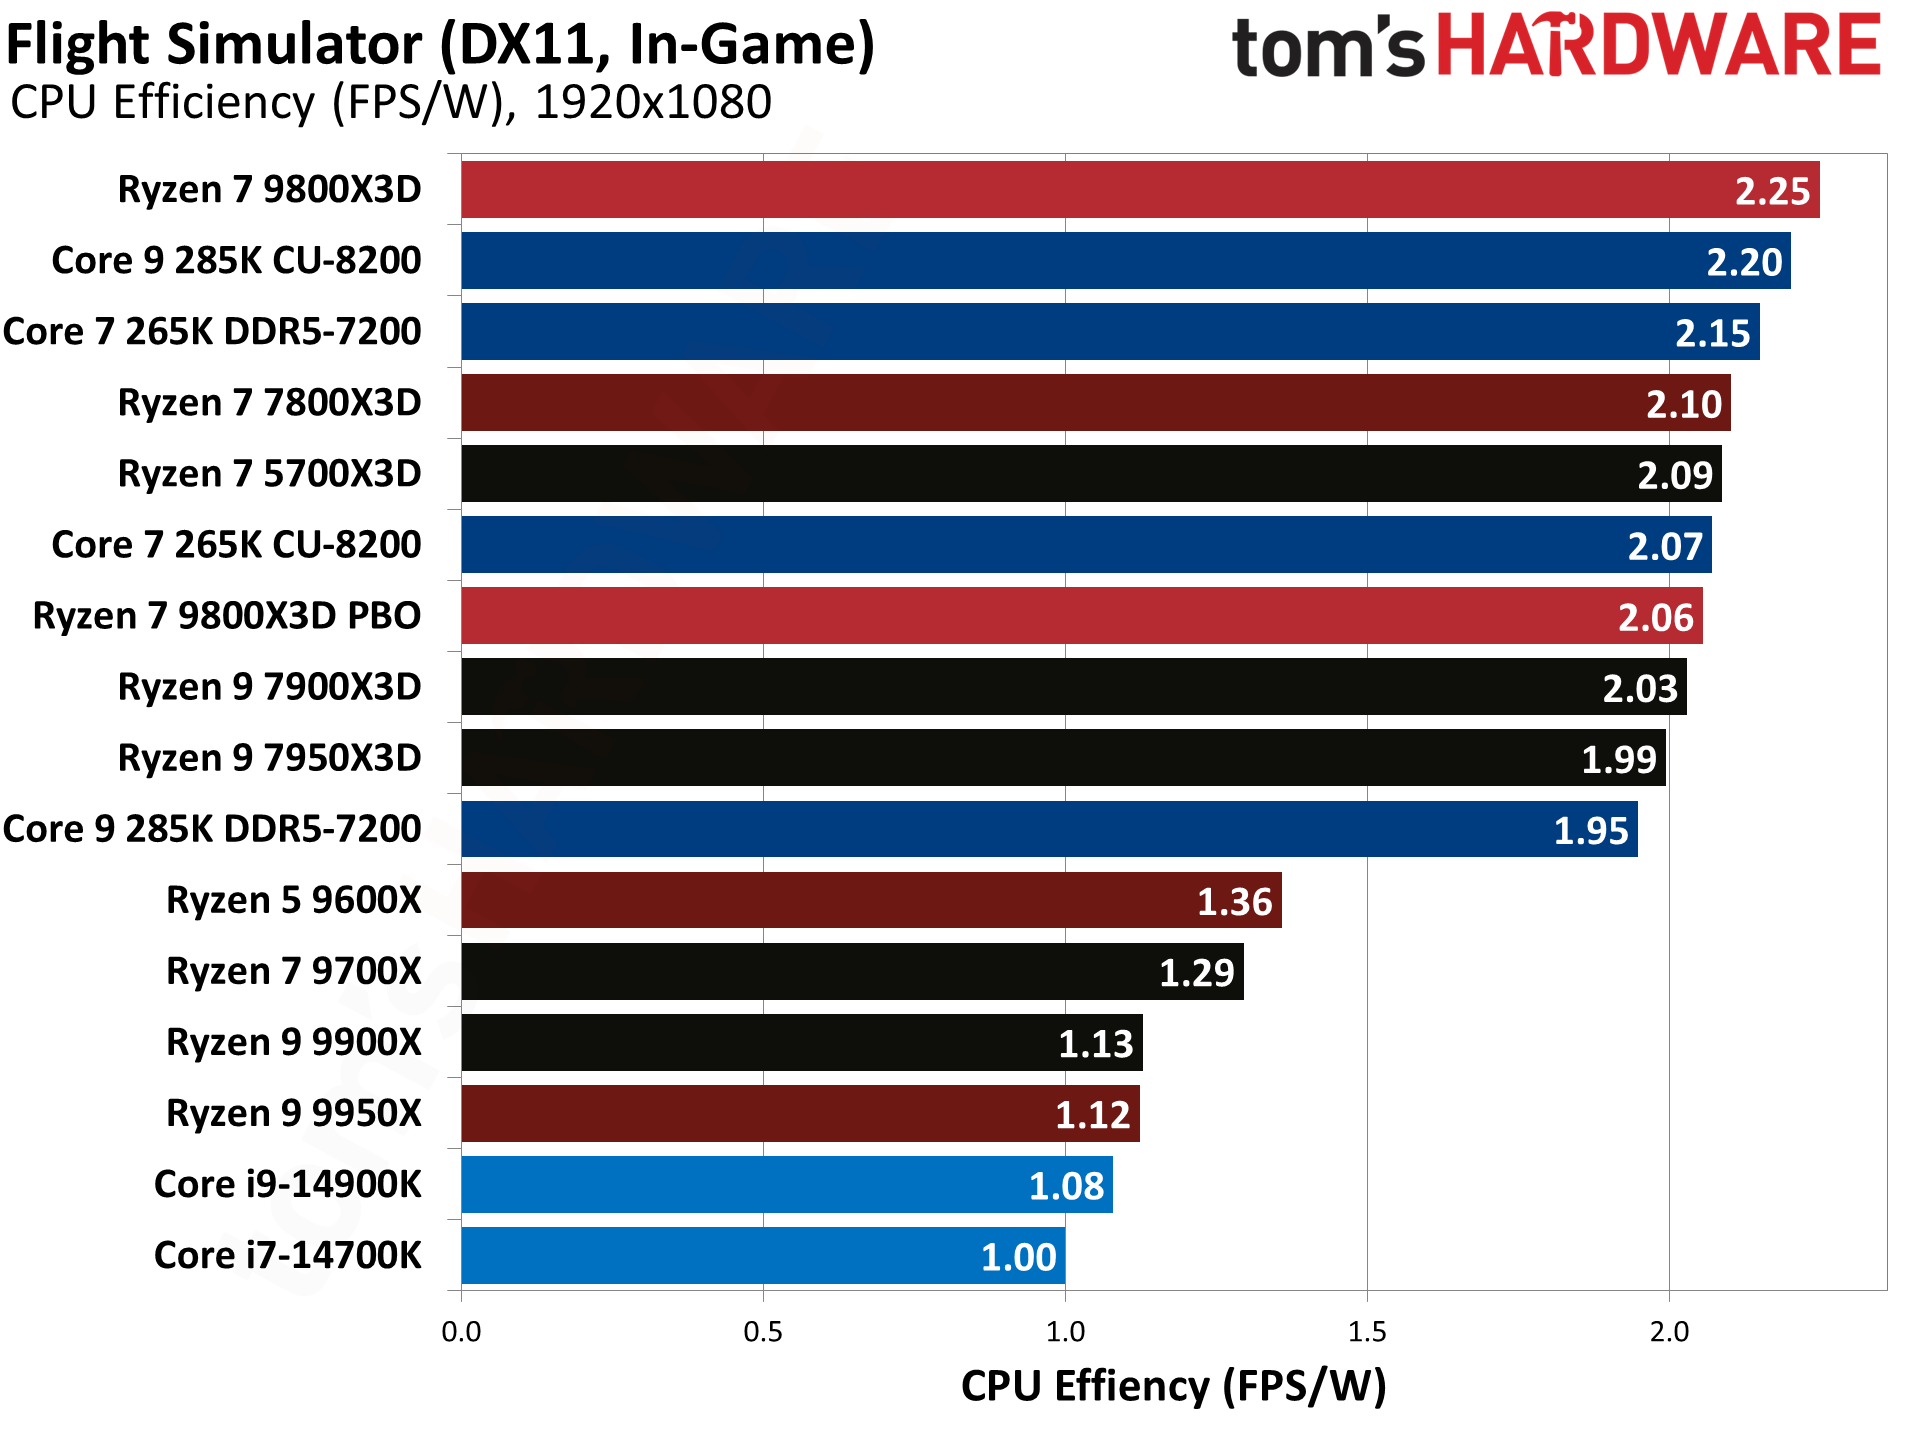
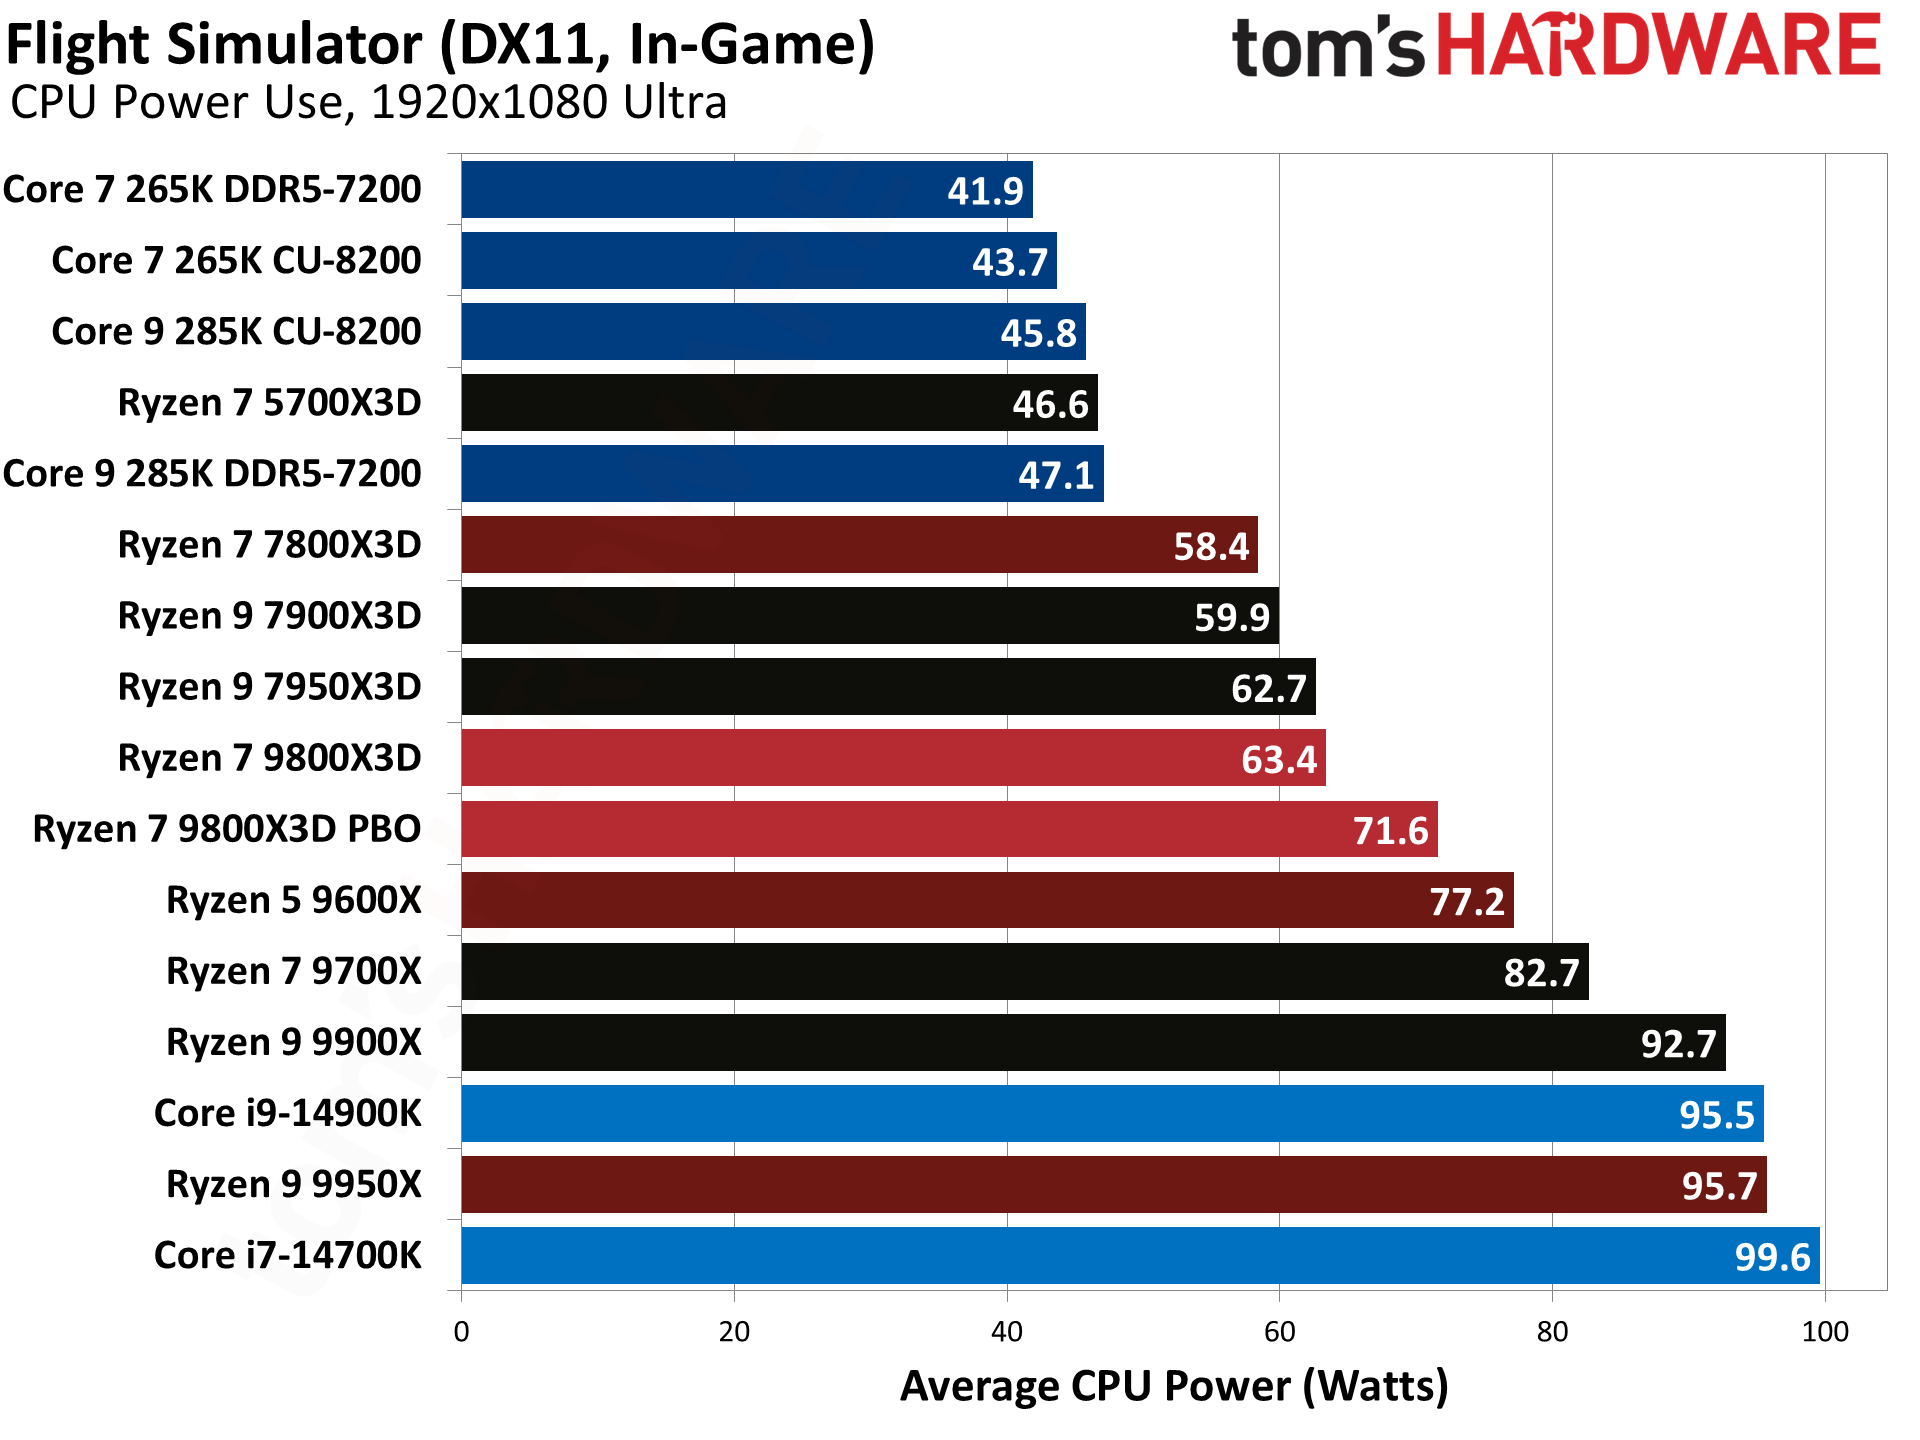
Microsoft Flight Simulator 2021 obviously benefits from L3 cache — the Ryzen X3D chips are incredible in this title. 9800X3D beats the 7800X3D by 16%, close to our geomean difference, but Intel's chips fall off the pace. AMD's latest is 38% faster than the 14900K and 42% faster than the 285K. That's not Intel's worst result, but it's definitely in the lower half of the test suite as far as performance goes.
Spider-Man: Remastered Benchmarks — AMD Ryzen 7 9800X3D
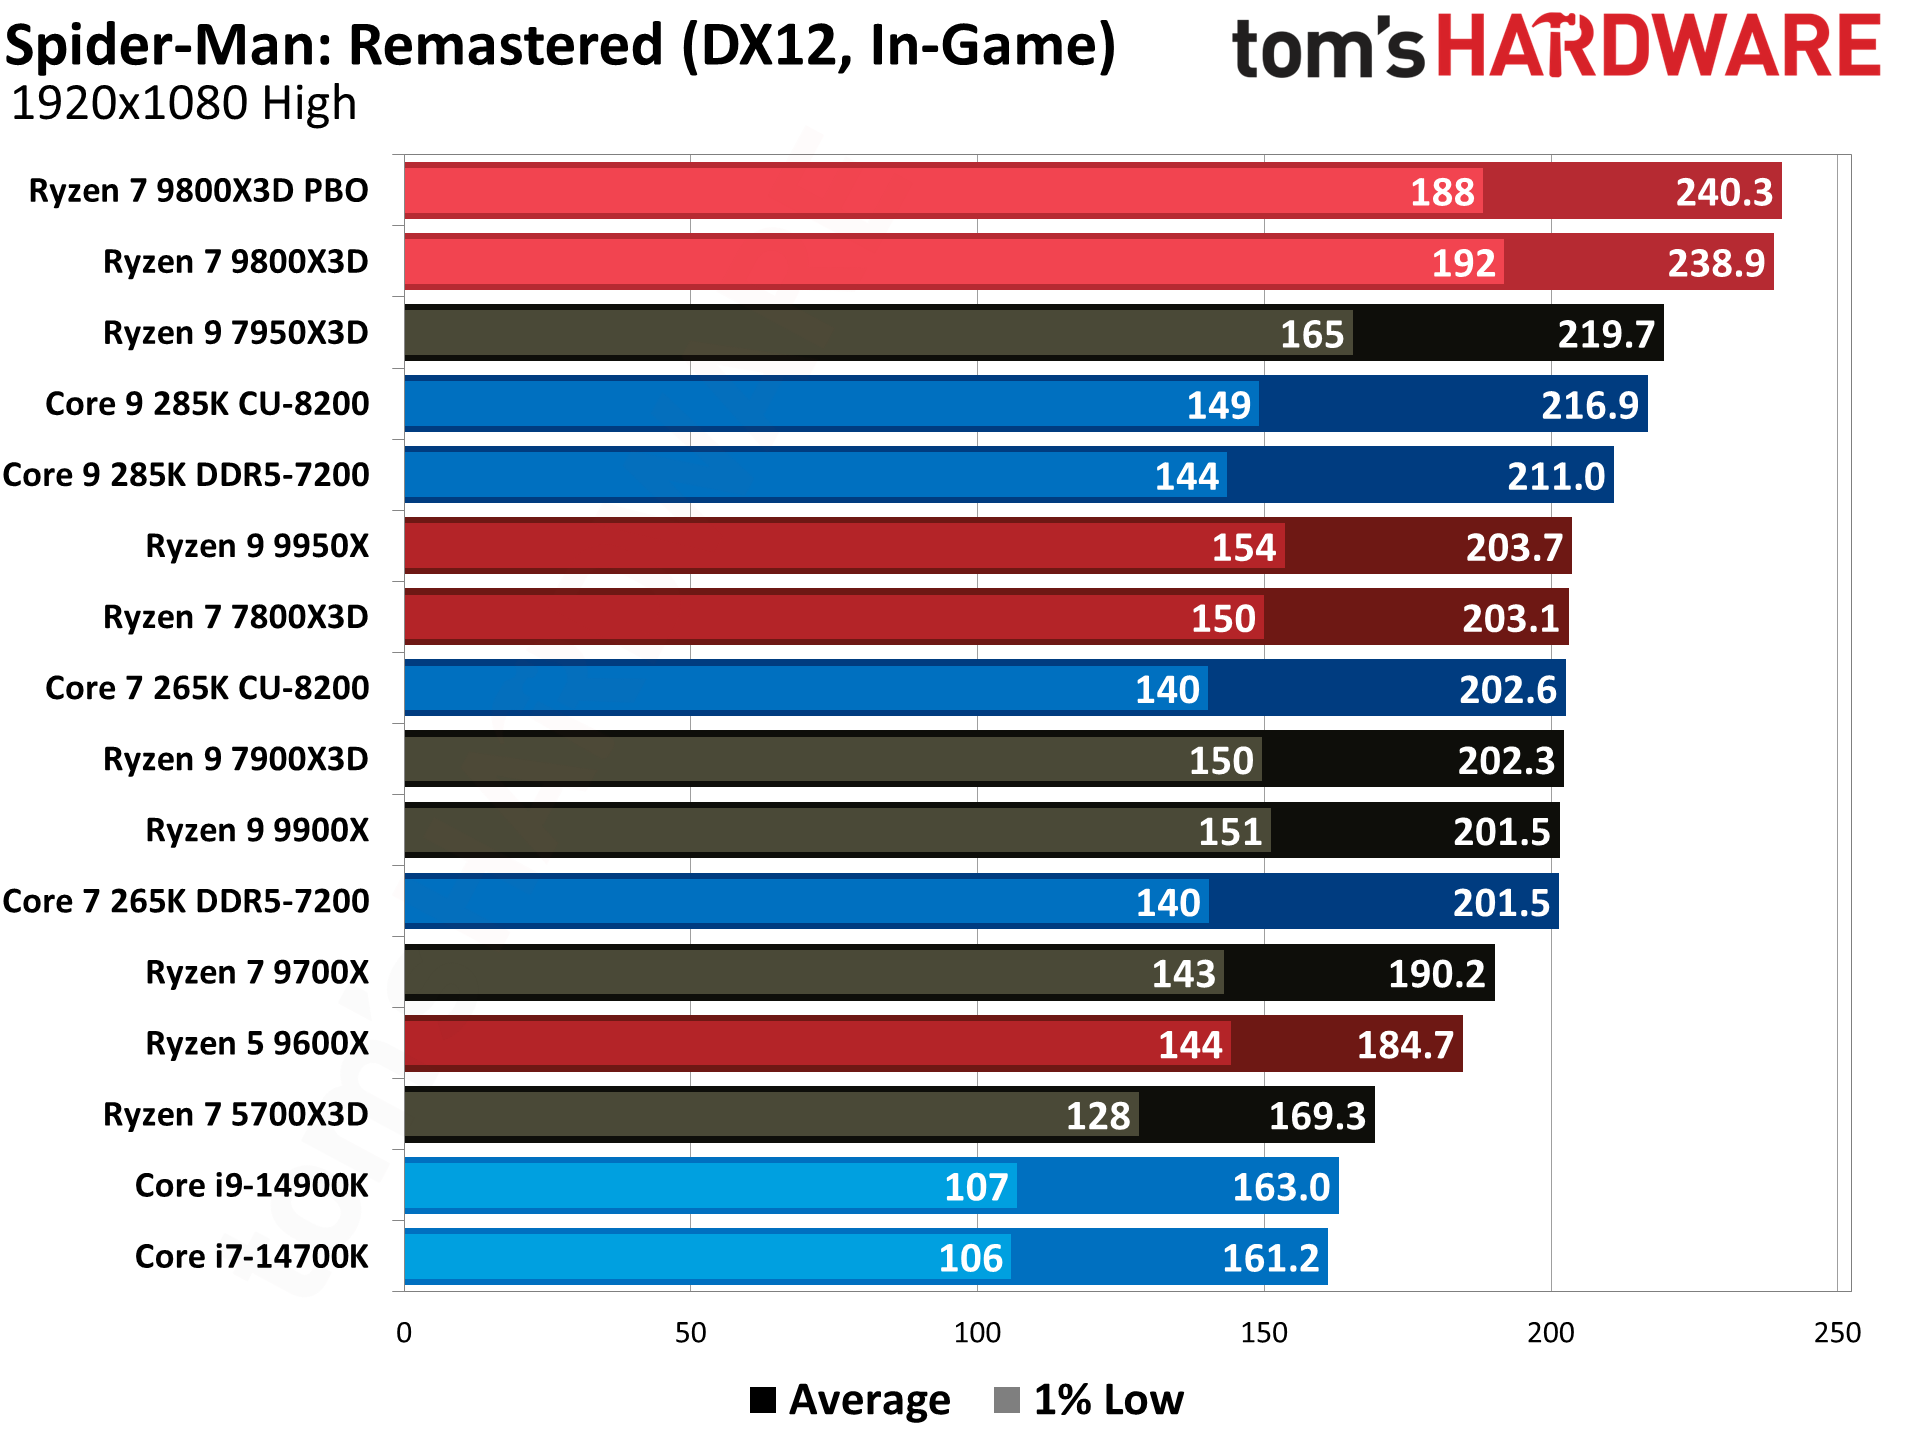
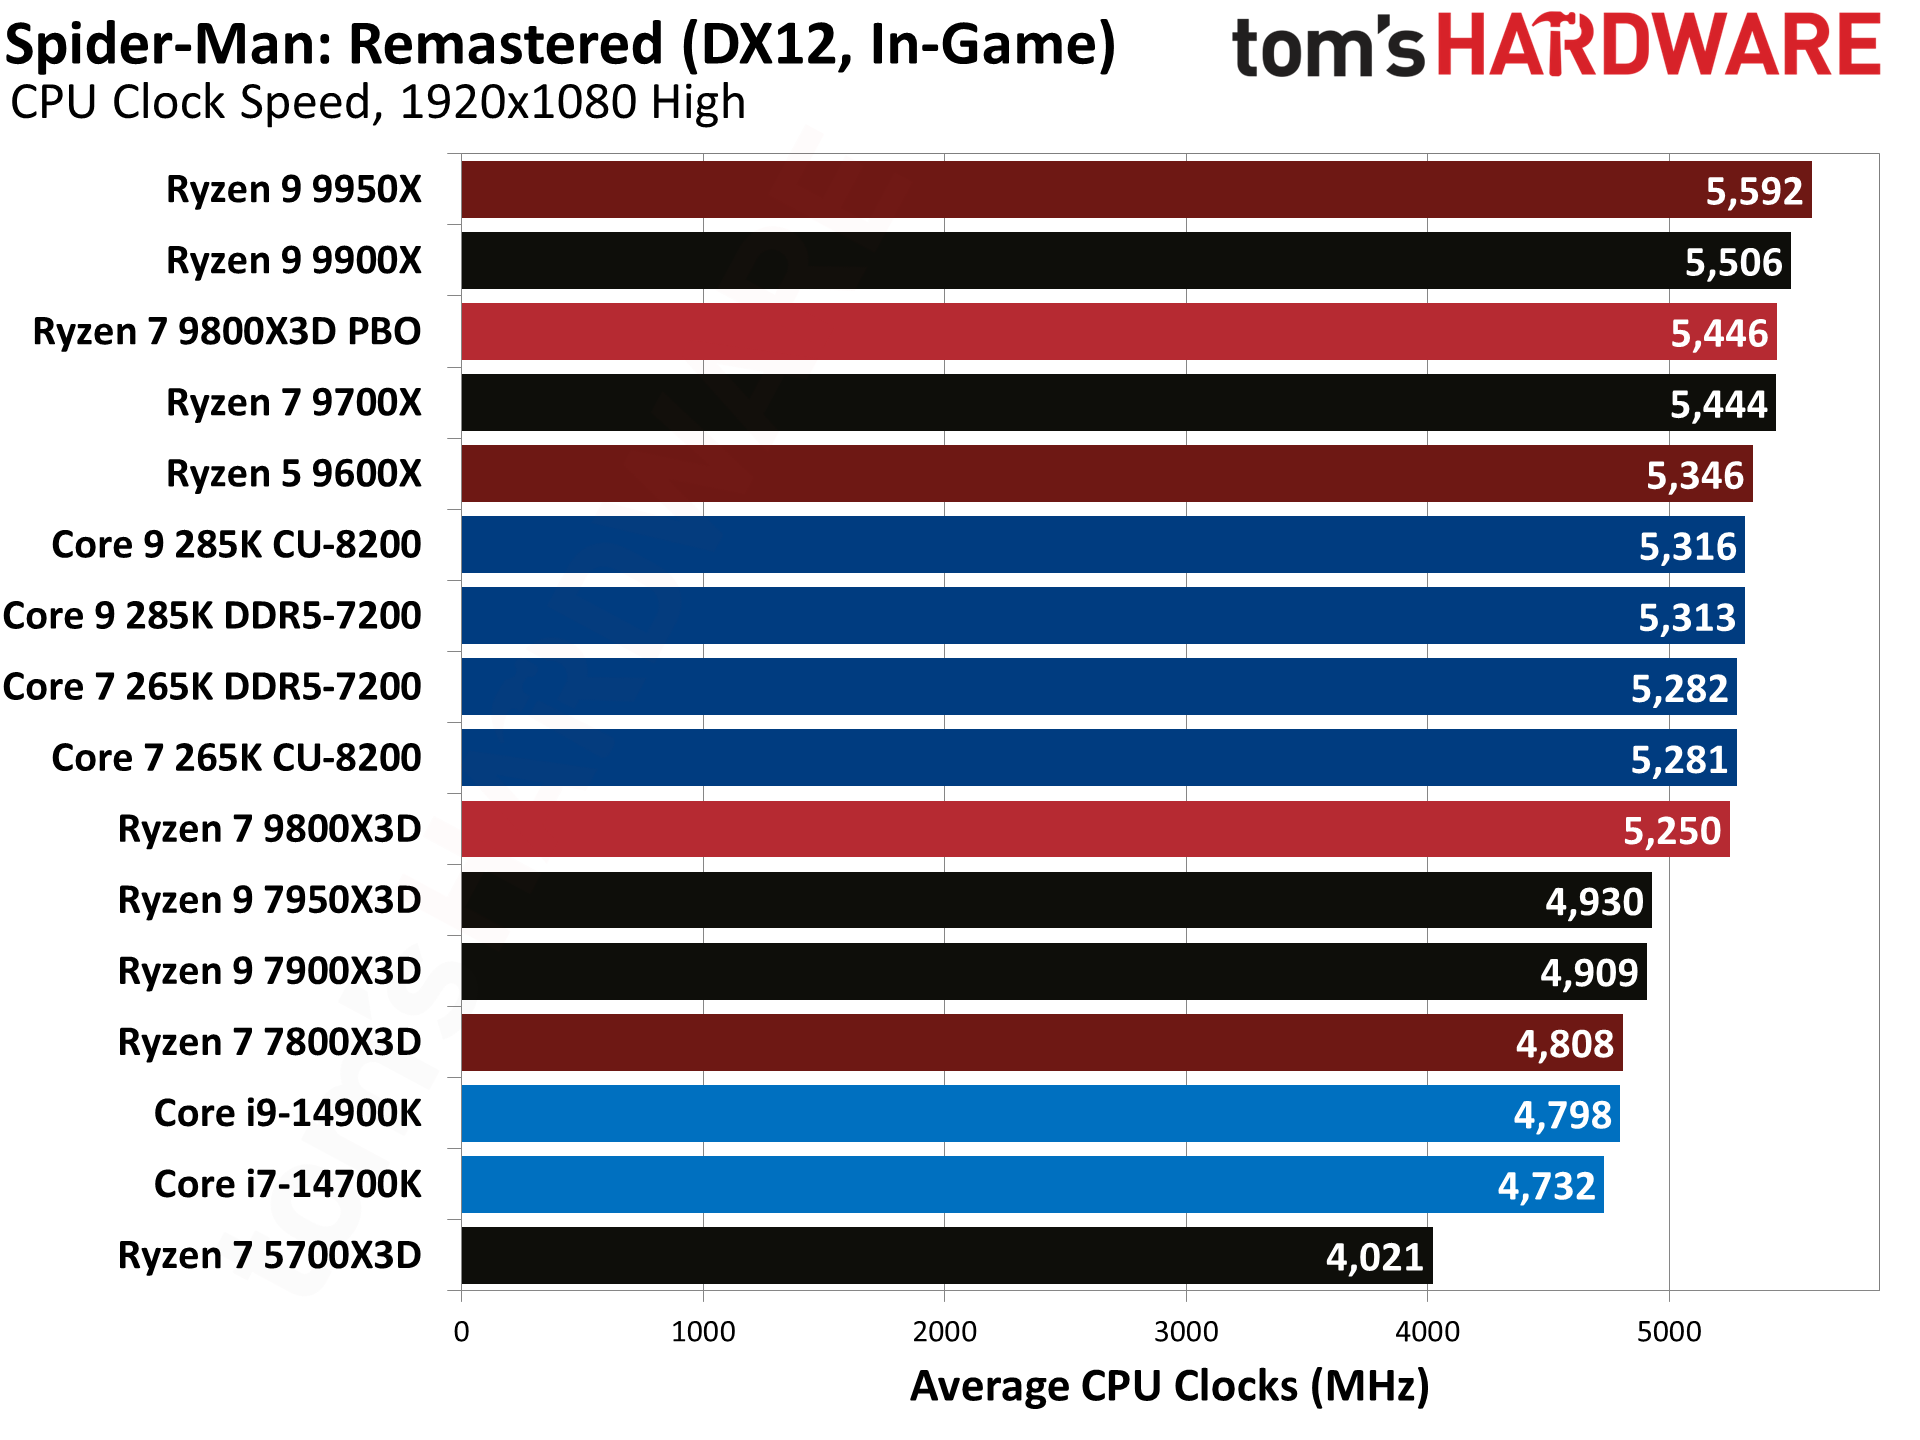
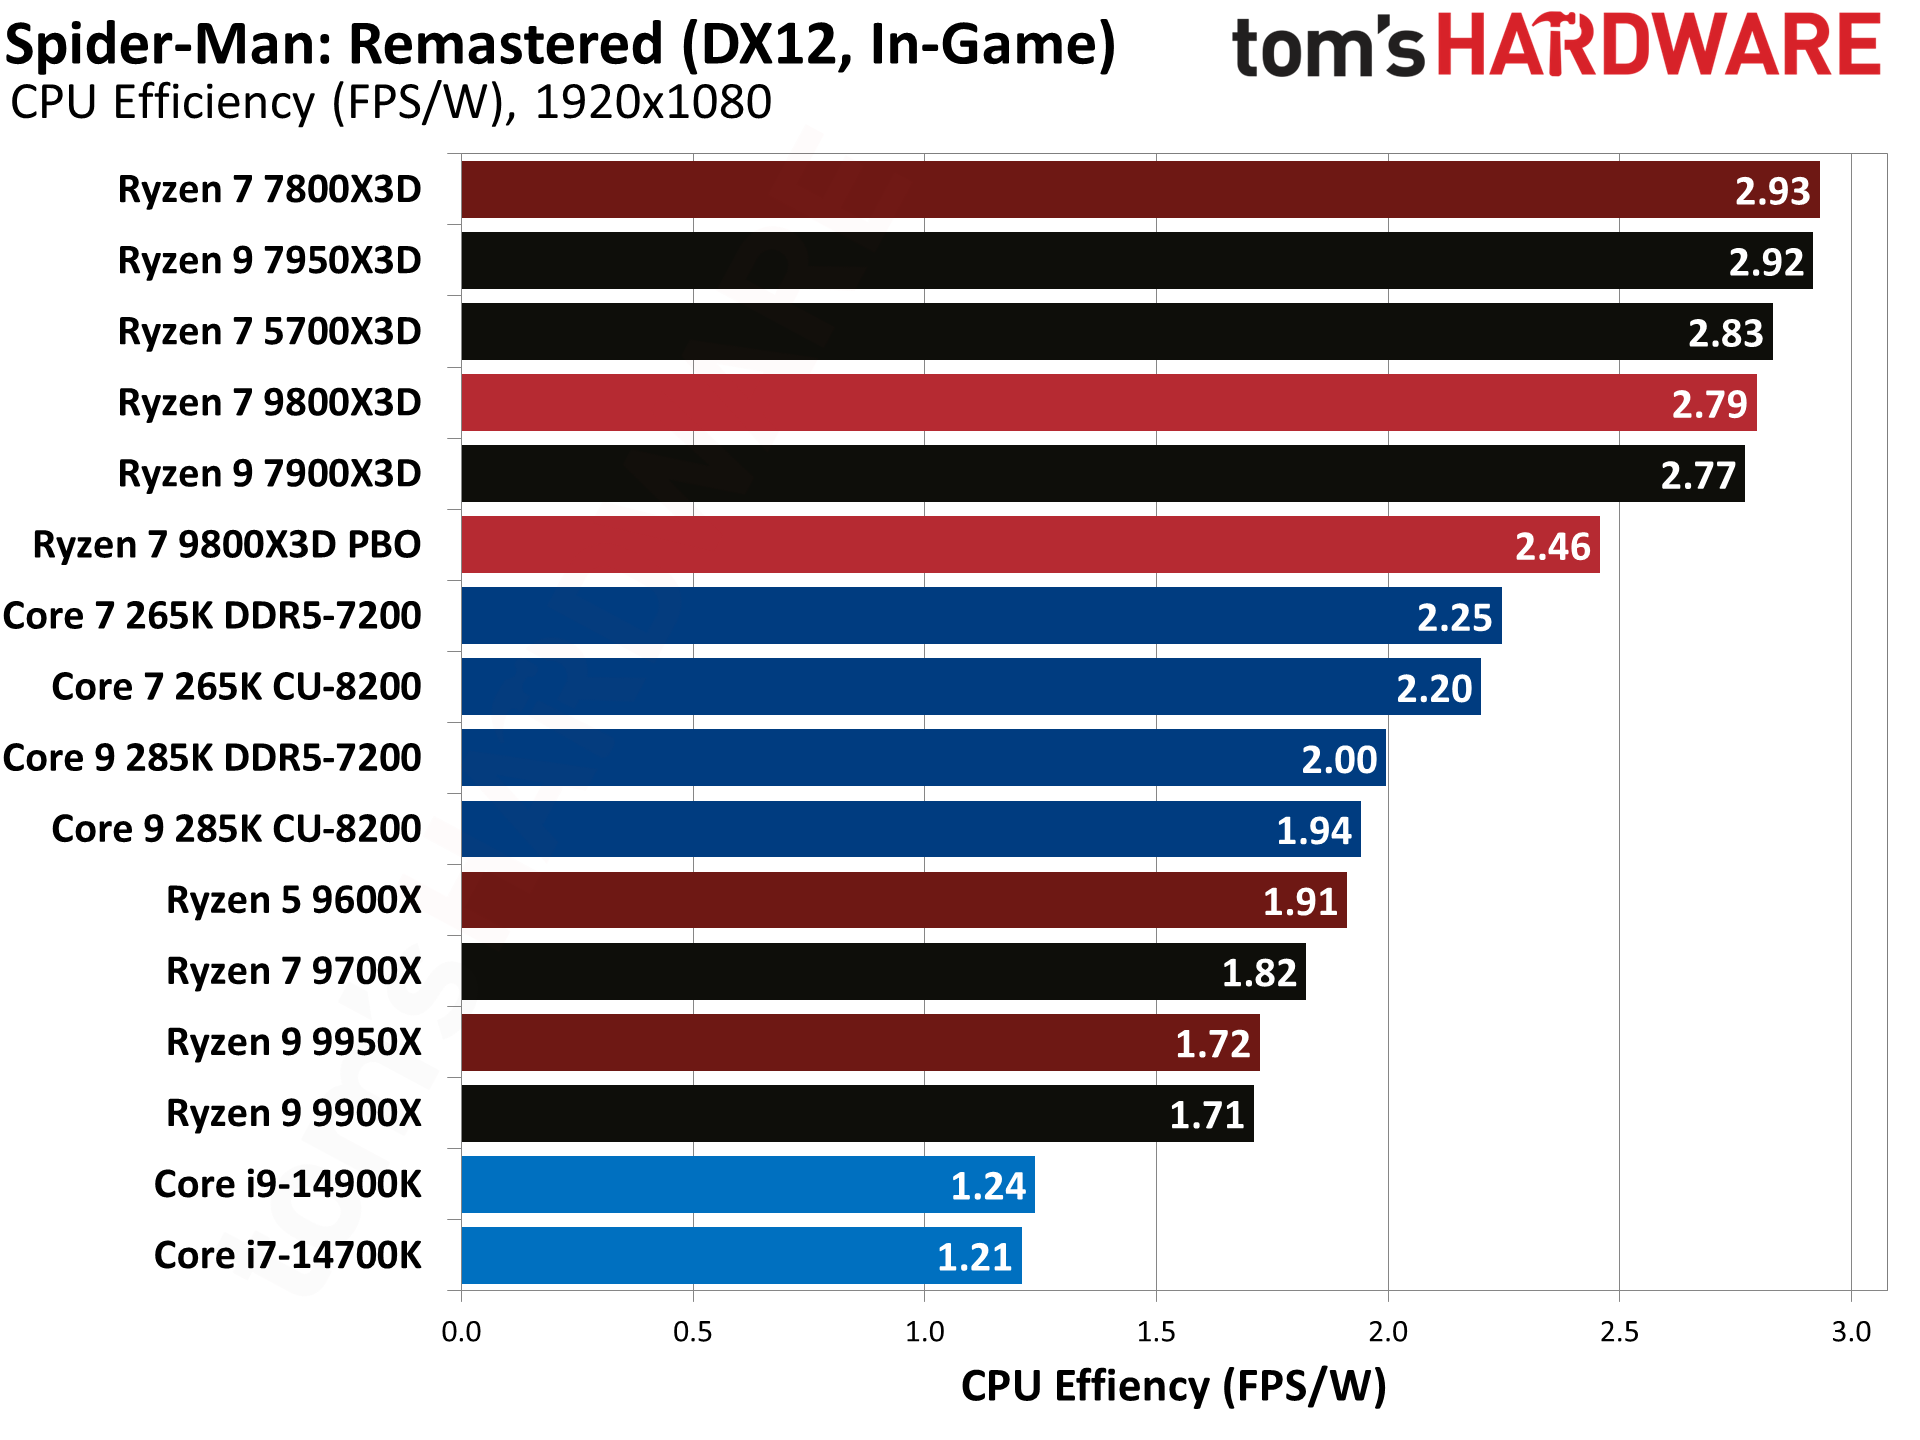
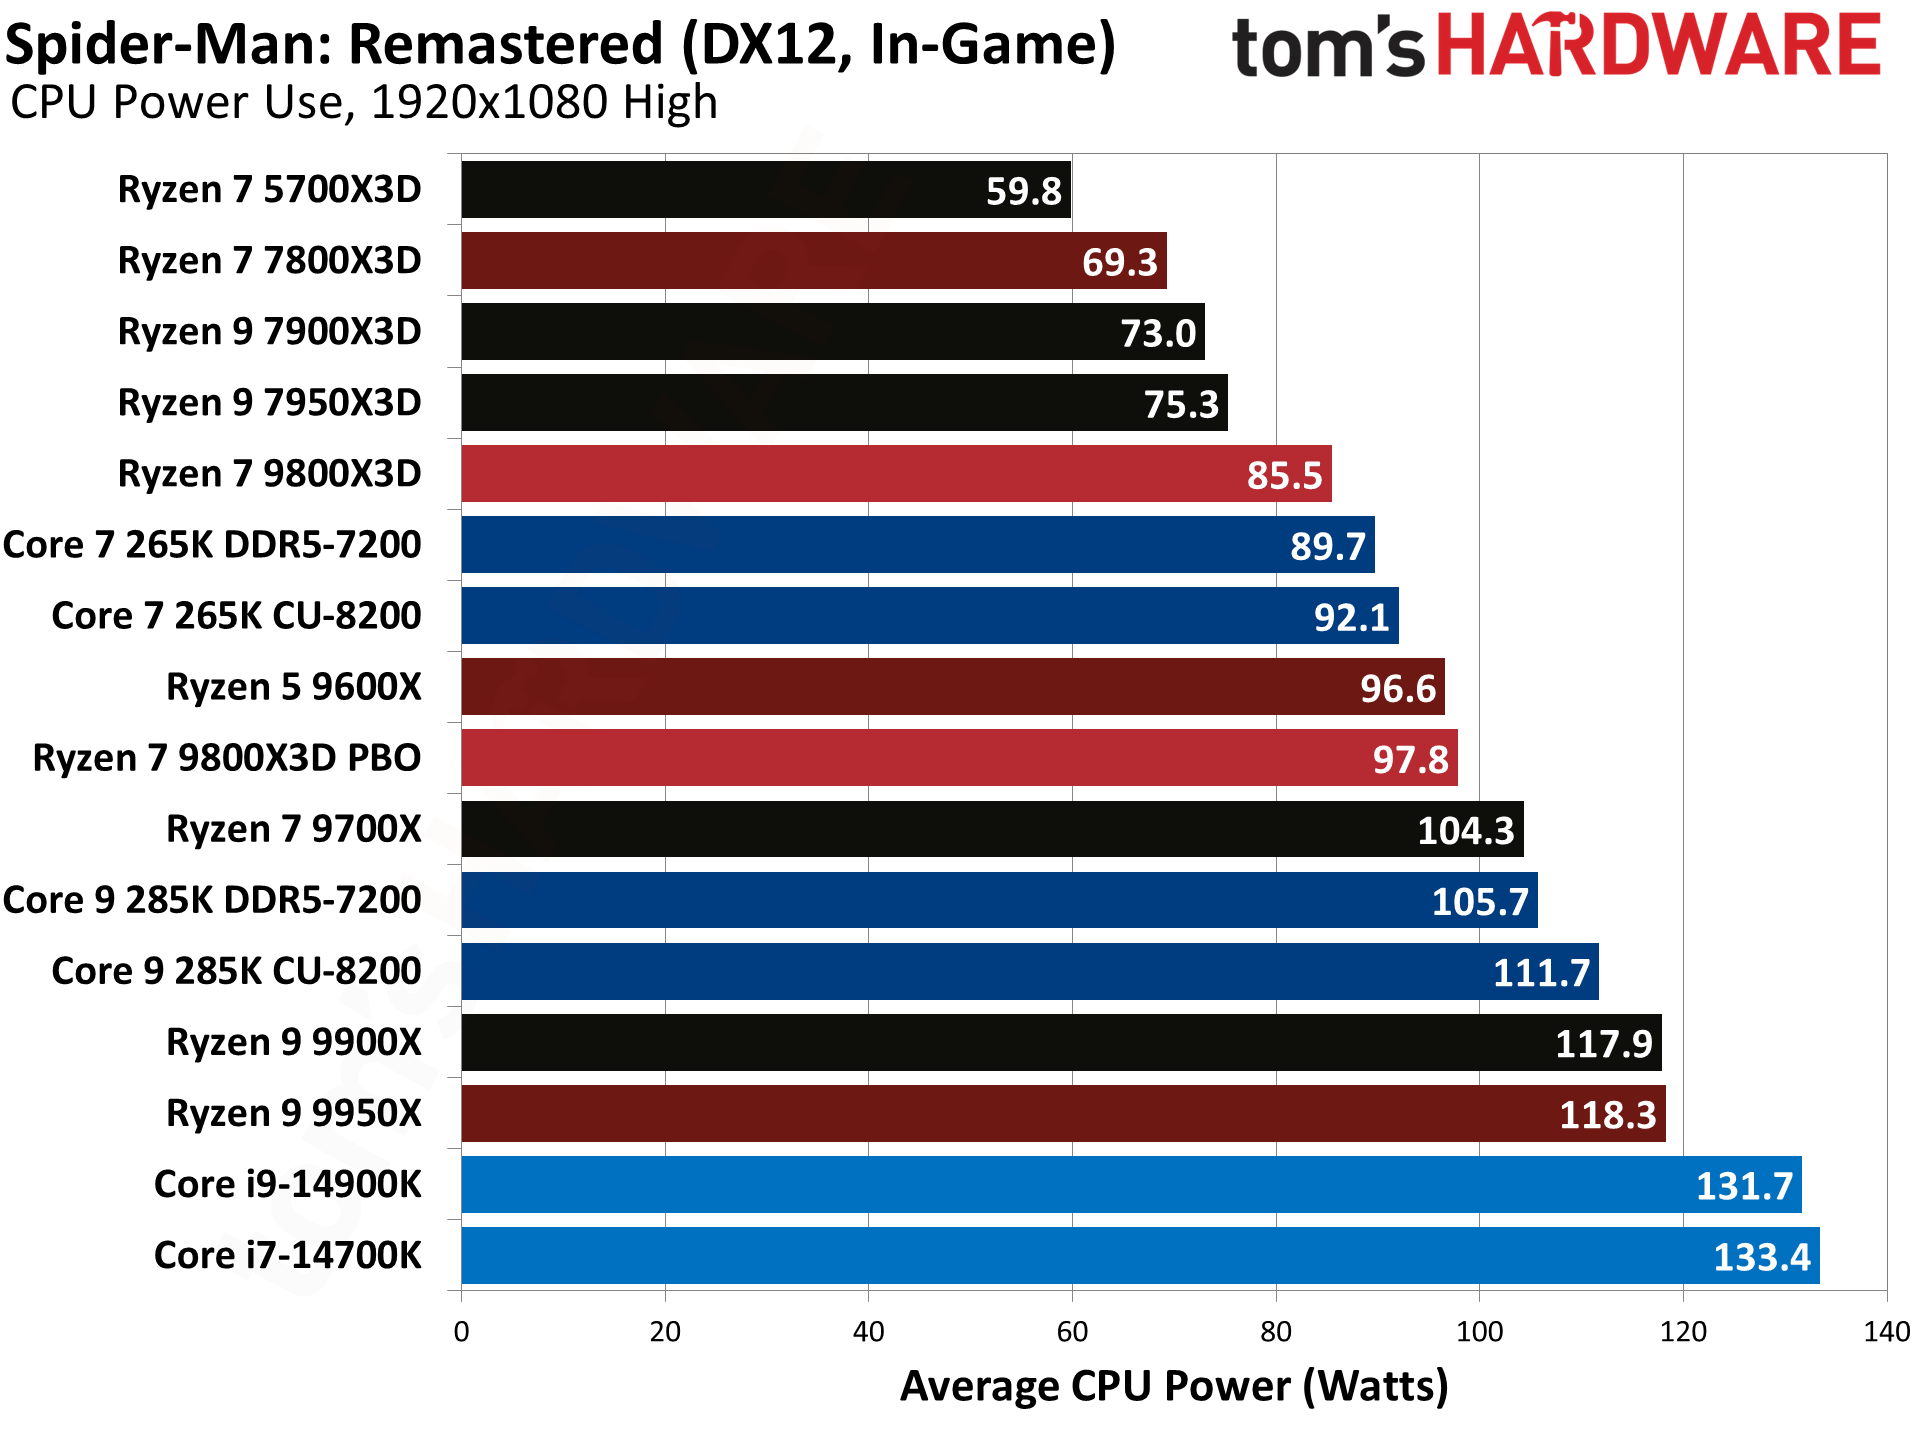
Spider-Man: Remastered is a curious result, in that it's one of the few games where Arrow Lake CPUs actually outperform their Raptor Lake predecessors. The 9800X3D ends up just 10% faster than the 285K, our closest test result for those two chips. Against the 7800X3D, it's still a larger than average 17.6% lead, while the 14900K seriously underperforms and the 9800X3D claims a 47% margin of victory. This is the 14900K's worst result overall, though it's only a few percent worse than the Baldur's Gate 3 and A Plague Tale: Requiem standings.
Starfield Benchmarks — AMD Ryzen 7 9800X3D
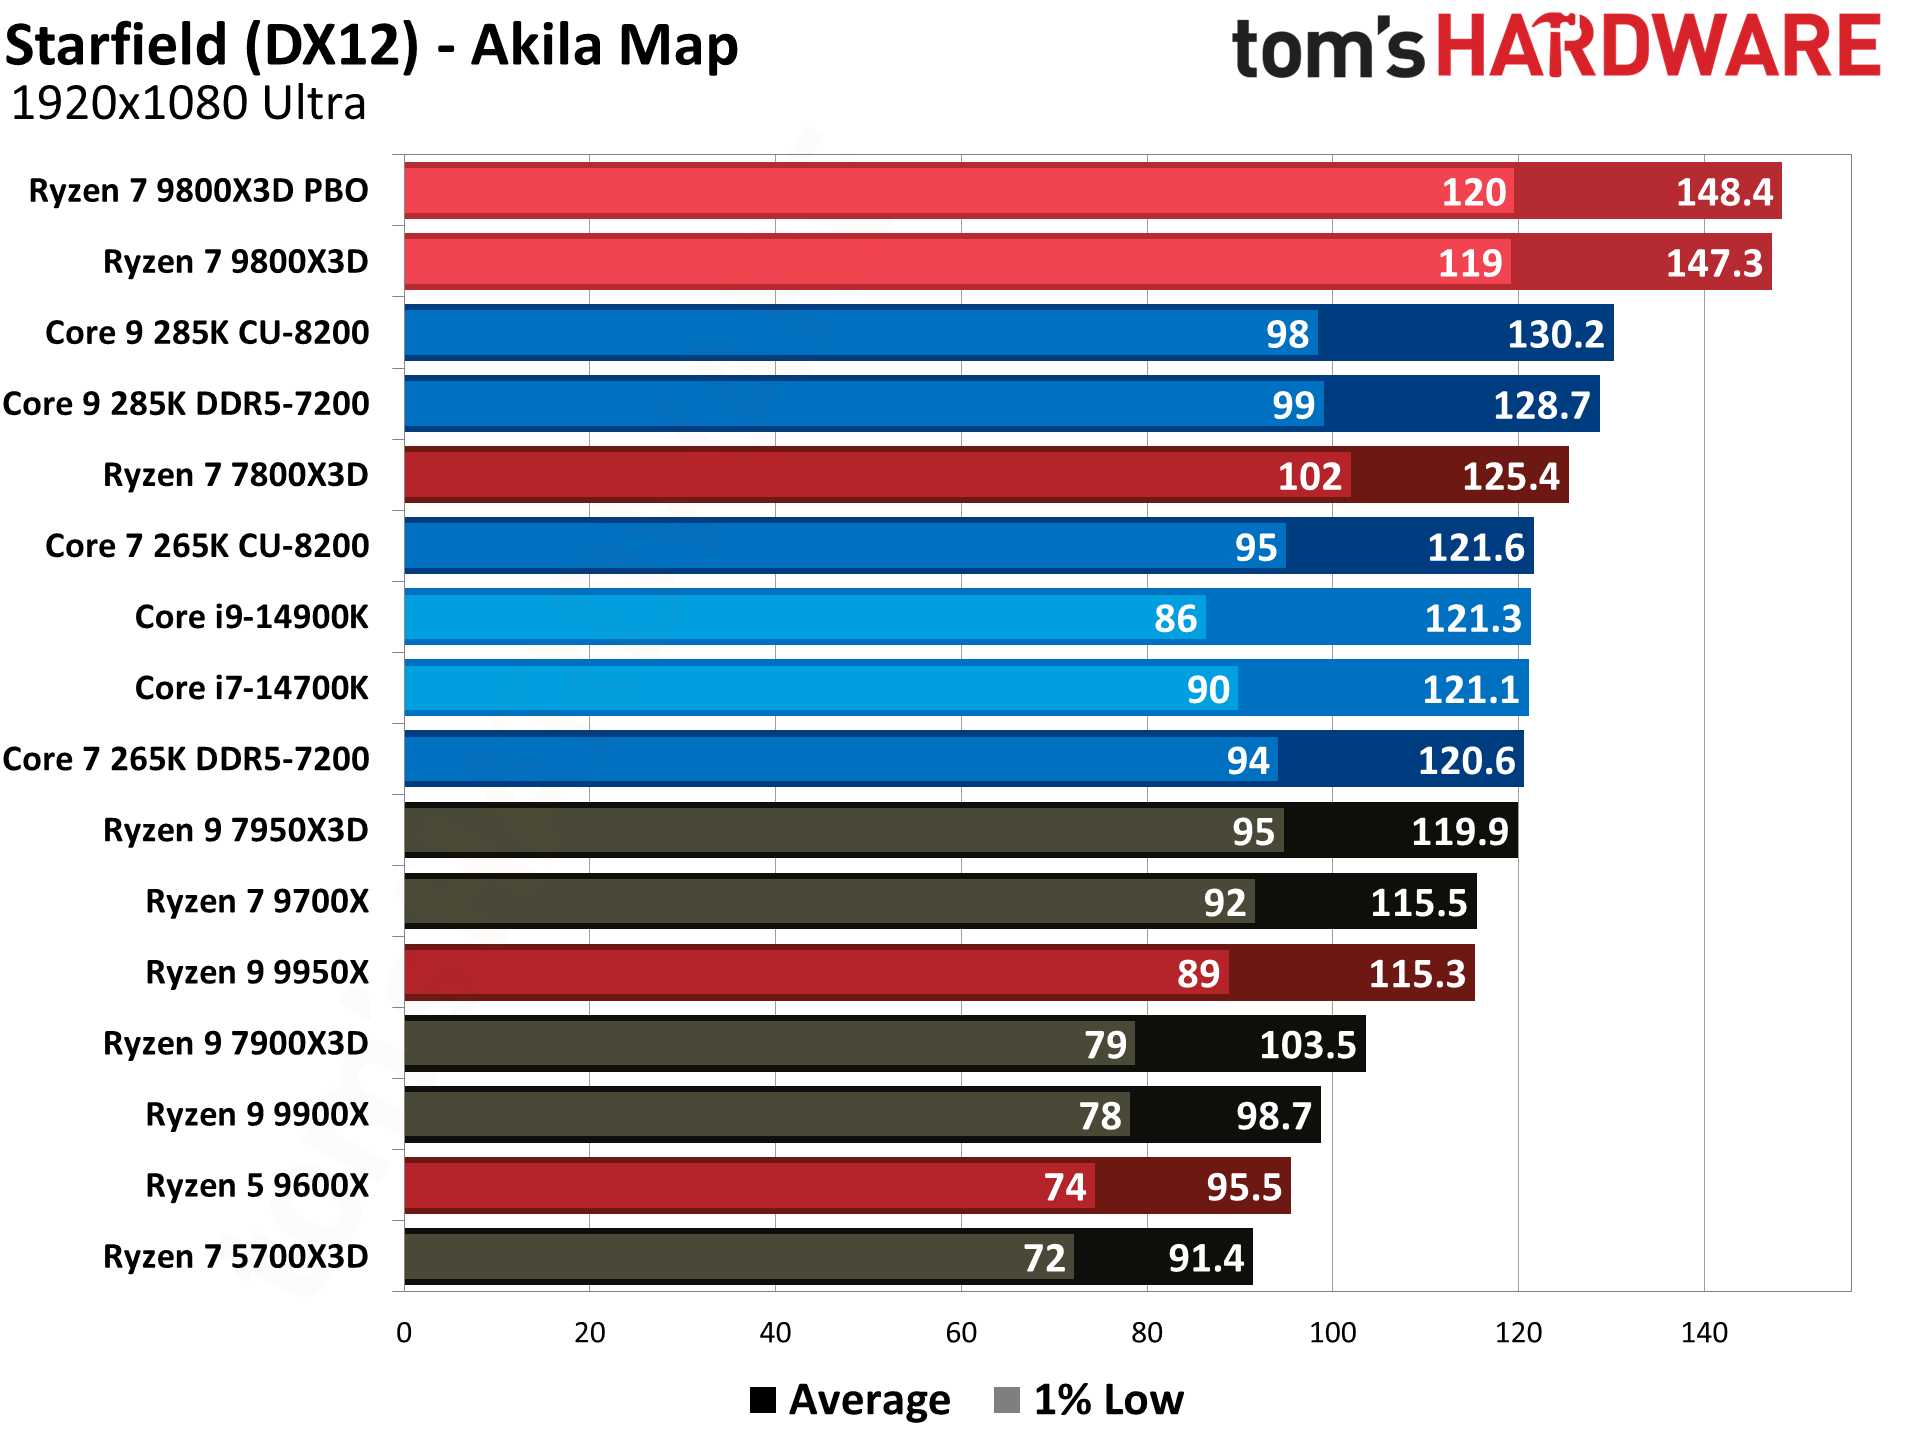
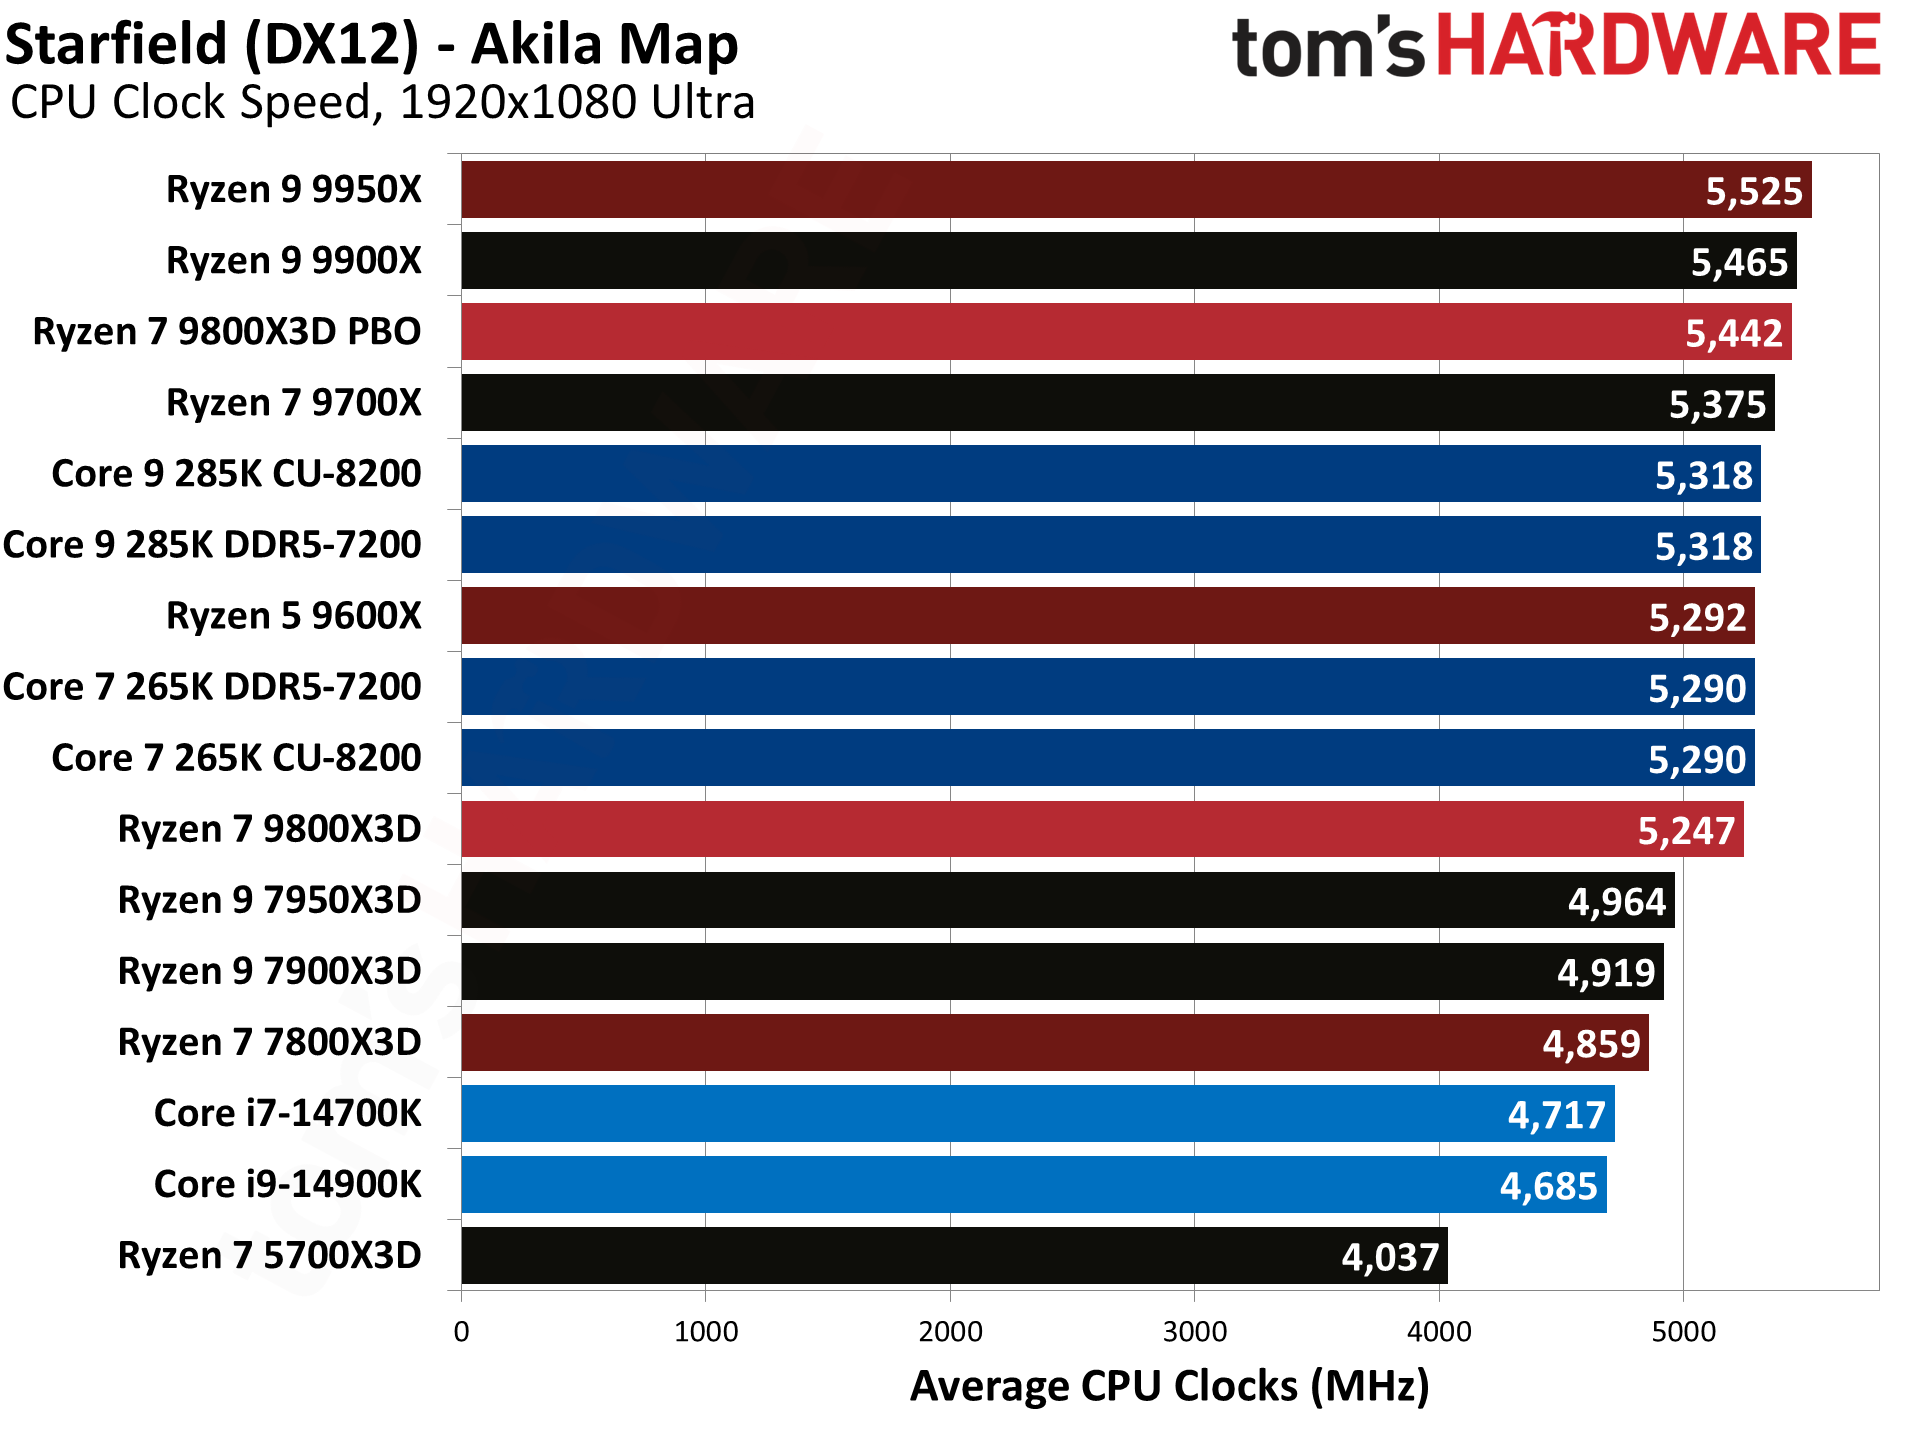
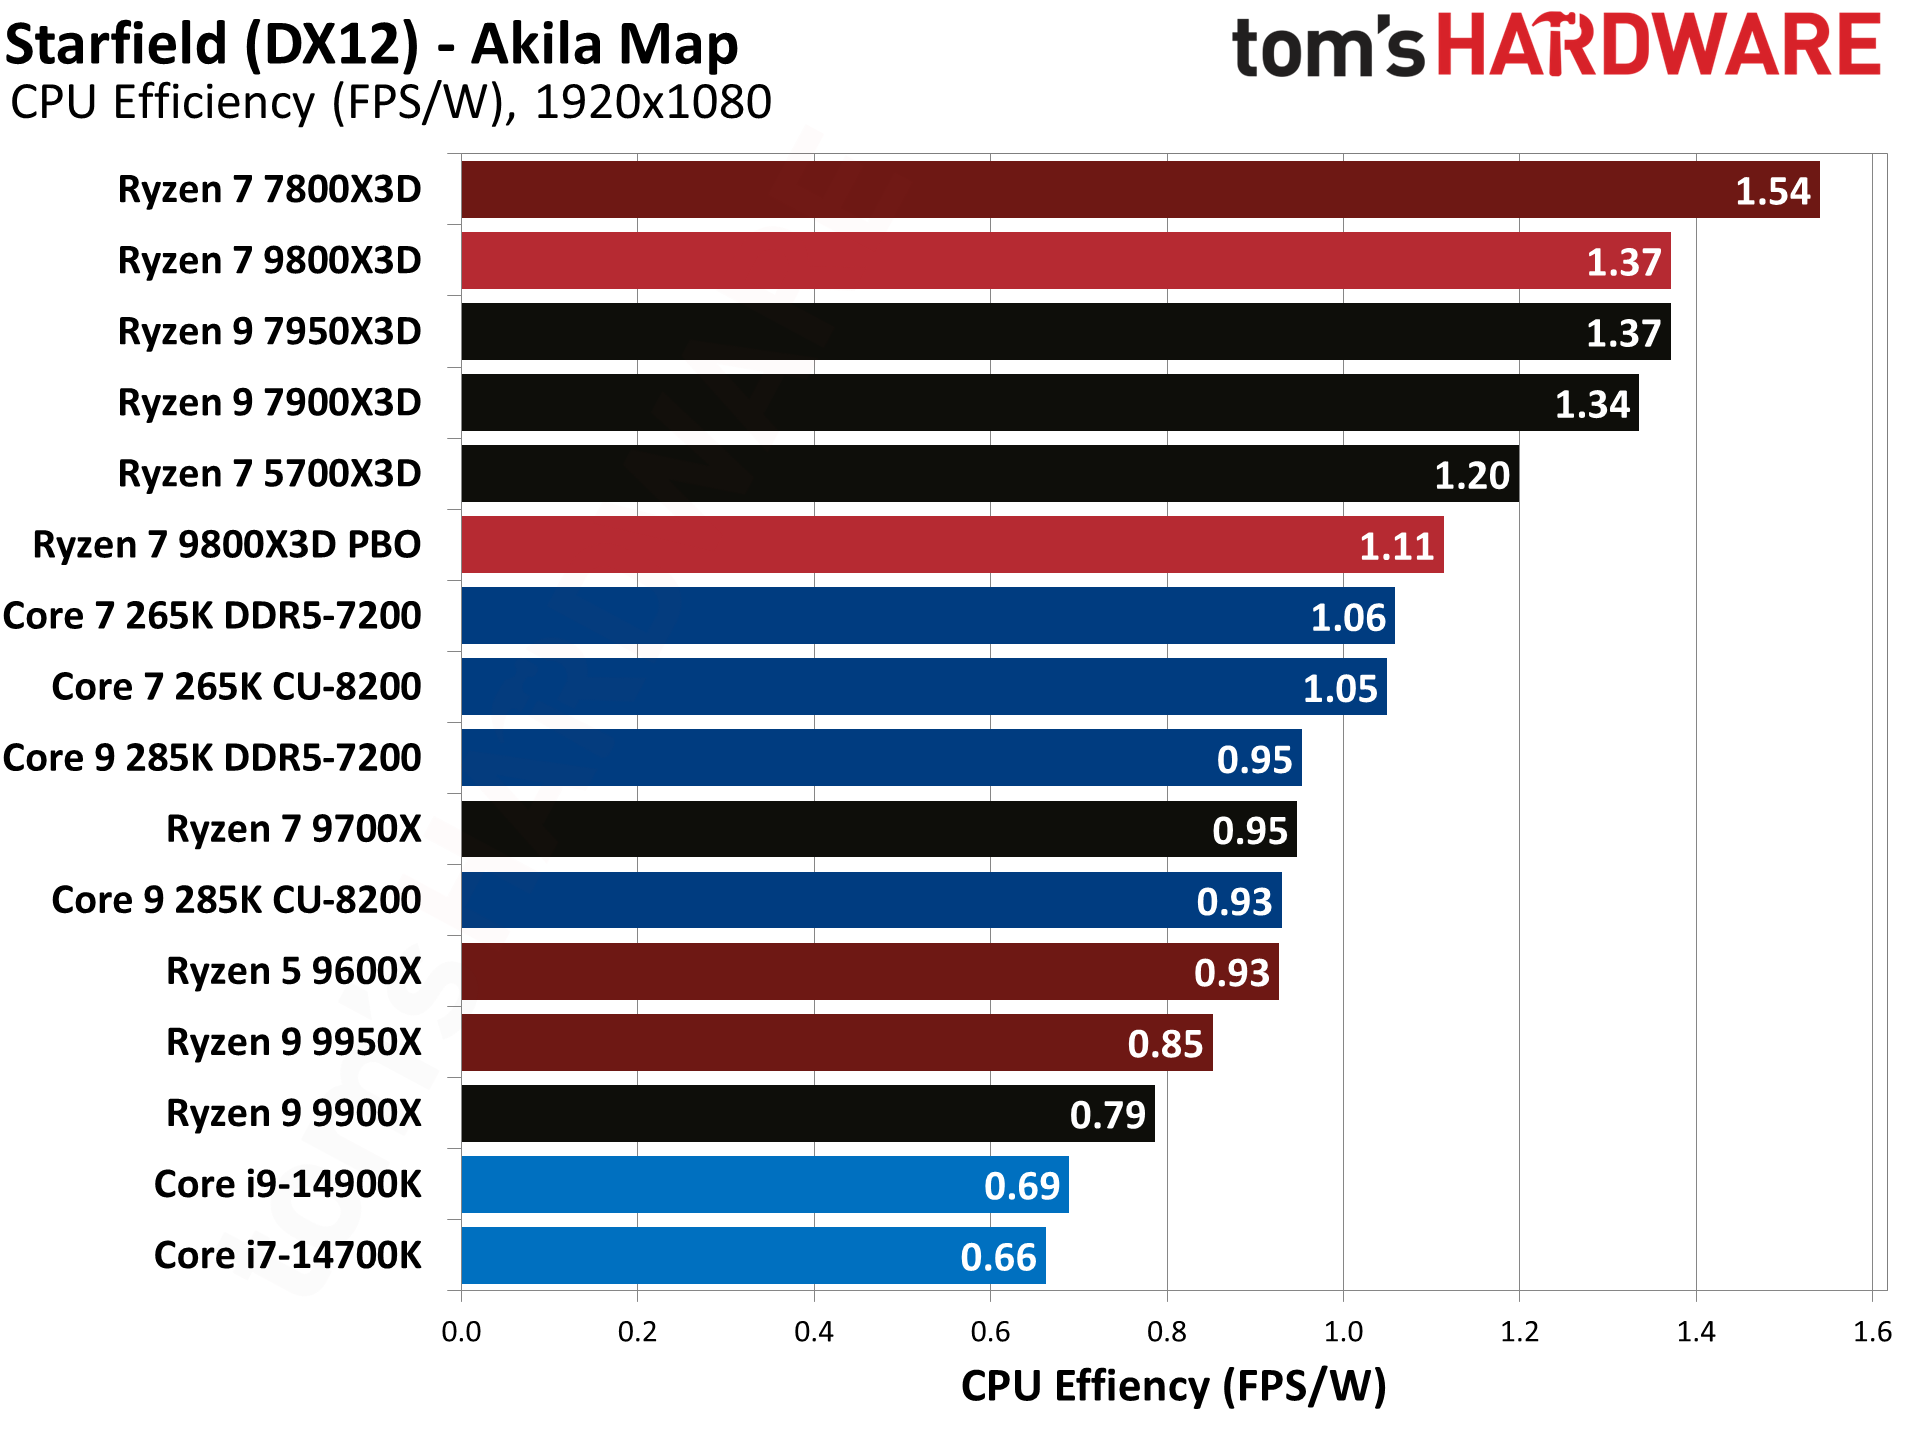
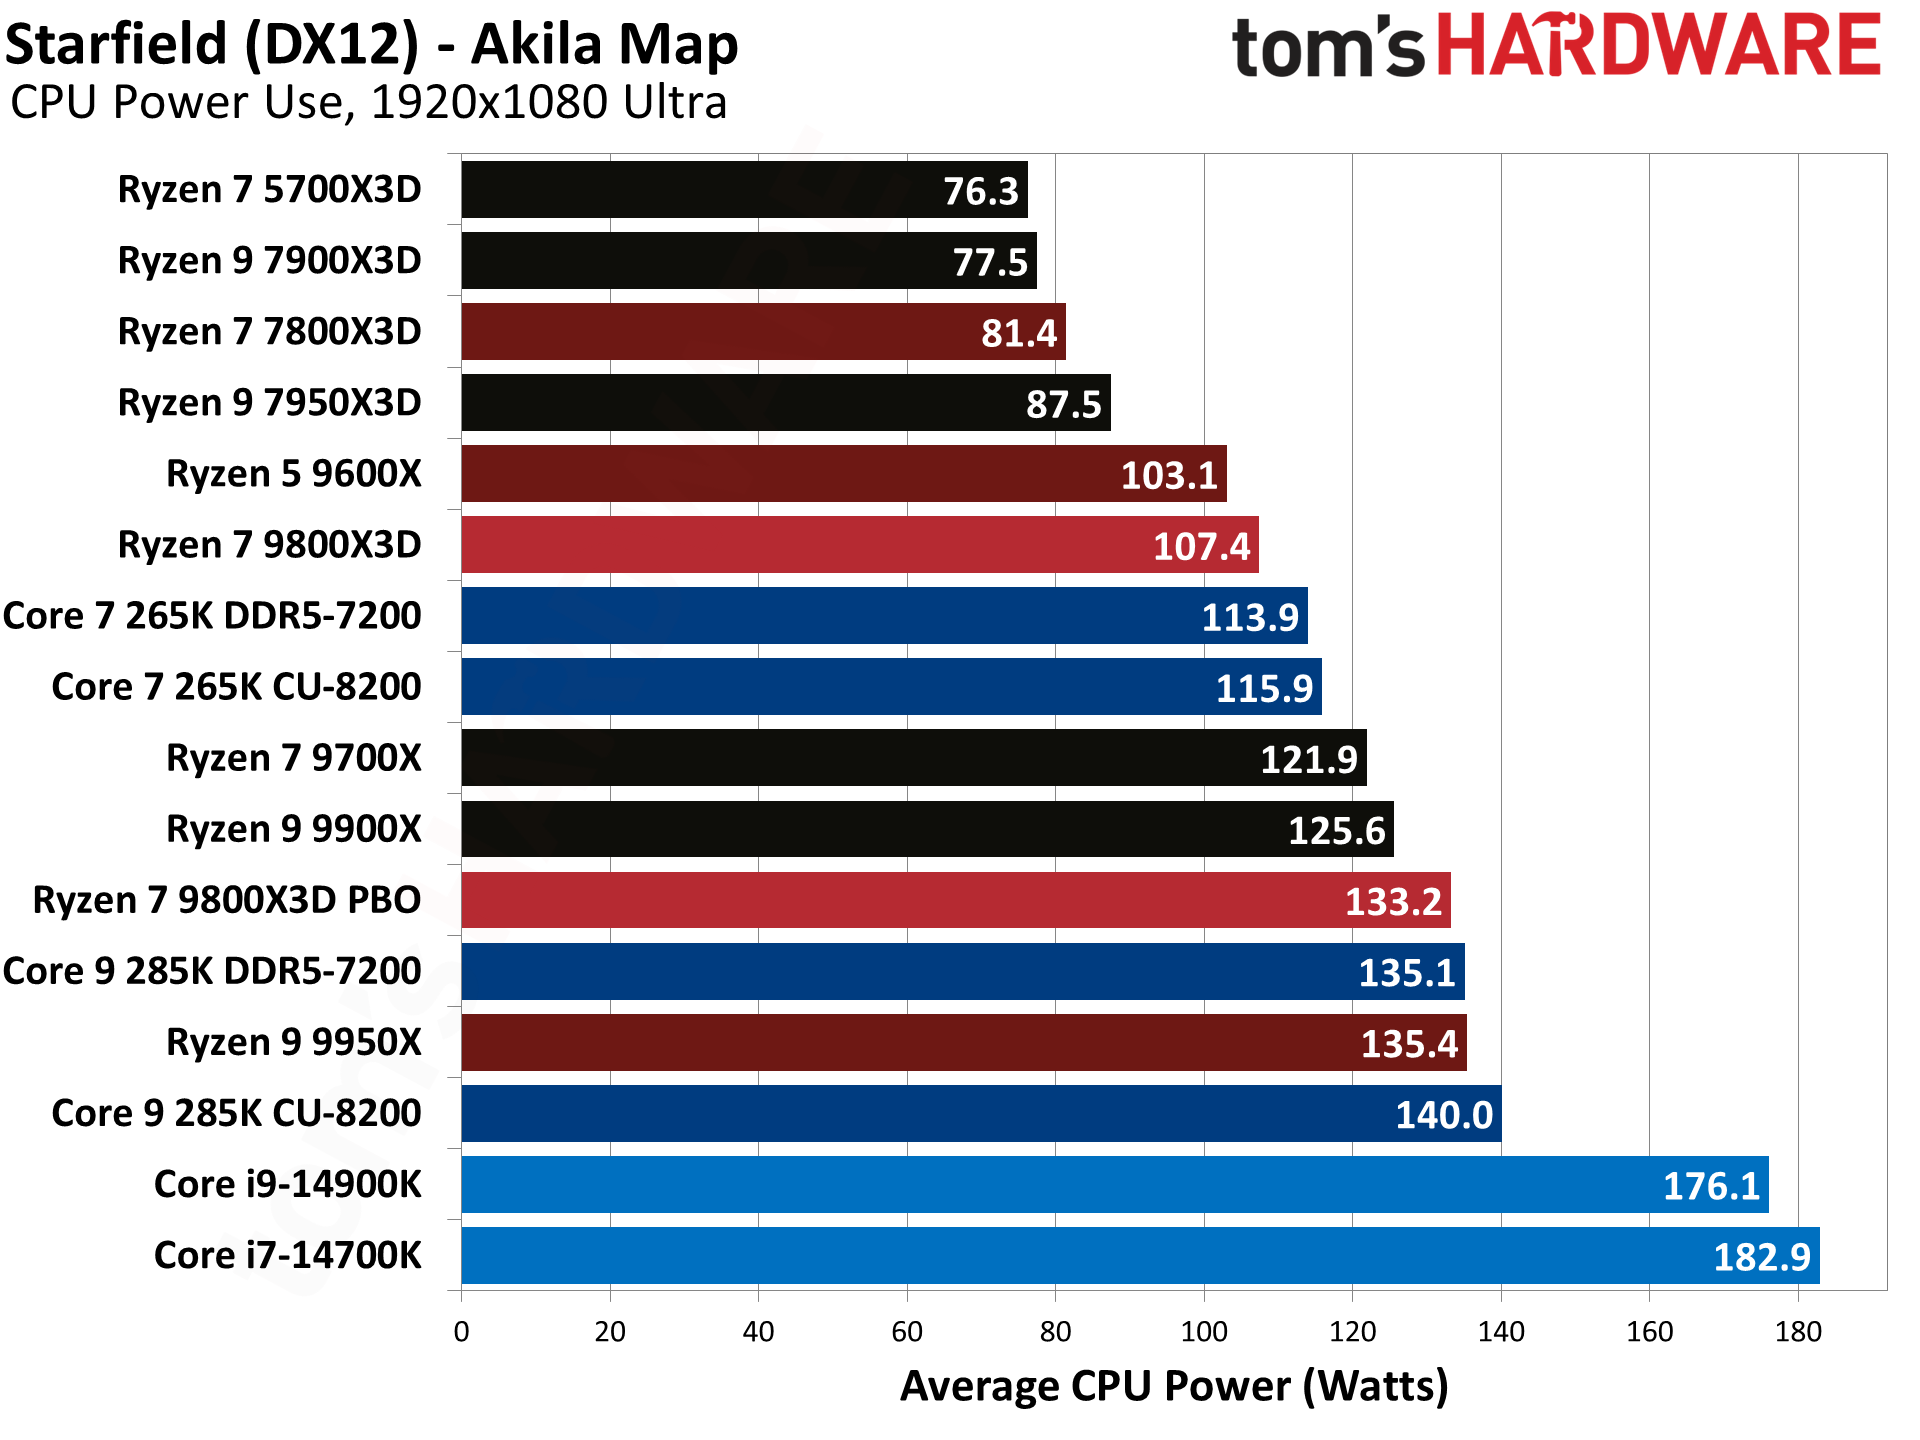
Starfield is another game that doesn't hate Arrow Lake, though the 9800X3D still wins by 13%. It's also 17.5% faster than the 7800X3D, and 21% faster than the 14900K.
Watch Dogs Legion Benchmarks — AMD Ryzen 7 9800X3D
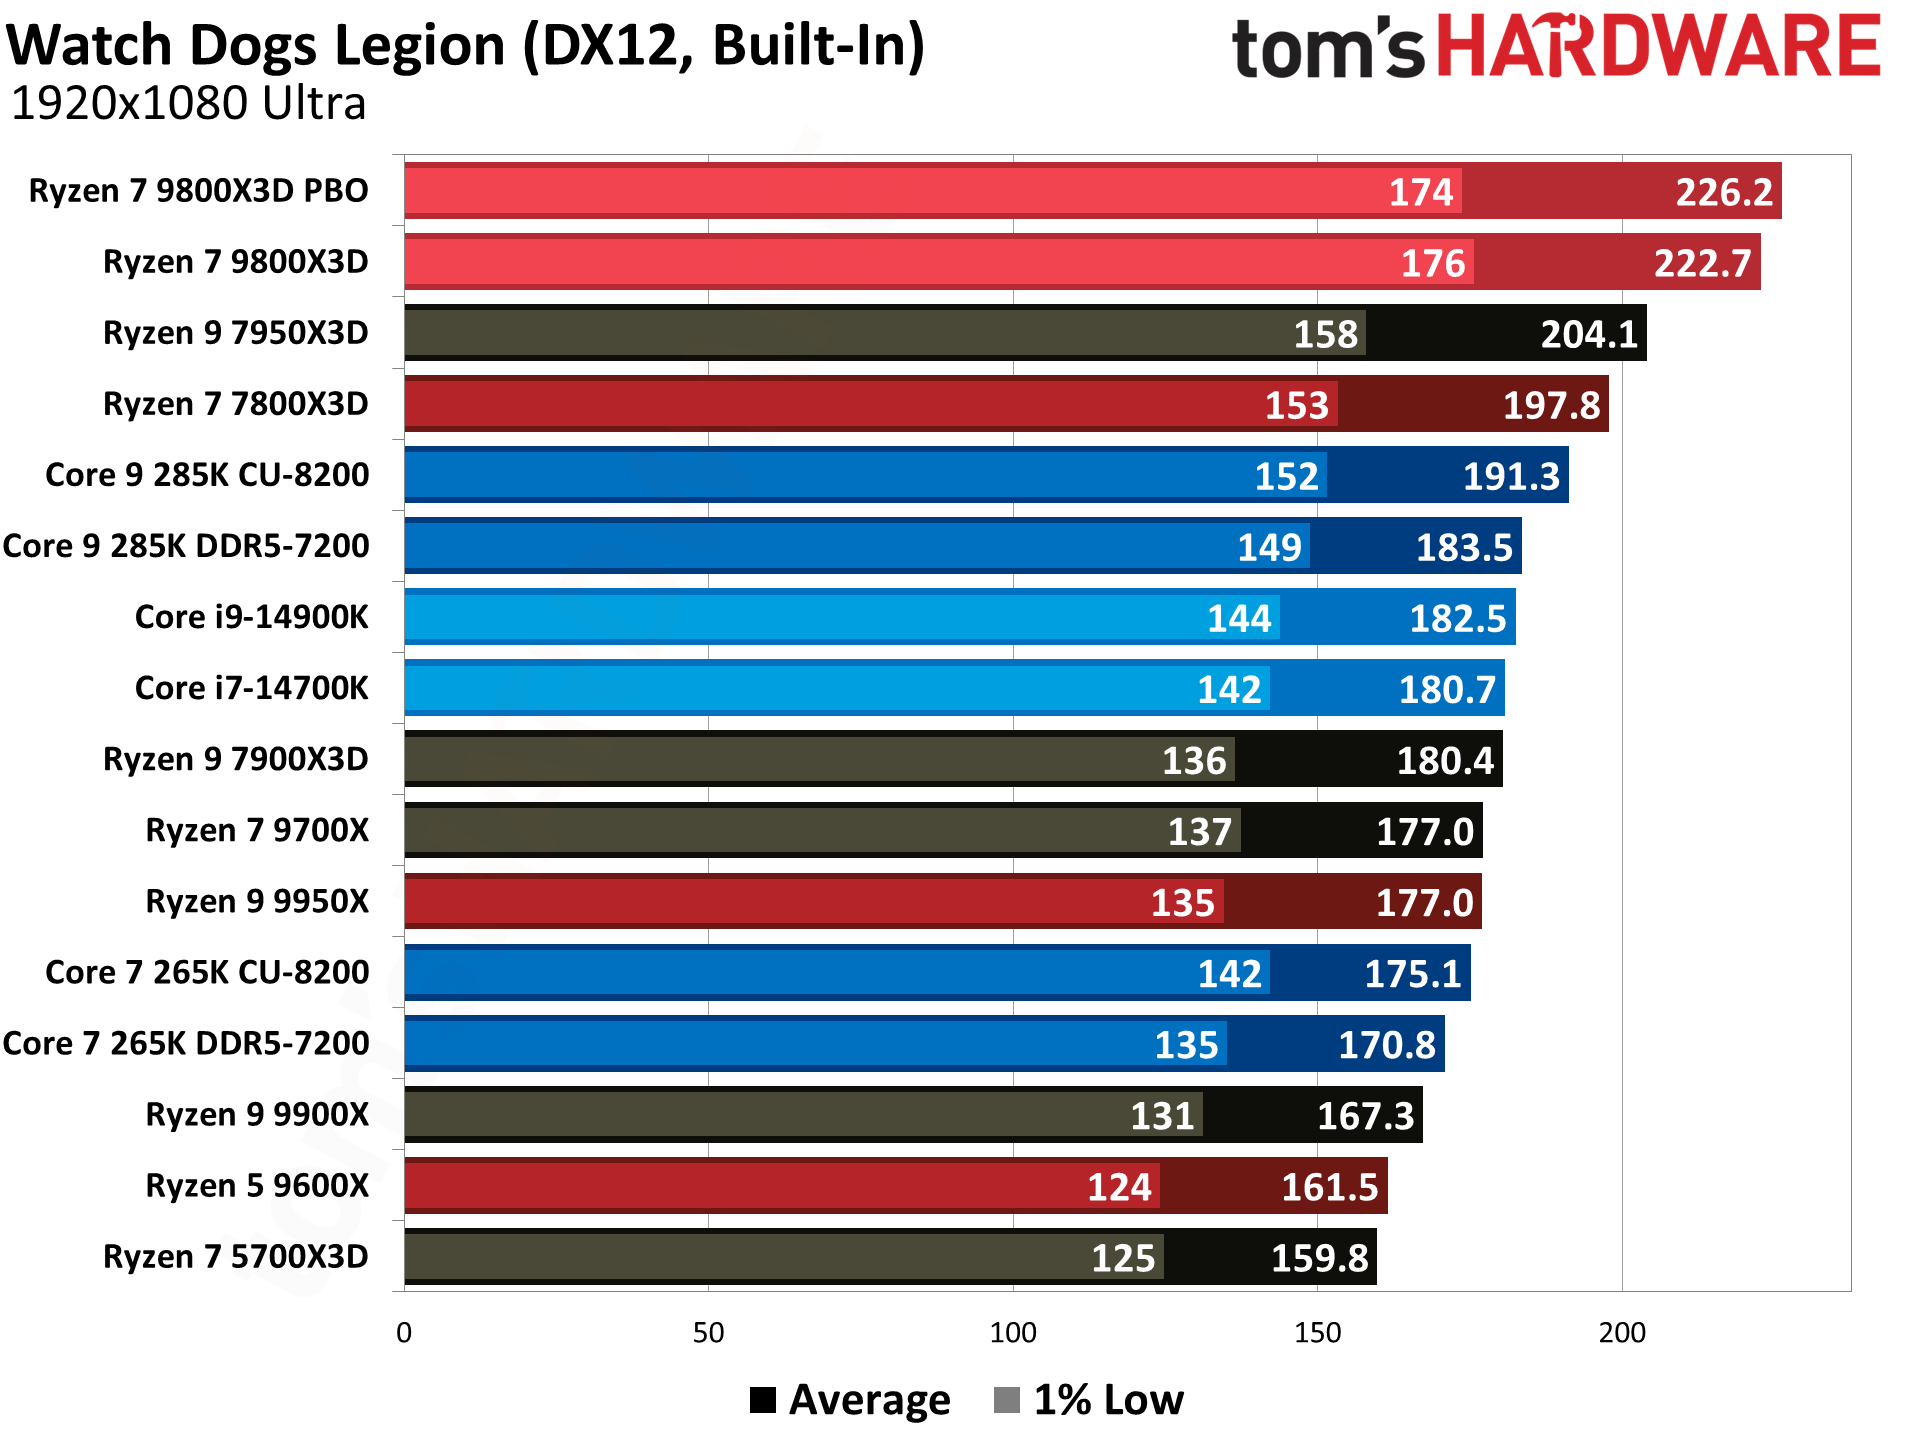
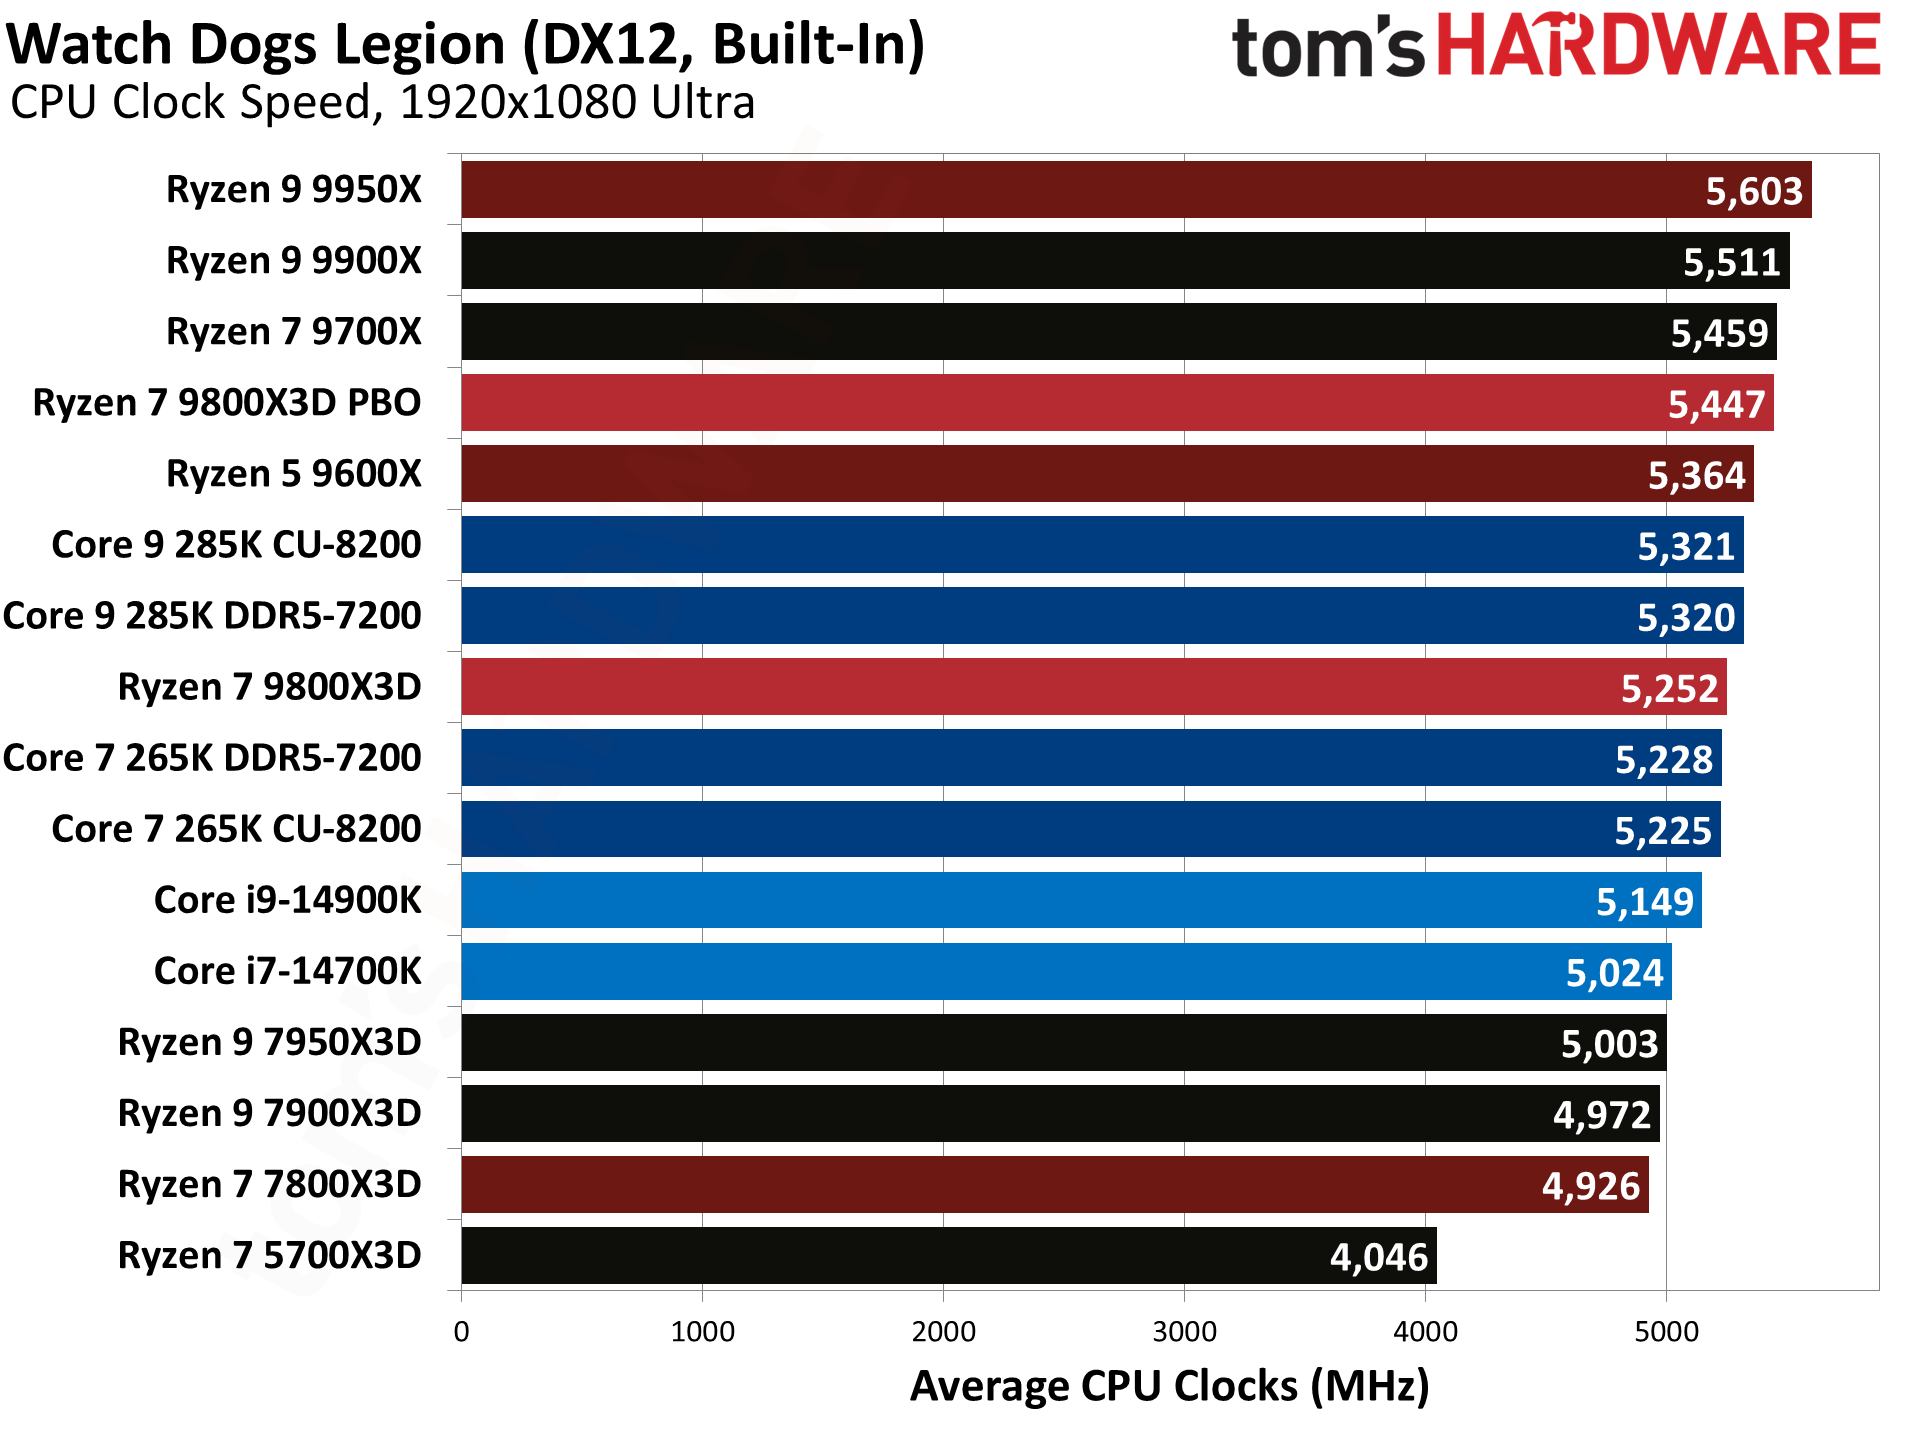
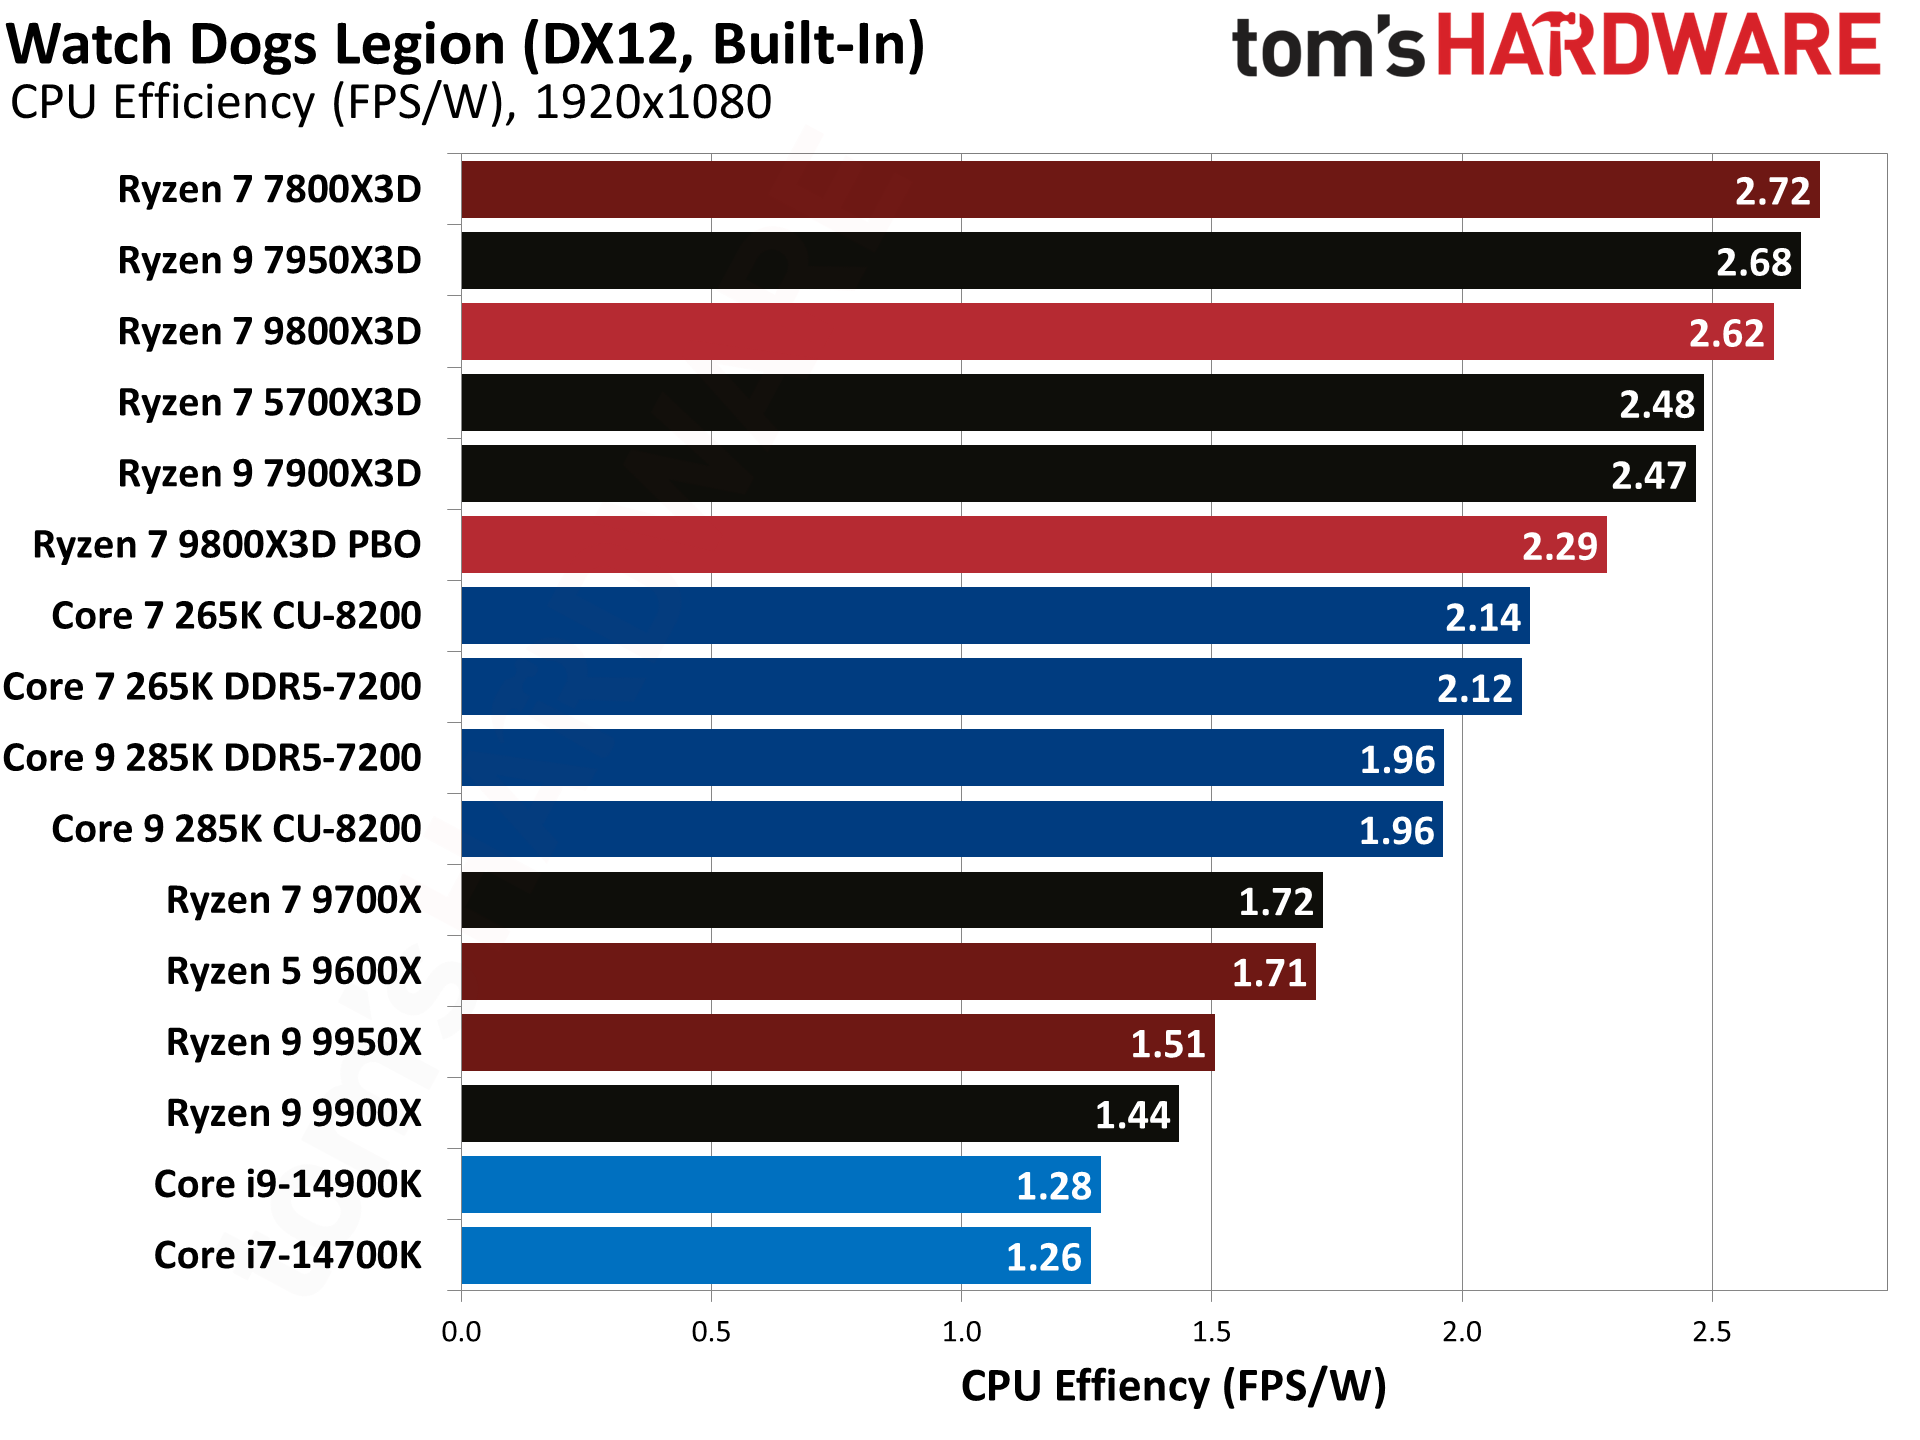
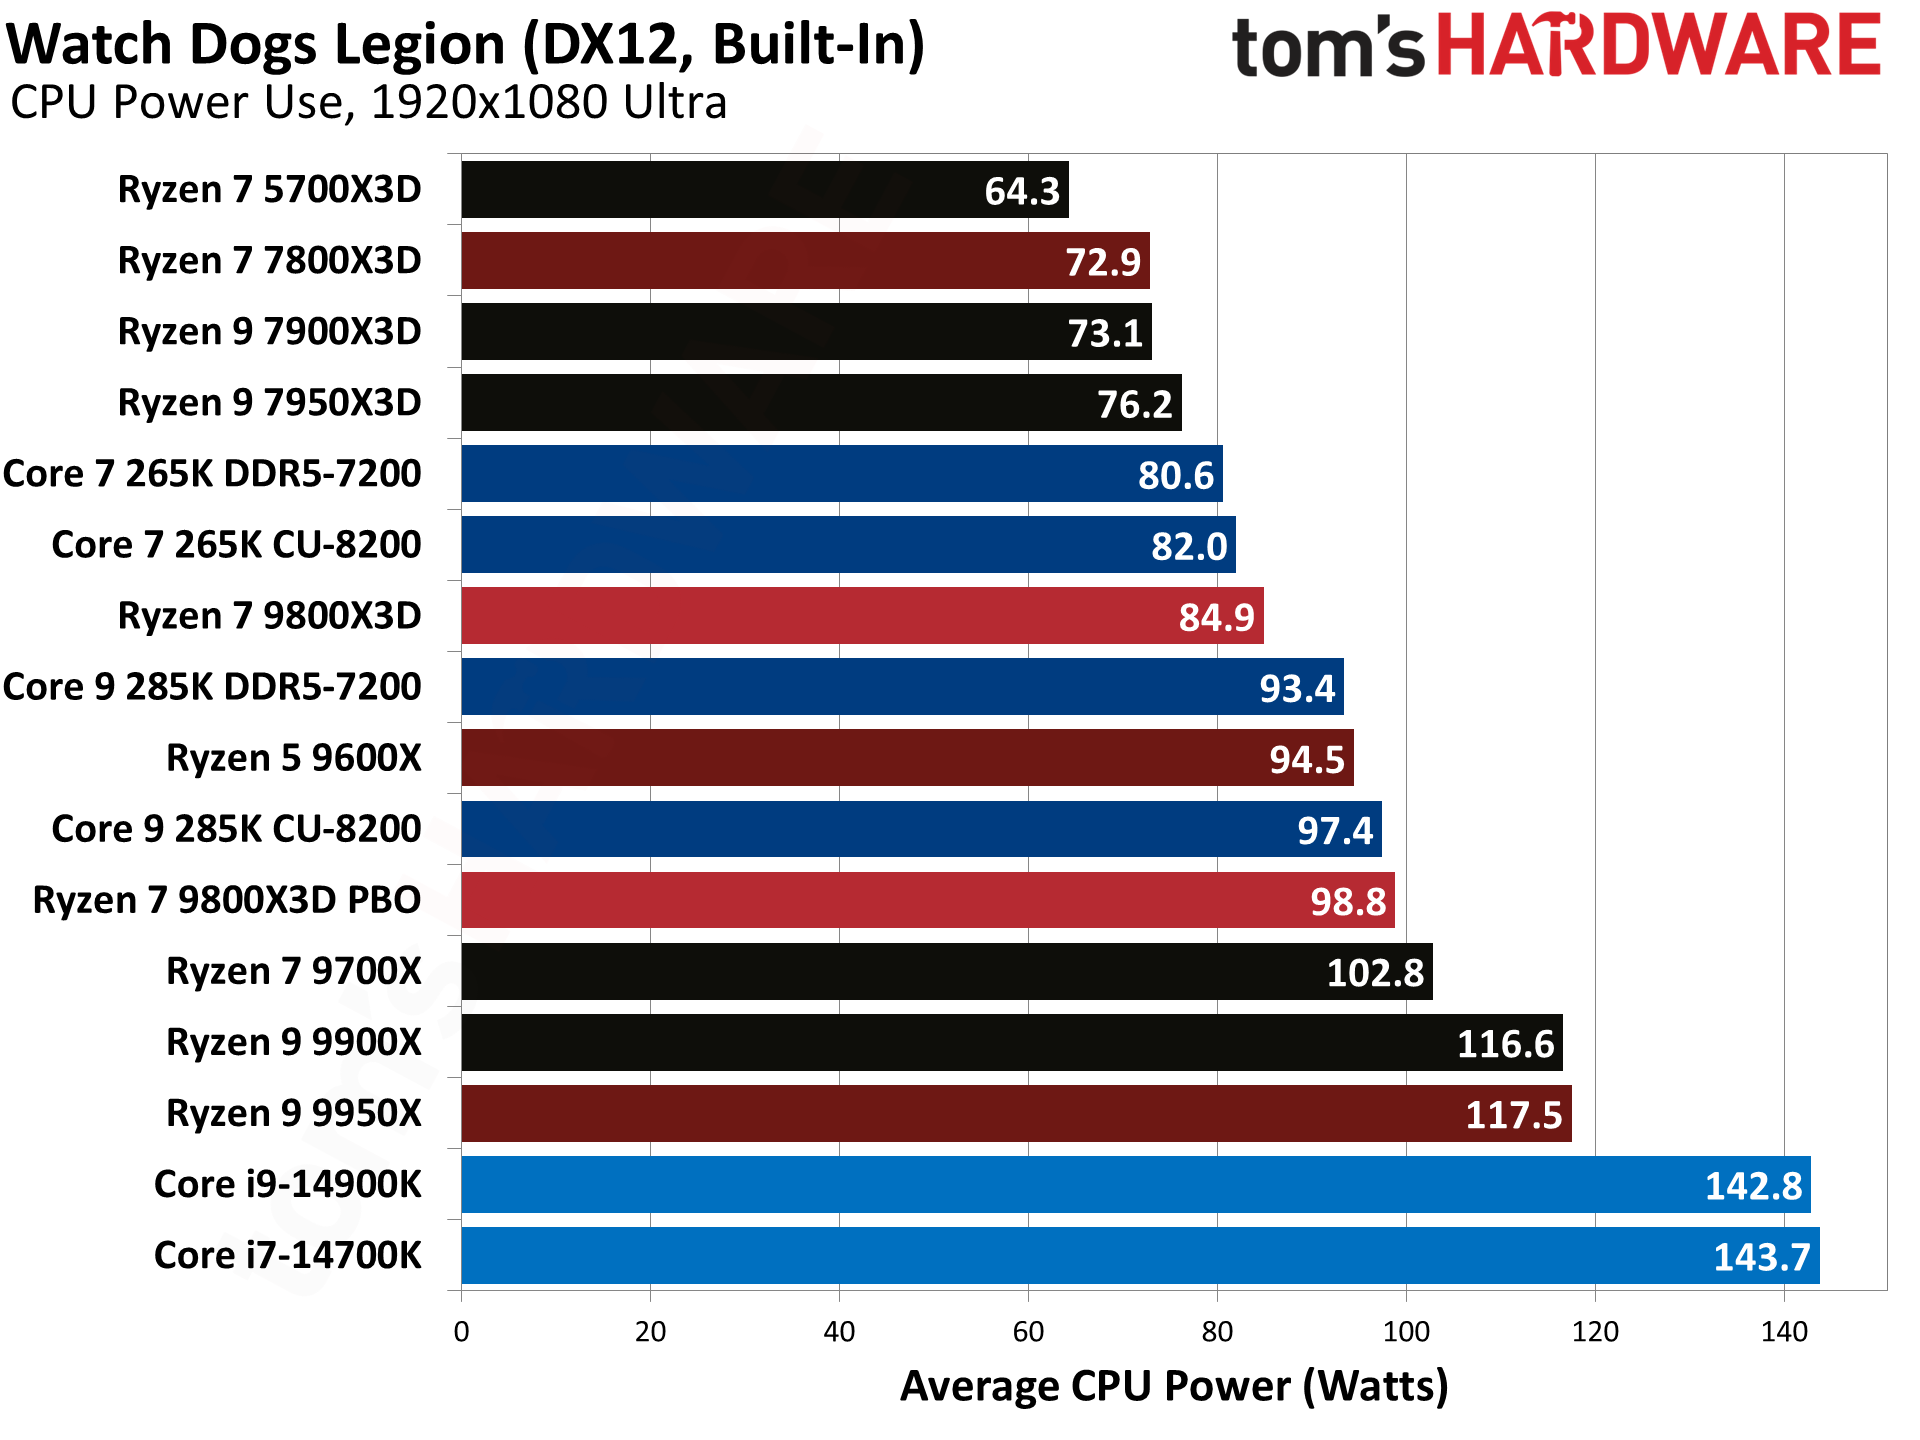
And we wrap up our gaming results with Watch Dogs Legion, where the 9800X3D lead over the 7800X3D sits at 12.6% — slightly below the geomean. AMD beats the 14900K by 22%, and the 285K by 16.4%, so this is one of the few other results where Arrow Lake comes out ahead of the 14900K.
AMD's Ryzen 7 9800X3D Gaming Benchmarks
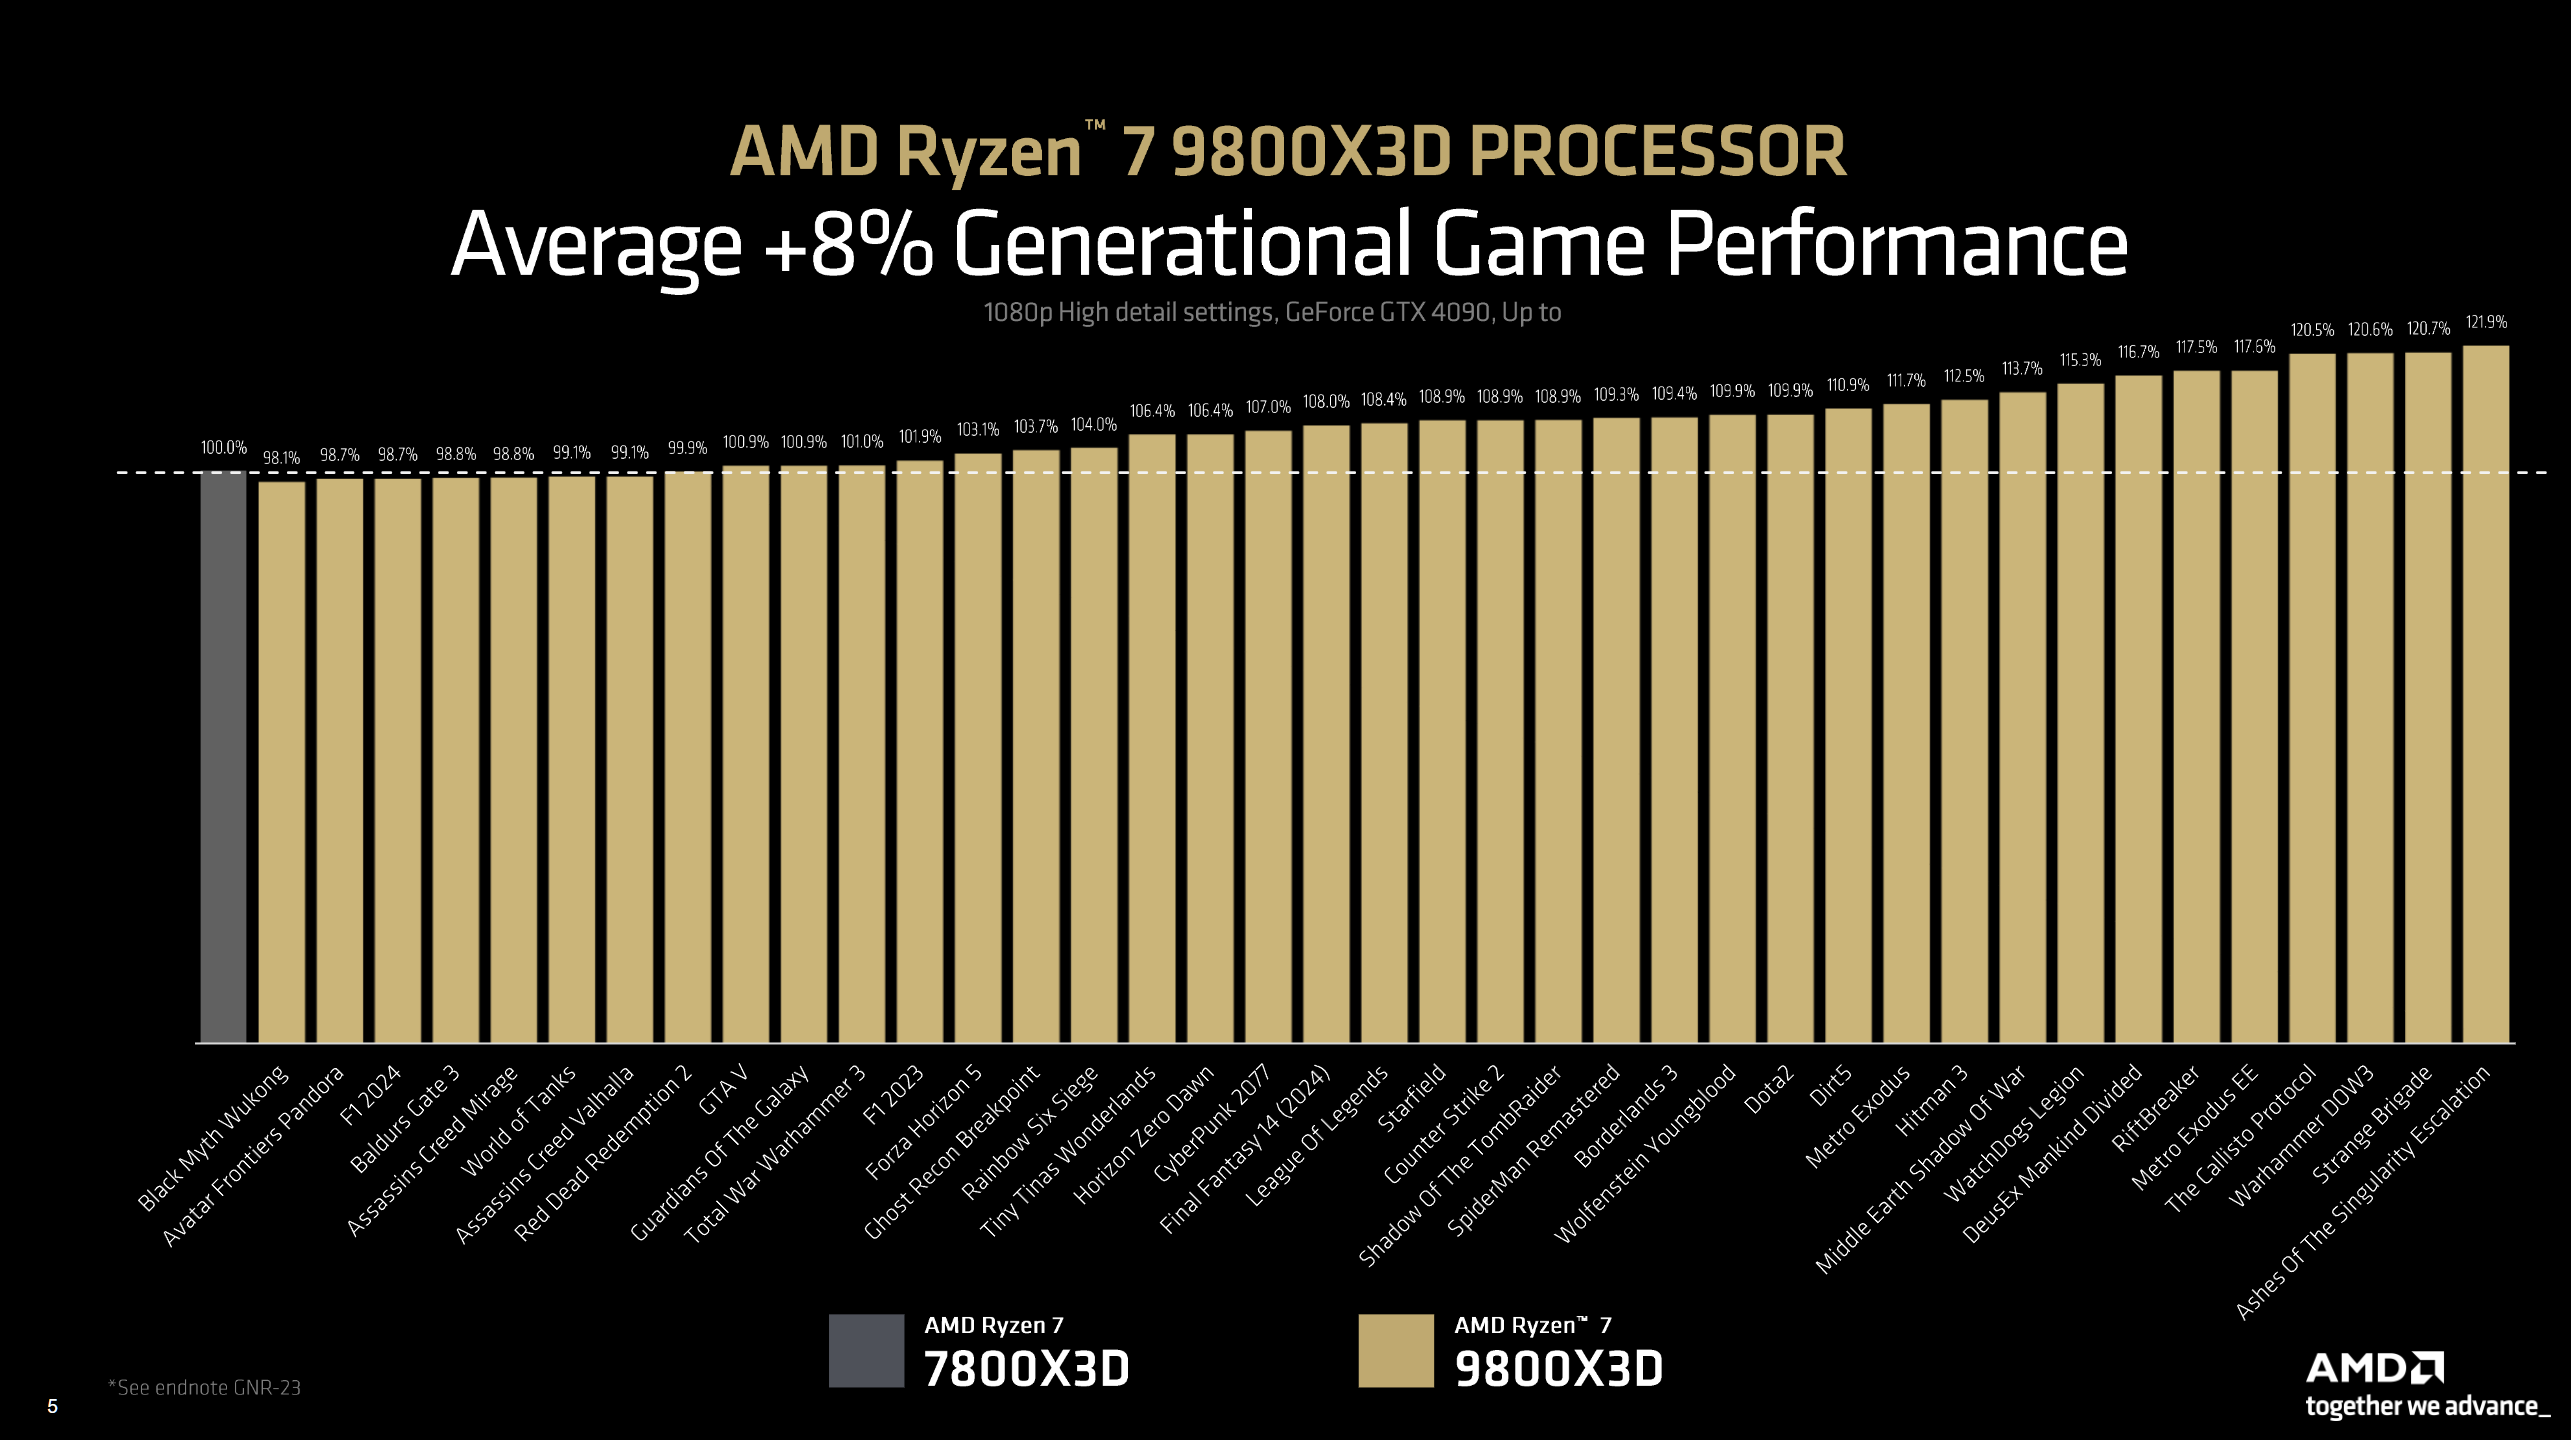
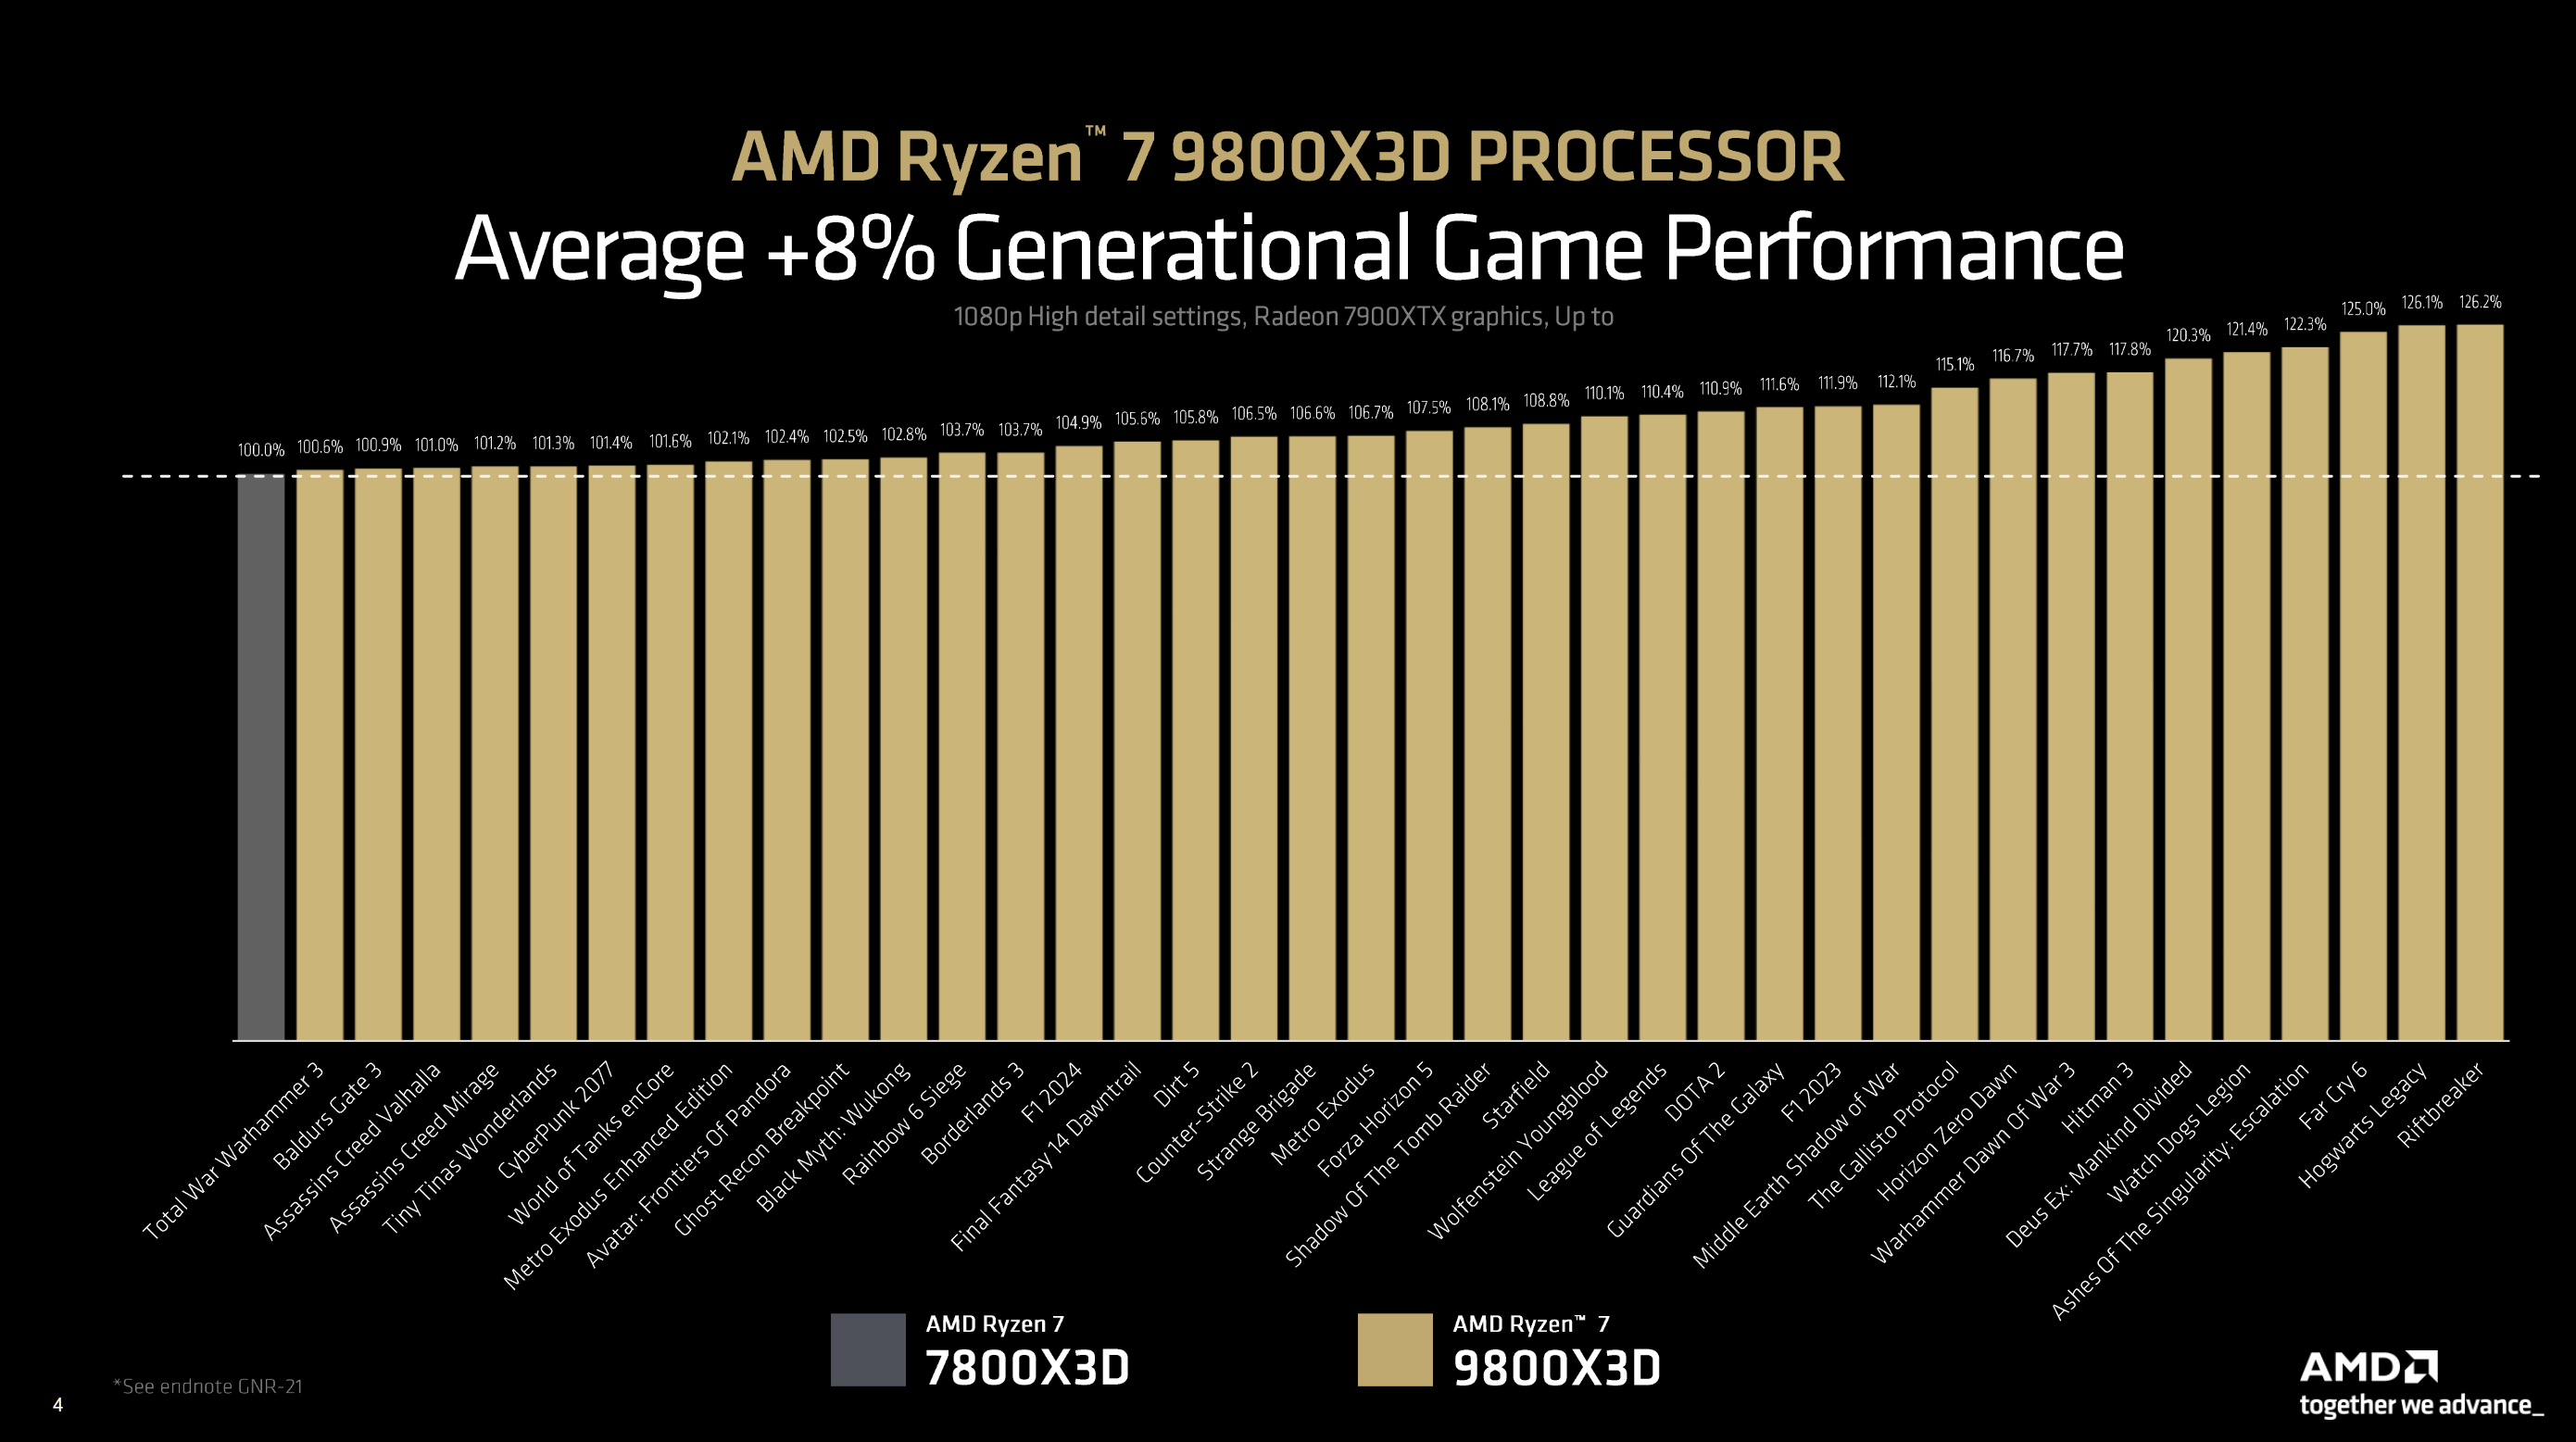
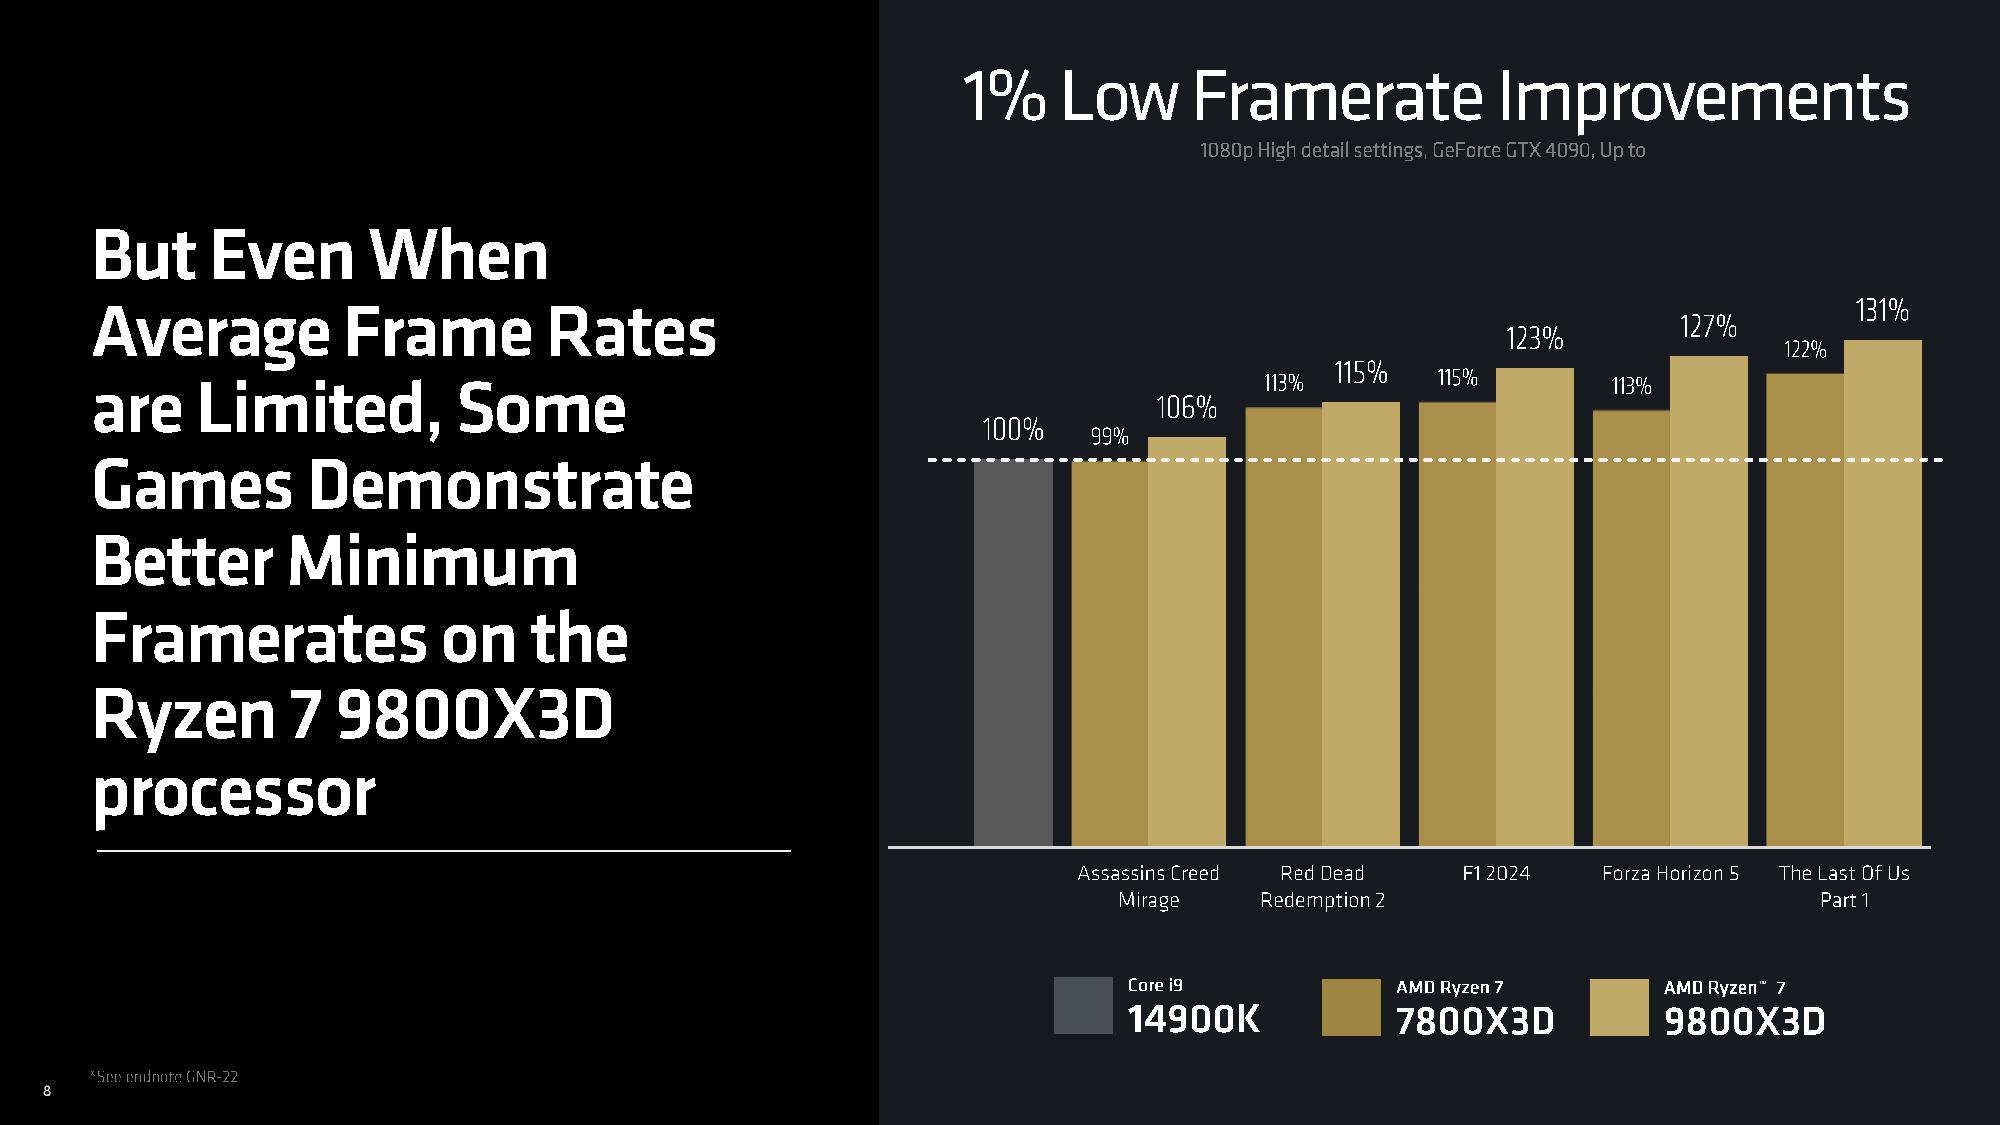
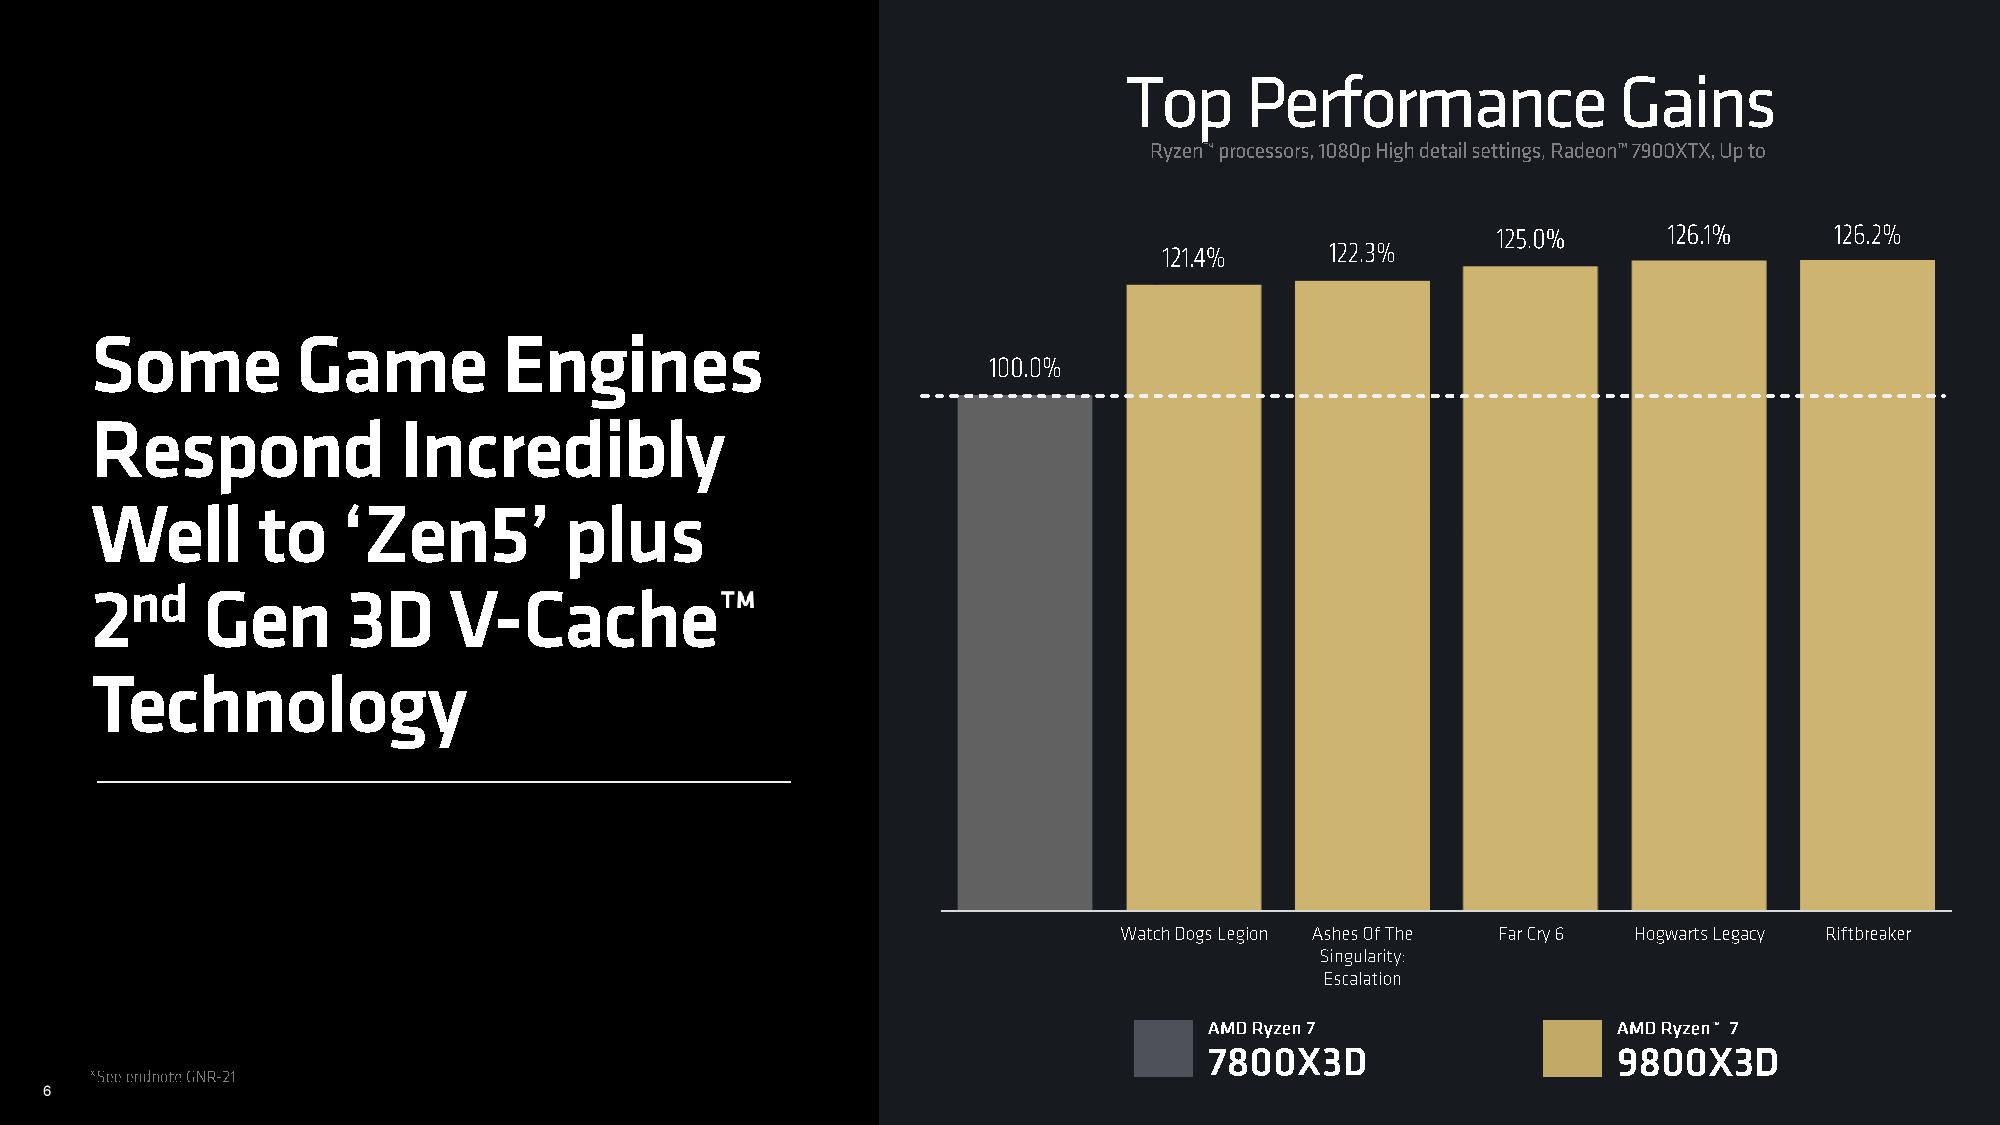
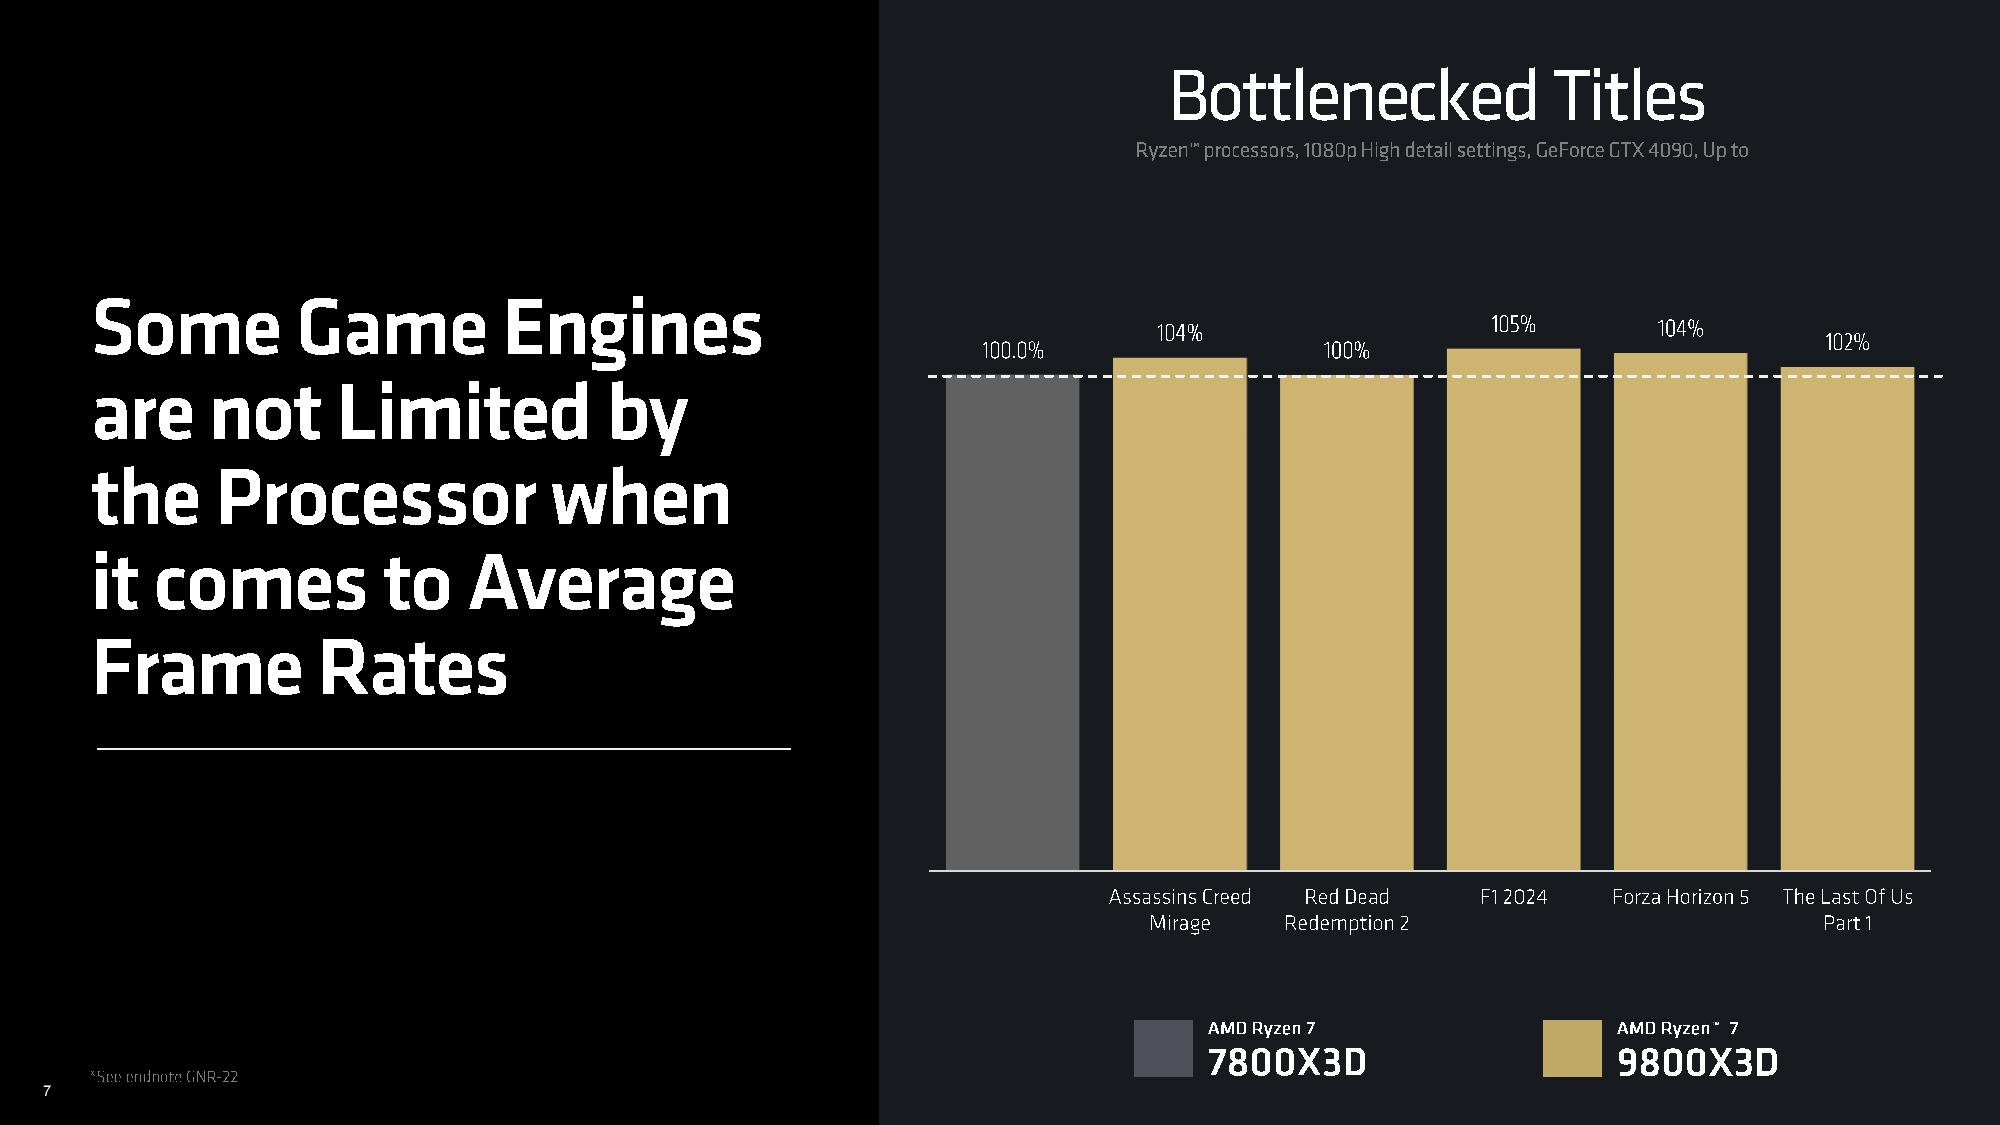
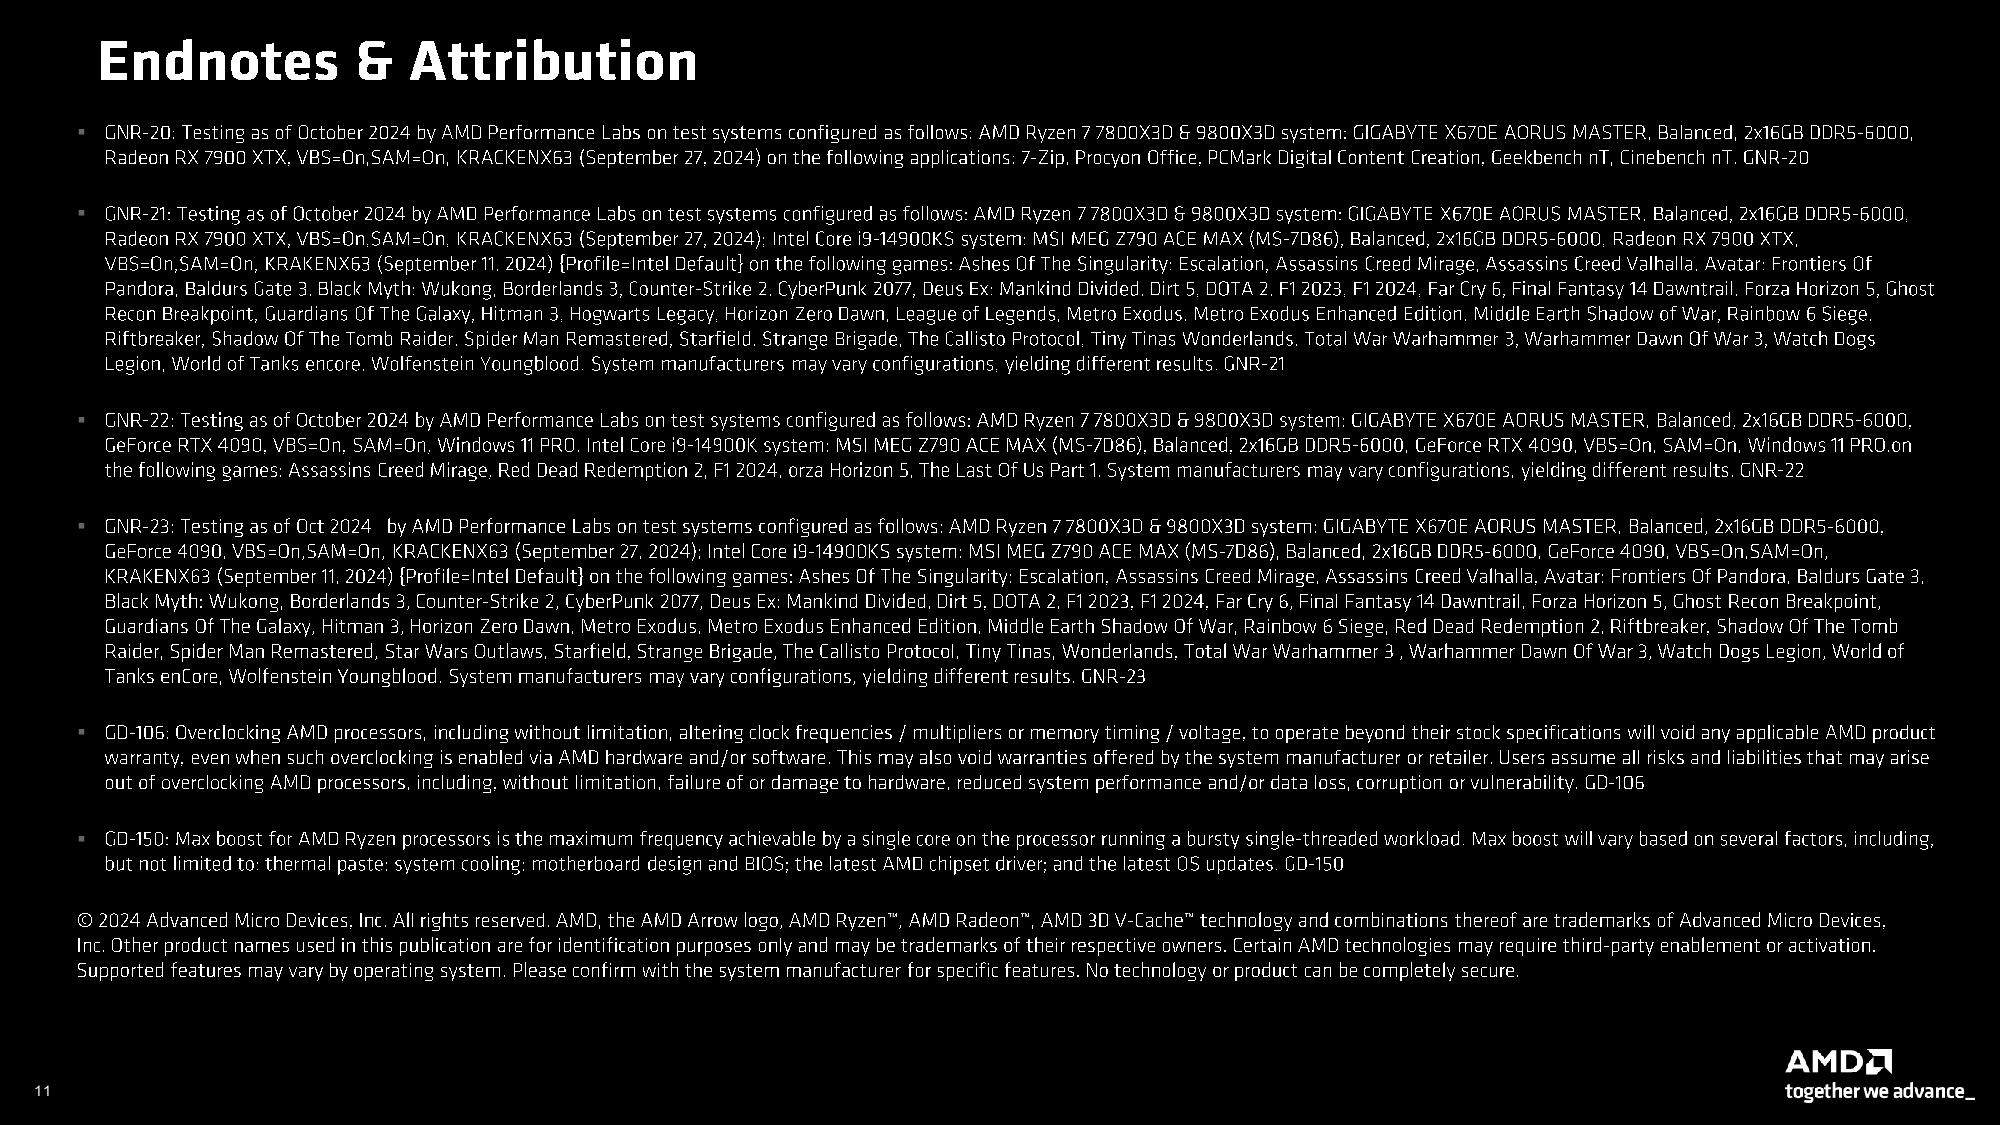
As mentioned, performance can vary based on the title. AMD shared its own benchmarks to highlight what you should expect in various titles. As with all vendor-provided performance data, view it with the appropriate skepticism. AMD's test notes are on the final slide.
- MORE: Best CPUs for Gaming
- MORE: CPU Benchmark Hierarchy
- MORE: AMD vs Intel
Current page: AMD Ryzen 7 9800X3D Gaming Benchmarks
Prev Page The Return of the Champ Next Page AMD Ryzen 7 9800X3D Productivity Benchmarks
Paul Alcorn is the Editor-in-Chief for Tom's Hardware US. He also writes news and reviews on CPUs, storage, and enterprise hardware.
-
-Fran- Thanks a lot for the review, Paul.Reply
Calling this a (gaming) bloodbath is being mild. Holy cow...
"How screwed is Intel after this?
Yes"
EDIT: Thanks Jarred for the YT side as well! I was thinking if you were going to do it again :D
Regards. -
ingtar33 christ, AMD really was understating how good a gaming cpu this was.Reply
what a beast. +30% fps gain going AMD x3D over intel. It's like 2012 all over again, only instead of intel styling on amd it's amd styling on intel. -
YSCCC Now this is seriously tempting for the gaming only PC for power usage and performance. and it isn't bad if occasionally do production usage eitherReply -
ingtar33 Reply
I think a 30% fps increase team red over blue would make it so that you'd need some serious productivity reasons to even consider intel at this point. furthermore the 9950x exists... and that will out perform intel in gaming as well (not by nearly as much but the productivity will be on par)YSCCC said:Now this is seriously tempting for the gaming only PC for power usage and performance. and it isn't bad if occasionally do production usage either -
Loadedaxe Currently there is no reason to buy Intel, even in productivity. It cost more and performs worse.Reply
Intel....its time to step up. Team Red is winning in everything! -
stuff and nonesense GN comes up with closer numbers 7800x3d vs 9800x3d but still significantly quicker. For gaming if you have the cash budget it’s pretty much the only sensible choice…Reply -
TheHerald Is there any chance of putting this into an ITX case with a tiny pure lock LP type of cooler or the increased power draw makes this a nogo? Kinda thinking of pulling the trigger.Reply -
dalek1234 Have we ever seen such a gaming performance uplift from one gen to the next in the past? I don't recall myself. This is one impressive CPU.Reply
So AMD does a +30% gaming performance improvement from one gen to the next, while Intel does a -5%. How times have changed.
