Why you can trust Tom's Hardware Our expert reviewers spend hours testing and comparing products and services so you can choose the best for you. Find out more about how we test.
Comparison Products
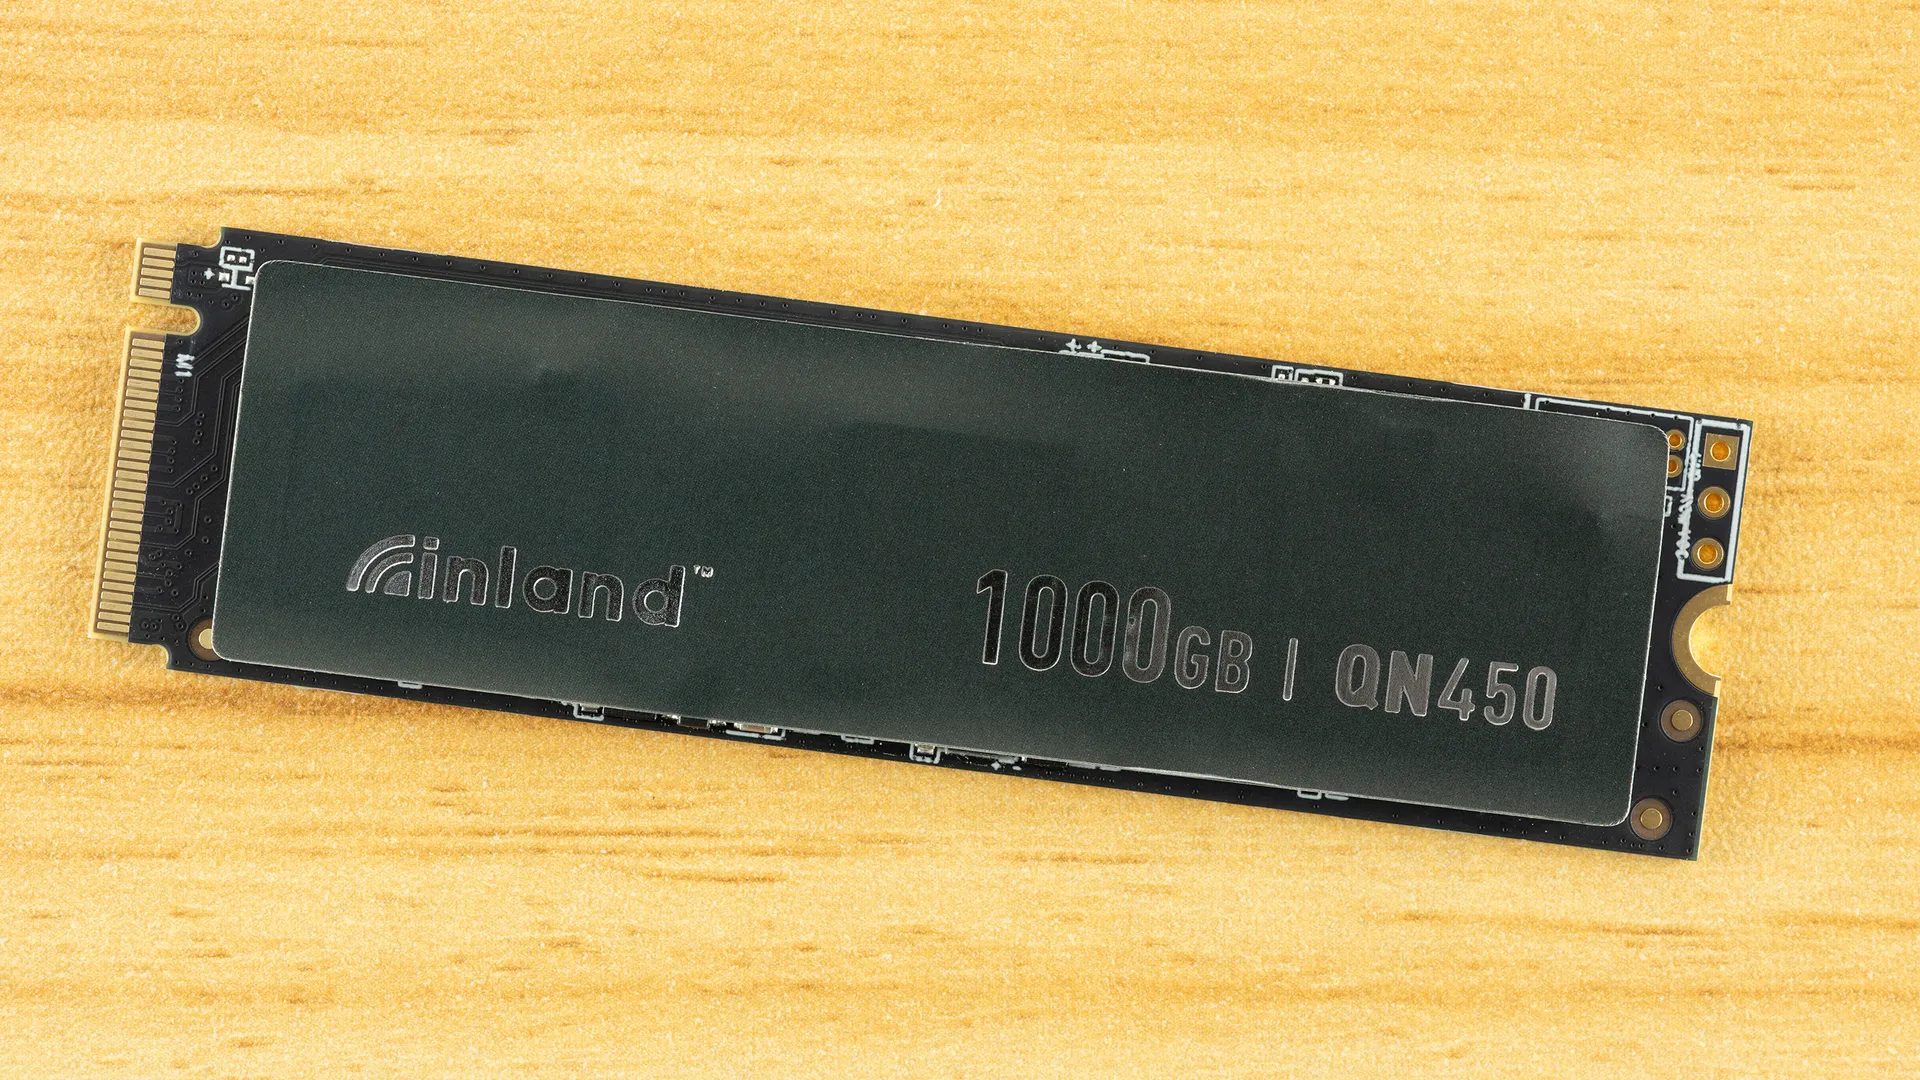
The Inland QN450 is in an interesting spot, ostensibly competing with products like the Kingston NV3 – a budget drive with variable hardware – in an increasingly difficult market. The QN450’s specifications are fairly paltry, but this might be the case to allow for hardware swapping to stay competitive. Our sample has very good hardware as it turns out, and as a result, the drive punches above its expected weight. It performs closer to fuller-performance drives like the TeamGroup MP44 and the QN450’s Inland stablemate, the Inland TN470. More common head-to-head competitors in its price range are the Biwin NV7200 and the TeamGroup MP44Q, which form a good baseline for performance expectations if this drive ends up with QLC flash. At the very top of this category are the Crucial P310, although this is no longer easy to find in its 2280 form factor, and the SanDisk WD Blue SN5100, two drives that redefined what a QLC drive can do.
Trace Testing — 3DMark Storage Benchmark
Built for gamers, 3DMark’s Storage Benchmark focuses on real-world gaming performance. Each round in this benchmark stresses storage based on gaming activities, including loading games, saving progress, installing game files, and recording gameplay video streams. Future gaming benchmarks will be DirectStorage-inclusive, and an evaluation for future-proofing is included where applicable.


,The QN450 scores excellently in 3DMark, coming in near the top with 41µs latency. Anything at or under 45µs is good in our book. It matches the TN470 almost exactly in this test which, considering the TN470 is the higher SKU – “T” over “Q” and 470 over 450 – is good news. It would make an excellent gaming drive.
Trace Testing — PCMark 10 Storage Benchmark
PCMark 10 is an industry-standard trace-based benchmark that uses a wide-ranging set of real-world traces from popular applications and everyday tasks to measure the performance of storage devices. The results are particularly useful when analyzing drives for their use as primary/boot storage devices and in work environments.


Much of what you do on your PC is bursty in nature. You load an application, then it sits idle in the background for long periods of time. Context switching can often be pulled from cached RAM. So you only really notice the initial load time when judging the feel, and even relatively low-end SSDs are plenty fast enough to often not be the perceptible bottleneck. Digging into heavy apps for content creation can be a different story, but that’s mostly with fuller drives and sustained workloads, especially writes. If you’re not doing that, then the QN450 looks pretty darn good here.
Would it hold up under heavier usage? Most likely, yes, especially after our look at sustained write performance, but this is not the drive an enthusiast would be picking for such workloads. For everyday OS and application use, this drive is amazing and all that you need.
Console Testing — PlayStation 5 Transfers
The PlayStation 5 is capable of taking one additional PCIe 4.0 or faster SSD for extra game storage. While any 4.0 drive will technically work, Sony recommends drives that can deliver at least 5,500 MB/s of sequential read bandwidth for optimal performance. Based on our extensive testing, PCIe 5.0 SSDs don’t bring much to the table and generally shouldn’t be used in the PS5, especially as they may require additional cooling. Check our Best PS5 SSDs article for more information.
Our testing utilizes the PS5’s internal storage test and manual read/write tests with over 192GB of data both from and to the internal storage. Throttling is prevented where possible to see how each drive operates under ideal conditions. While game load times should not deviate much from drive to drive, our results can indicate which drives may be more responsive in long-term use.


The QN450 is also an excellent drive for the PS5. This console doesn’t need a whole lot, but having a drive that delivers a consistent experience can be important. The QN450’s hardware is pretty much perfect for this. It’s not using an older controller or older flash like many budget options. Those can be slower in some circumstances and less reliable in general. Is this the fastest option? No, but it’s fast enough, and you can install it and not worry about missing out.
Transfer Rates — DiskBench
We use the DiskBench storage benchmarking tool to test file transfer performance with a custom 50GB dataset. We write 31,227 files of various types, such as pictures, PDFs, and videos, to the test drive, then make a copy of that data to a new folder, and follow up with a reading test of a newly-written 6.5GB zip file. This is a real-world type workload that fits into the cache of most drives.


Transfer performance is weaker but this is not unexpected. The QN450 is not rated for full PCIe 4.0 bandwidth which limits its peak copy rate. It’s still pretty fast and it beats the NV3, which is probably all we need to say about it. It’s NV3-positioned but has lower specs, yet it beats it in a bandwidth-driven test. This is a good secondary drive, plain and simple.
Synthetic Testing — ATTO / CrystalDiskMark
ATTO and CrystalDiskMark (CDM) are free and easy-to-use storage benchmarking tools that SSD vendors commonly use to assign performance specifications to their products. Both of these tools give us insight into how each device handles different file sizes and at different queue depths for both sequential and random workloads.


A drive with low sequential specifications is usually going to suffer in ATTO. It comes as no surprise that the QN450 does. We’re most concerned with the drop in read performance at some popular block sizes – 128KiB specifically – but for the most part, this is not a dealbreaker. It still matches or beats the NV3 in QD1 sequential reads and writes in CrystalDiskMark. That’s its target competitor, and QD1 reads in particular can be indicative of real-world performance. That said, its relatively low read score means it’s not able to stand up against high-end drives like the MP44. The good news is, the drive has fantastic random read latency, which probably makes up for all of this. It’s going to feel very responsive for most things to the point that its potentially slower transfers aren't going to make it feel like you gave something up by going with a budget drive.
Sustained Write Performance and Cache Recovery
Official write specifications are only part of the performance picture. Most SSDs implement a write cache, which is a fast area of pseudo-SLC (single-bit) programmed flash that absorbs incoming data. Sustained write speeds can suffer tremendously once the workload spills outside of the cache and into the "native" TLC (three-bit) or QLC (four-bit) flash. Performance can suffer even more if the drive is forced to fold, the process of migrating data out of the cache to free up space for further incoming data.
We use Iometer to hammer the SSD with sequential writes for 15 minutes to measure both the size of the write cache and performance after the cache is saturated. We also monitor cache recovery via multiple idle rounds. This process shows the performance of the drive in various states, including the steady-state write performance.


Drives will usually have three distinct states when handling writes, although it would be more accurate to say that a drive’s response is determined by three different aspects of handling writes. Modern drives can shift flash from its native three- or four-bit mode to a single-bit, pSLC mode, or cache, to achieve very high write speeds. Because space is more limited in that mode and the writes are faster, the cache can quickly run out. The drive can then write to its much slower native mode, but it’s unable to fully keep up with writes because it has to free up space in the background by copying already-written data over. If this is the primary bottleneck, the drive becomes even slower, and performance can suffer greatly due to higher latency. For our testing, we would refer to these larger states as pSLC caching, native flash writing, and folding. The reason we say “aspects” above is that these states are not exclusive – a drive can and will shift between states, for example, jumping back up to pSLC speeds in the latter two modes. It’s just easier to visualize as three distinct states.
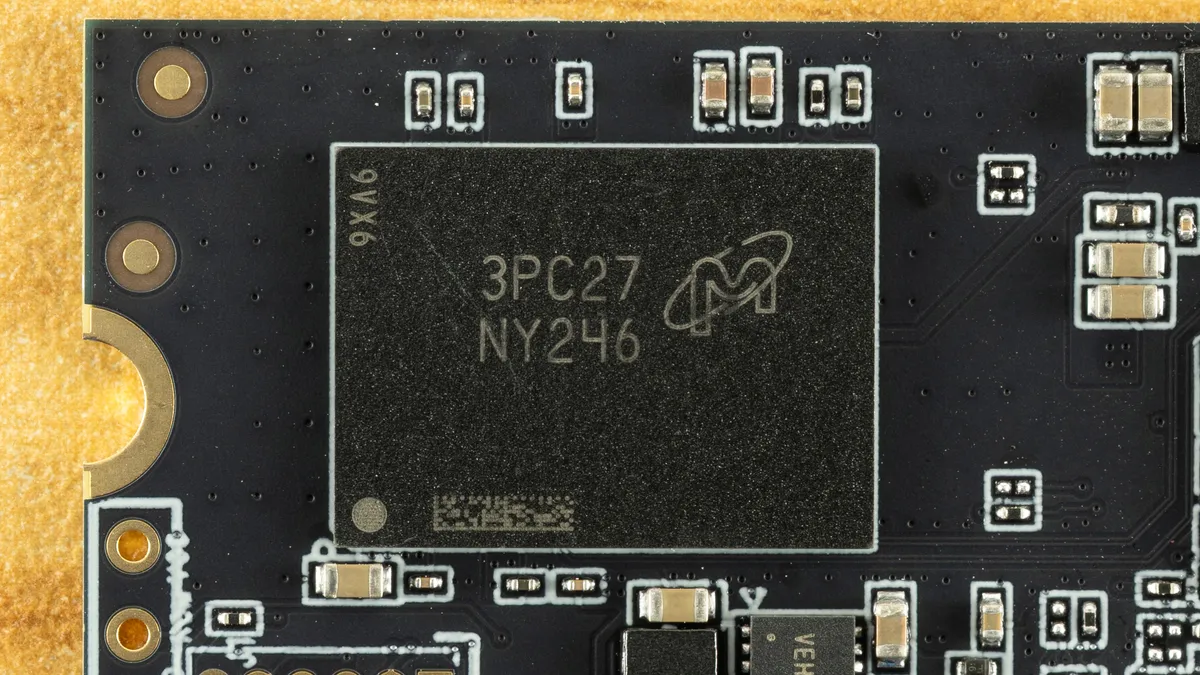
For the first state, the QN450 writes at over 6.3 GB/s for over 47 seconds. The cache is approximately 300GB, which is impossible with QLC flash – this would be over 1200GB of native flash – but well within the means for 3-bit TLC. There is, in fact, enough native flash left over to keep this drive from hitting a wall. It can achieve around 940 MB/s in the direct-to-TLC mode before eventually settling into folding at ~630 MB/s. This is a pretty good result for a drive in this class with such a large cache. Performance is pretty steady on the whole, actually. It would not be our first choice for a workhorse drive, especially with the relatively low TBW, but it can definitely beat QLC-based drives.
Power Consumption and Temperature
We use the Quarch HD Programmable Power Module to gain a deeper understanding of power characteristics. Idle power consumption is an important aspect to consider, especially if you're looking for a laptop upgrade, as even the best ultrabooks can have mediocre stock storage in terms of capacity and performance. Desktops are often more performance-oriented with less support for power-saving features, so we show the worst-case scenario for idle.
Some SSDs can consume watts of power at idle while better-suited ones sip just milliwatts. Average workload power consumption and max consumption are two other aspects of power consumption, but performance-per-watt, or efficiency, is more important. A drive might consume more power during any given workload, but accomplishing a task faster allows the drive to drop into an idle state more quickly, ultimately saving energy.
For temperature recording, we currently poll the drive’s primary composite sensor during testing with a ~22°C ambient. Our testing is rigorous enough to heat the drive to a realistic ceiling temperature, but real-world temperatures will vary due to the environment and workload factors.


Looking for an efficient drive for your laptop? Look no further. The QN450 is exceptional with minimal power draw. It’s the most efficient drive on the list and one of the most efficient drives we’ve ever tested. It’s more than 10% more efficient than the next crop of drives like the MP44 and MP44Q. Being up there with the Blue SN5100 is honestly impressive. The drive also runs cool with more than 20°C of headroom in our testing and almost 30°C clearance for the recommended range, so it should be fine without a heatsink in almost all cases.
Test Bench and Testing Notes
CPU | |
Motherboard | |
Memory | |
Graphics | Intel Iris Xe UHD Graphics 770 |
CPU Cooling | |
Case | |
Power Supply | |
OS Storage | |
Operating System |
We use an Alder Lake platform with most background applications, such as indexing, Windows updates, and anti-virus, disabled in the OS to reduce run-to-run variability. Each SSD is prefilled to 50% capacity and tested as a secondary device. Unless noted, we use active cooling for all SSDs.
Inland QN450 Bottom Line
The Inland QN450 is a pretty good drive, with an asterisk. We have concerns about the hardware. Micro Center lists two different controllers in a different class, and the specifications everywhere, including Amazon, suggest weaker hardware than what our sample has. The drive seems poised to be a Kingston NV3 killer – as a budget drive below the higher-end TN470 – but frankly, it’s too good for that. Given the drive’s relatively low TBW endurance rating, we have to anticipate potential hardware variability, meaning the hardware components used will change over its lifetime, which means our recommendation for it comes with a caveat.
Beyond that, though, performance is good to great across the board, and power efficiency is simply exceptional. This is a drive that will work great anywhere. At the time of review, it’s also priced pretty well, which in the current market is worth noticing. Inland does not have as much support as other, bigger brands, but we don’t find this to be much of an issue, as it’s still a known entity with a relatively good track record. Your biggest problem will be being able to afford an SSD at all with current prices. The QN450 is worth a look as a cost-effective alternative to some of the bigger names, and we can recommend it.
MORE: Best SSDs
MORE: Best External SSDs