be quiet! Pure Power 9 600W PSU Review
be quiet! released the updated Pure Power 9 series that consists of four semi-modular models with capacities ranging from 400W to 700W. Today, we're looking at the 600W implementation to see where it stands in the competitive mainstream market.
Why you can trust Tom's Hardware
Cross-Load Tests And Infrared Images
Our cross-load tests are described in detail here.
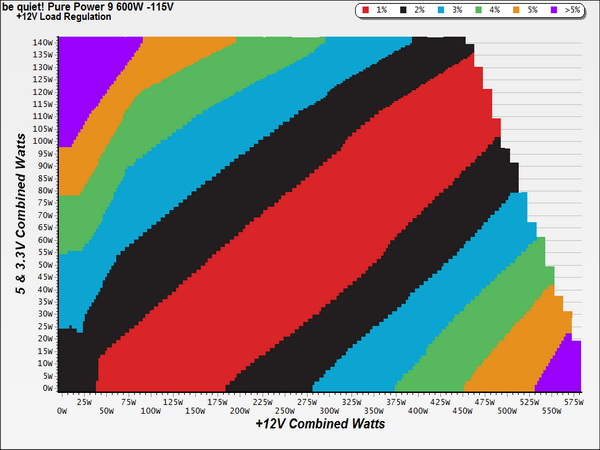
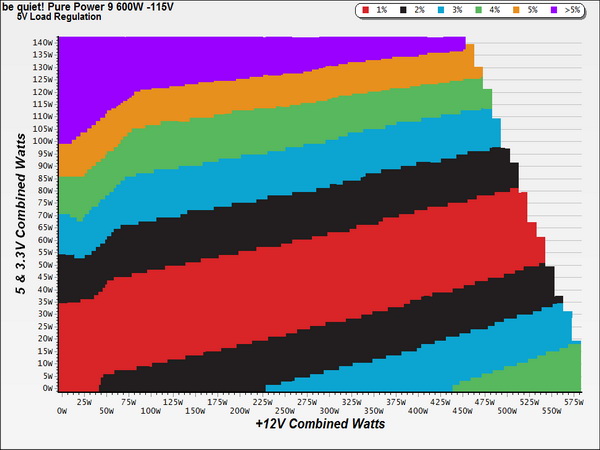
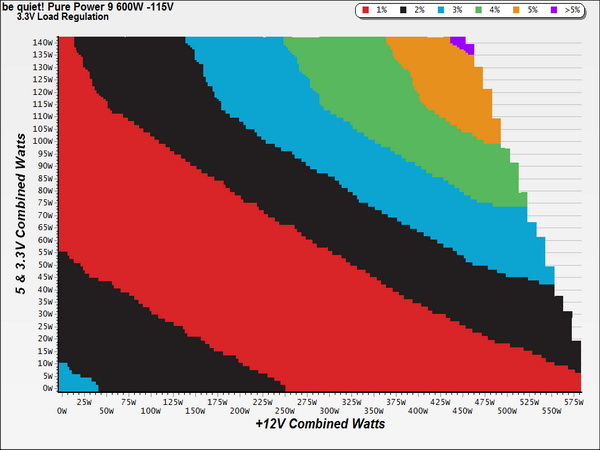
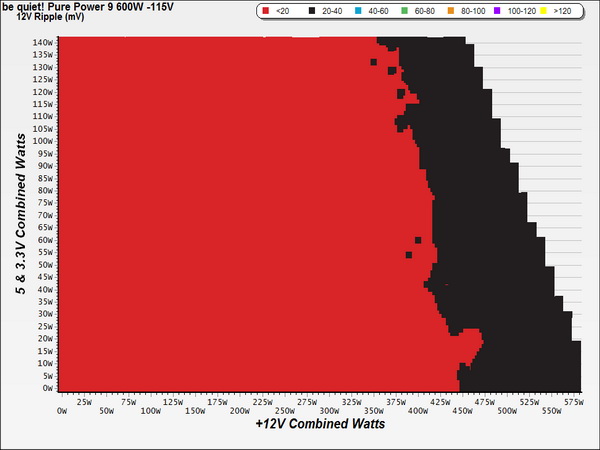
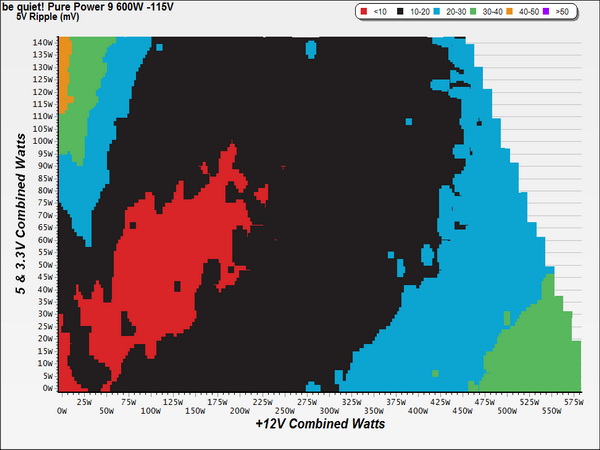
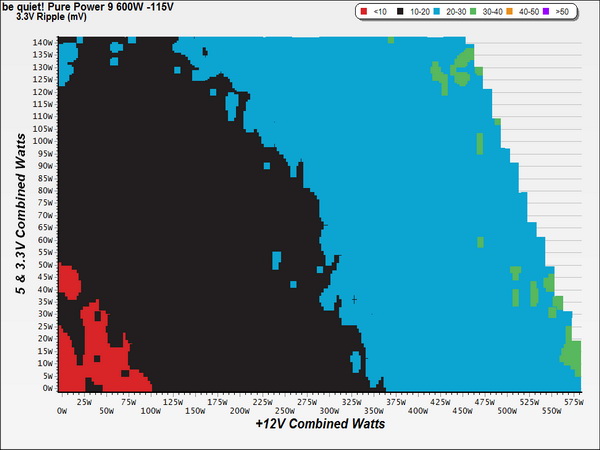
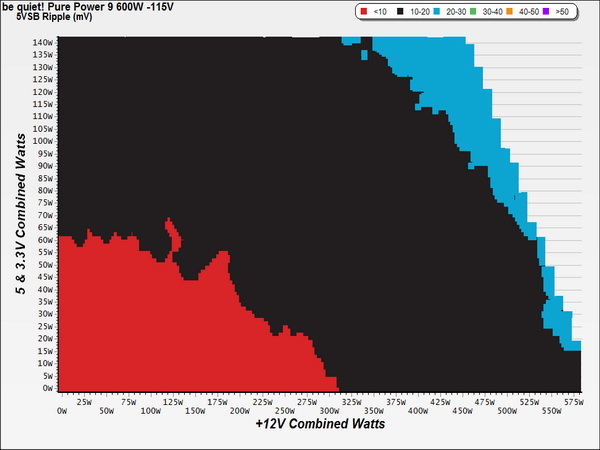
To generate the following charts, we set our loaders to auto mode through our custom-made software before trying more than 1500 possible load combinations with the +12V, 5V and 3.3V rails. The load regulation deviations in each of the charts below were calculated by taking the nominal values of the rails (12V, 5V and 3.3V) as point zero.
Load Regulation Charts
Efficiency Chart
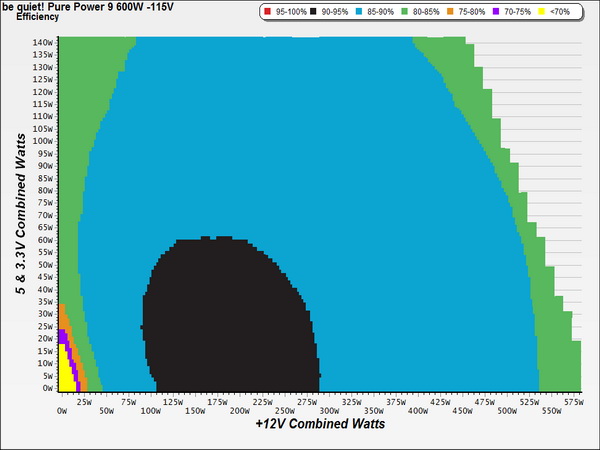
Efficiency exceeds 90 percent between 110W and 280W load on the +12V rail, with the load on the minor rails staying below 60W. Under more than 530W load, efficiency drops below 85 percent even at normal operating temperatures.
Ripple Charts
Infrared Images
Toward the end of the cross-load tests, we took some photos of the PSU with our modified FLIR E4 camera that delivers 320x240 IR resolution (76,800 pixels).
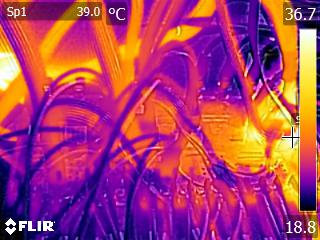
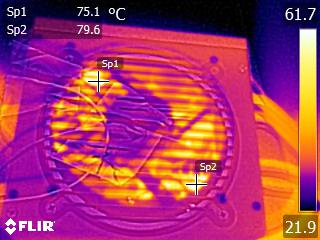
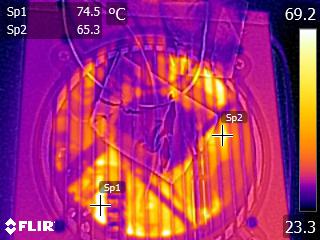
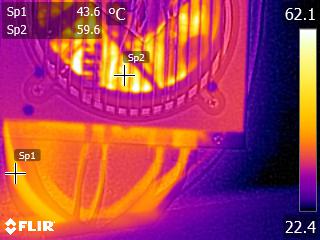
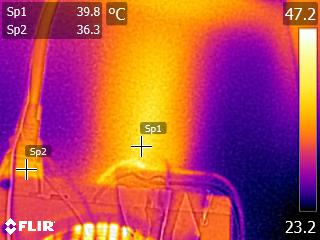
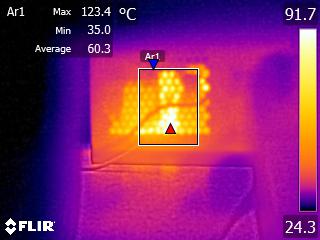
The PFC coil approaches 75 °C, while the +12V and 5V filtering coil on the secondary side hits close to 80 °C. Temperatures inside of this PSU are higher since the fan rotates at low speeds. Meanwhile, heat dissipation is higher due to reduced efficiency compared to Gold- and Platinum-rated units.
Get Tom's Hardware's best news and in-depth reviews, straight to your inbox.
Current page: Cross-Load Tests And Infrared Images
Prev Page Efficiency, Temperature And Noise Next Page Transient Response Tests
Aris Mpitziopoulos is a contributing editor at Tom's Hardware, covering PSUs.
-
turkey3_scratch Really poor unit. For one thing, the crossload performance is poor. Sleeve bearing fan with less reliability. 85C primary capacitor. Once again, another failed 3.3V transient response. Very high inrush current. Also, near worst of all, 140+mv of ripple on the 12V rail in CL2. Just really bad. And CL2 is a realistic scenario these days because those 3.3V and 5V rails don't do much anyway. FSP's soldering is clearly not the same as the nice soldering on their high end units.Reply
But my largest complaint would have to be voltage regulation (line regulation) under different load scenarios on page 6. -
4745454b 85C main cap doesn't bother me that much. It should get airflow from the fan so unless the fan dies (and if it does 105C cap isn't going to help much.) or it gets clogged with dust you should be ok. As for the CL test what do you expect? It's a group regulated design so that's going to happen. It's like buying a super duty truck and then complaining you don't get 30MPG in town. What I find more bothersome is they can't seem to sell you what they claim on the box. If it's not C6 or C7 ready and not a group reg design, why claim so? I wonder if they shipped the wrong unit?Reply -
powernod Outstanding review by Aris as always! :)Reply
If only the PSU itself was outstanding as well:ouch:
-
basroil Looks like FSP is still mostly a second tier manufacture with those transient response and inrush... does it really hurt that much to put a shuntable thermistor like Seasonic and SuperFlower units have?Reply
For less than $10 more you can usually find excellent Seasonic and SuperFlower Leadex Gold units, which makes it really hard to say this PSU is anything more than "meh" -
Aris_Mp actually I am worried about the bulk cap, because 85C means that it has 4x times lower lifetime than a 105C cap.Reply -
turkey3_scratch Reply17839248 said:85C main cap doesn't bother me that much. It should get airflow from the fan so unless the fan dies (and if it does 105C cap isn't going to help much.) or it gets clogged with dust you should be ok. As for the CL test what do you expect? It's a group regulated design so that's going to happen. It's like buying a super duty truck and then complaining you don't get 30MPG in town. What I find more bothersome is they can't seem to sell you what they claim on the box. If it's not C6 or C7 ready and not a group reg design, why claim so? I wonder if they shipped the wrong unit?
Not all group regulated designs are exactly the same way. We see in Seasonic's S12ii series a group regulated design that actually crossloads very well. This seems to be one of the worst on the ladder.
@Aris: Why is Inactive PWR_OK to DC_LOSS better at a higher value? Once the PWR_OK signal is dropped, wouldn't you want the unit to shut down as quickly as possible, not prolong it? -
powernod It was already explained by Aris at his review:Reply
"The power-good signal lasts longer, so when it drops, the voltage level of the +12V rail is already below 11V."
When the pwr_ok to DC_loss is higher (*meaning that it has a positive , not negative value) that means that the motherboard will already have been shut-down. (*from what i've understand, at least) -
turkey3_scratch Not sure how the motherboard could shut down before the PWR_OK signal is dropped.Reply -
Aris_Mp the problem is that in some PSUs, PWR_OK, which informs the mainboard when it should shut down, drops after and not before the rails go our of spec. So once it drops the rails are already too low.Reply
Normally when AC is removed, the PWR_OK signal should be de-asserted at least 1ms before voltages go out of spec in order not to stress the VRMs of the mainboard and of other components (e.g. VGA, HDD, SSD, etc.).
The only way to address this issue is to have a circuit on the mainboard checking the input voltages and give the shut down order when these go out of spec. In other words to completely bypass the power_ok signal coming from the PSU. But this will cost money and after all a PSU oughts to follow ATX spec's guidelines. -
turkey3_scratch So is "DC_LOSS" considered "voltages out of spec"? I mean, there can still be DC even if voltages are out of spec. It won't be a loss of DC< just an out-of-spec voltage relative to the DC.Reply
