EVGA SuperNOVA 1000 G3 PSU Review
We already reviewed the SuperNOVA 850 G3, which left a good impression on us. Today, we're looking at the 1000 G3, this family's current flagship model. It's a physically diminutive PSU that offers high performance in every area.
Why you can trust Tom's Hardware
Cross-Load Tests And Infrared Images
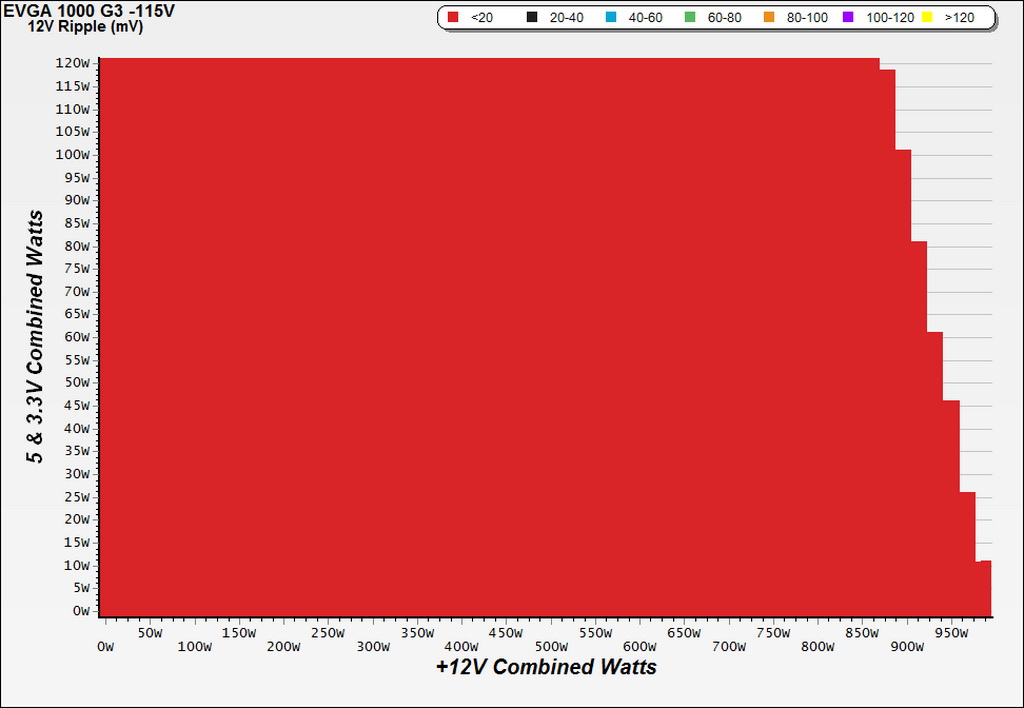
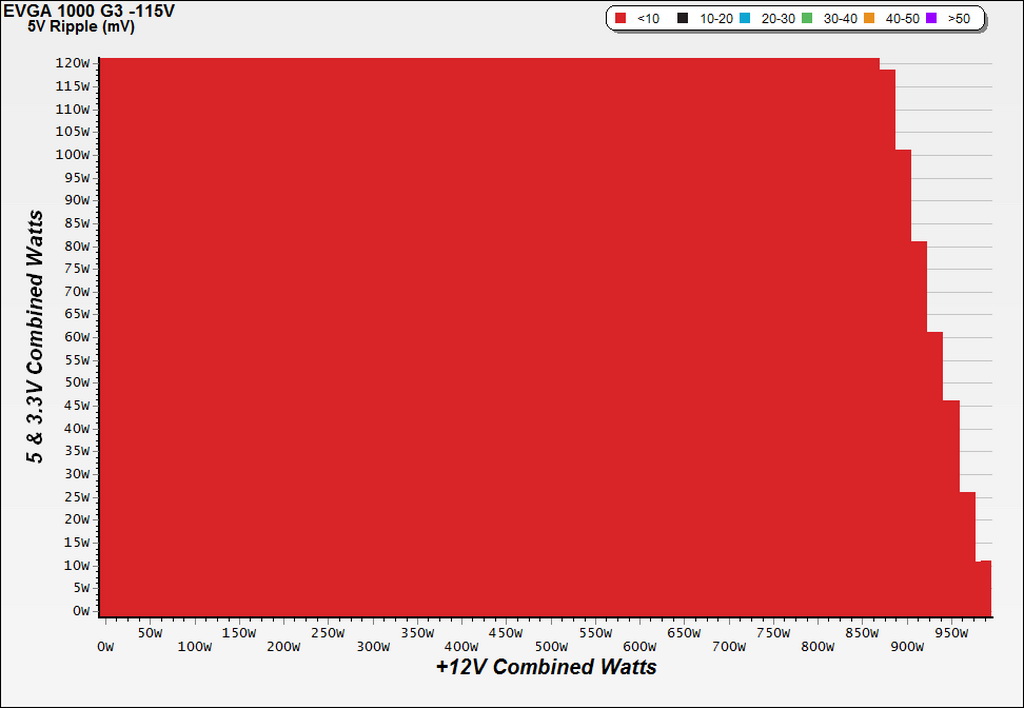
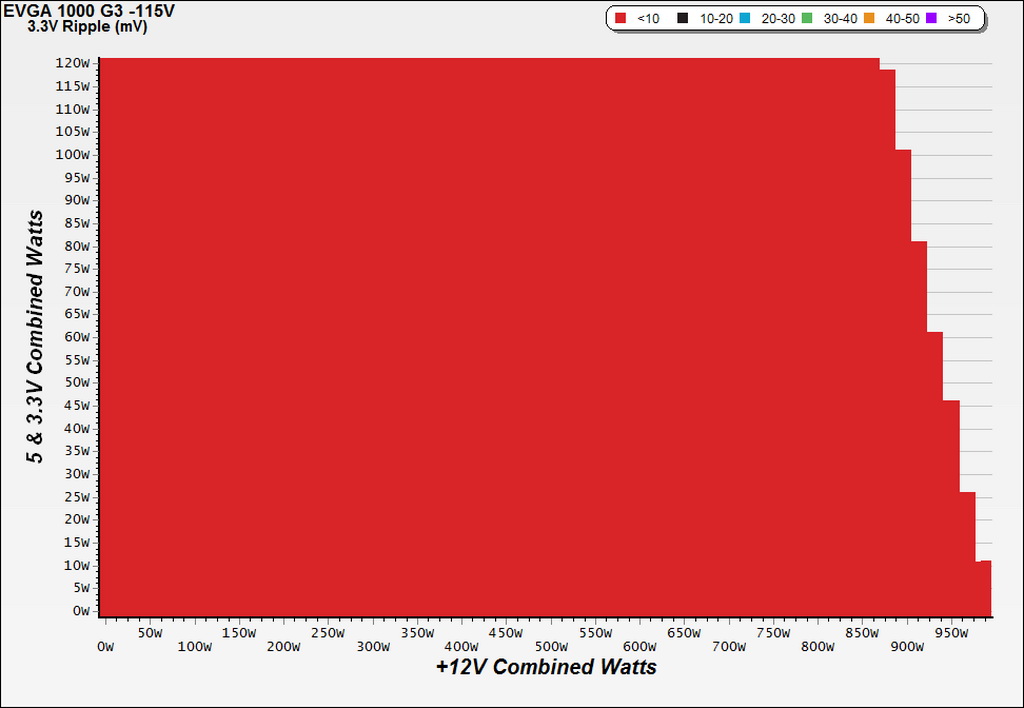
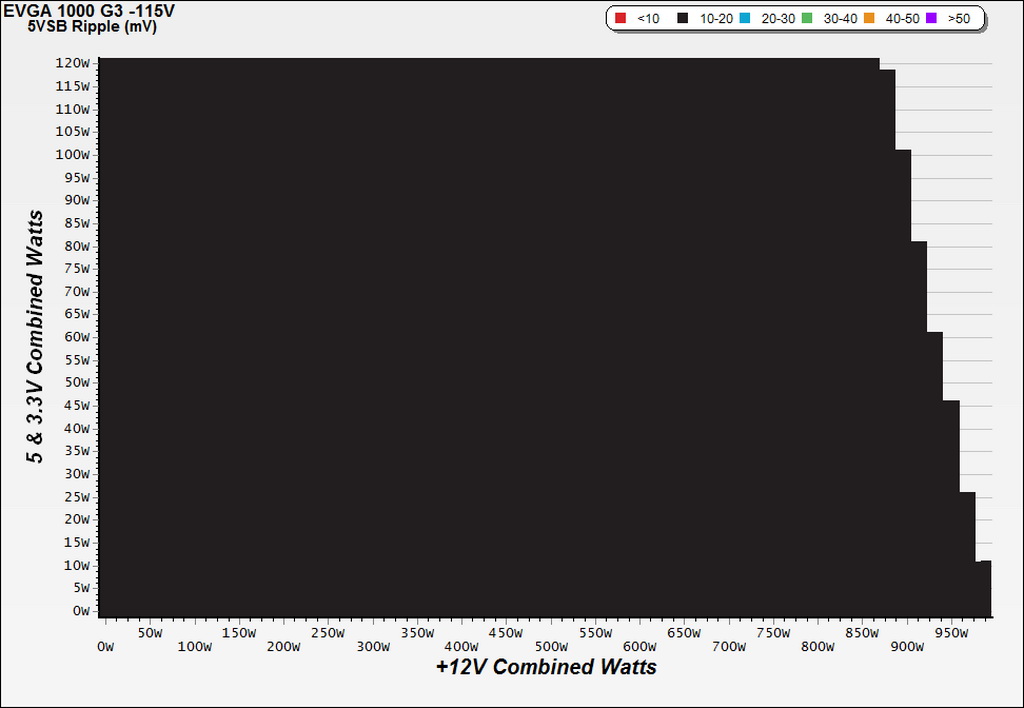
Our cross-load tests are described in detail here.
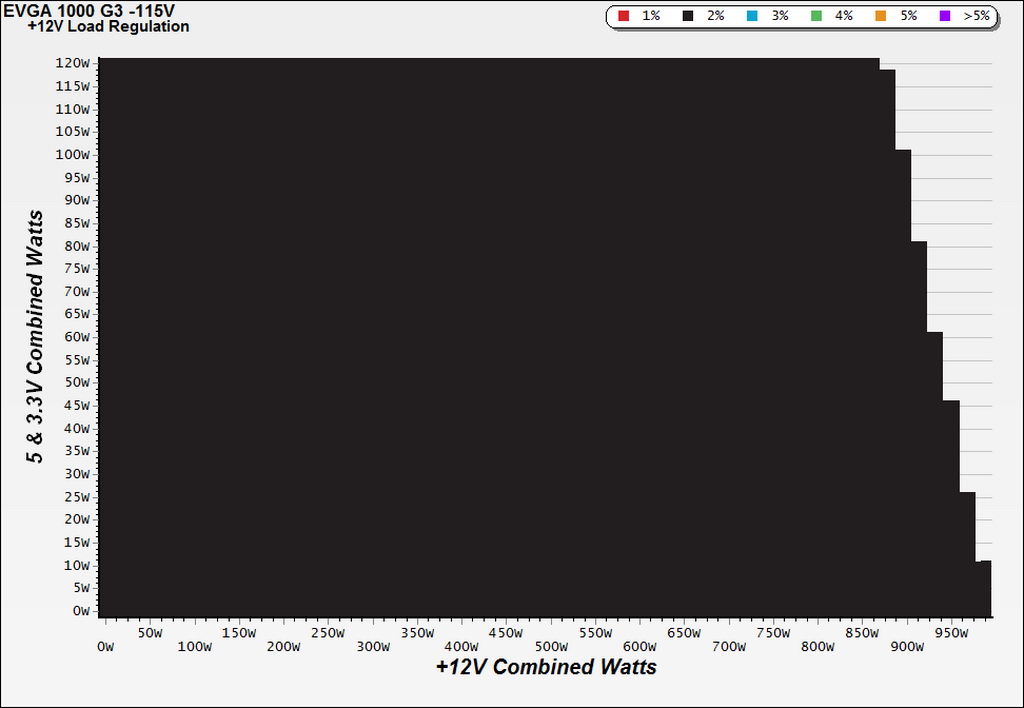
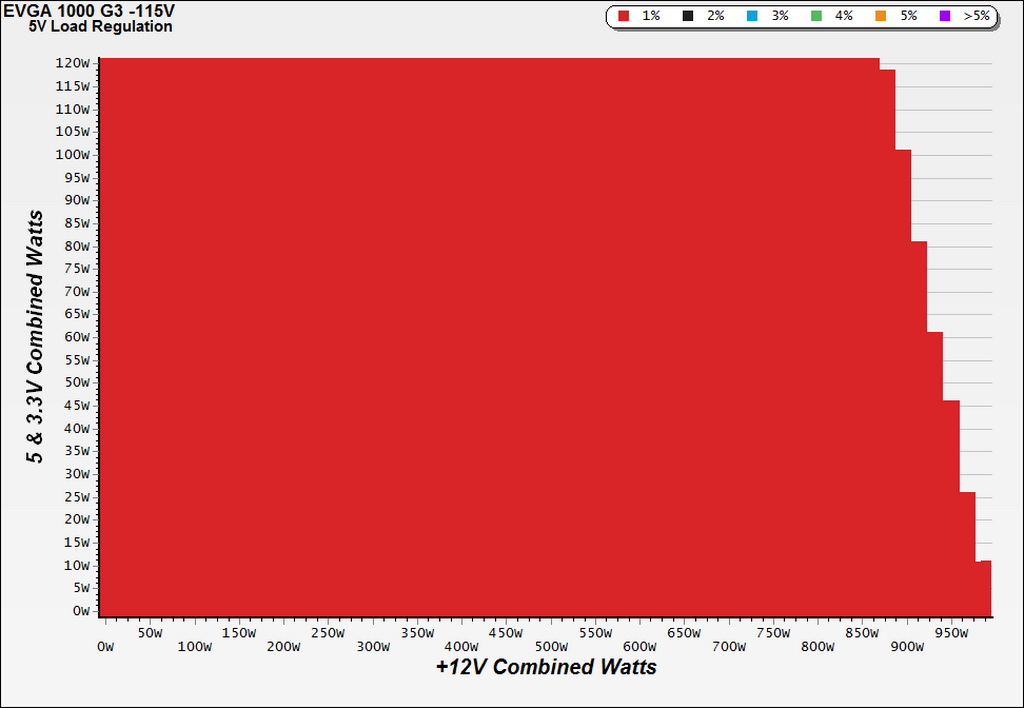
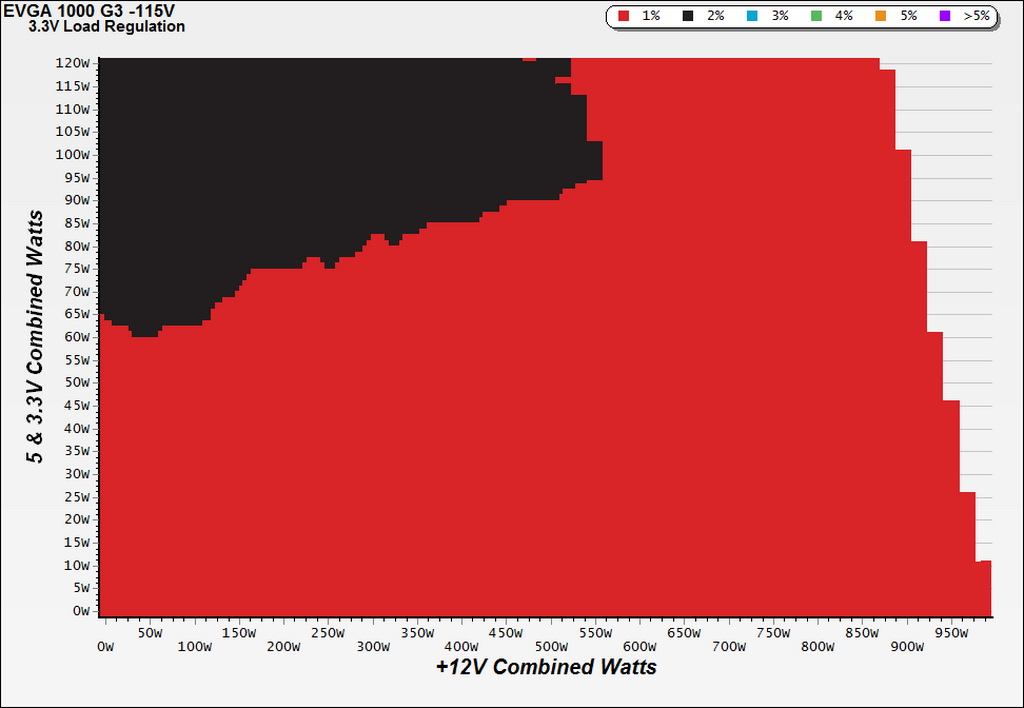
To generate the following charts, we set our loaders to auto mode through our custom-made software before trying more than 25,000 possible load combinations with the +12V, 5V and 3.3V rails. The load regulation deviations in each of the charts below were calculated by taking the nominal values of the rails (12V, 5V and 3.3V) as point zero. The ambient temperature was between at 30°C (86°F) to 32°C (89.6°F).
Load Regulation Charts
Efficiency Chart
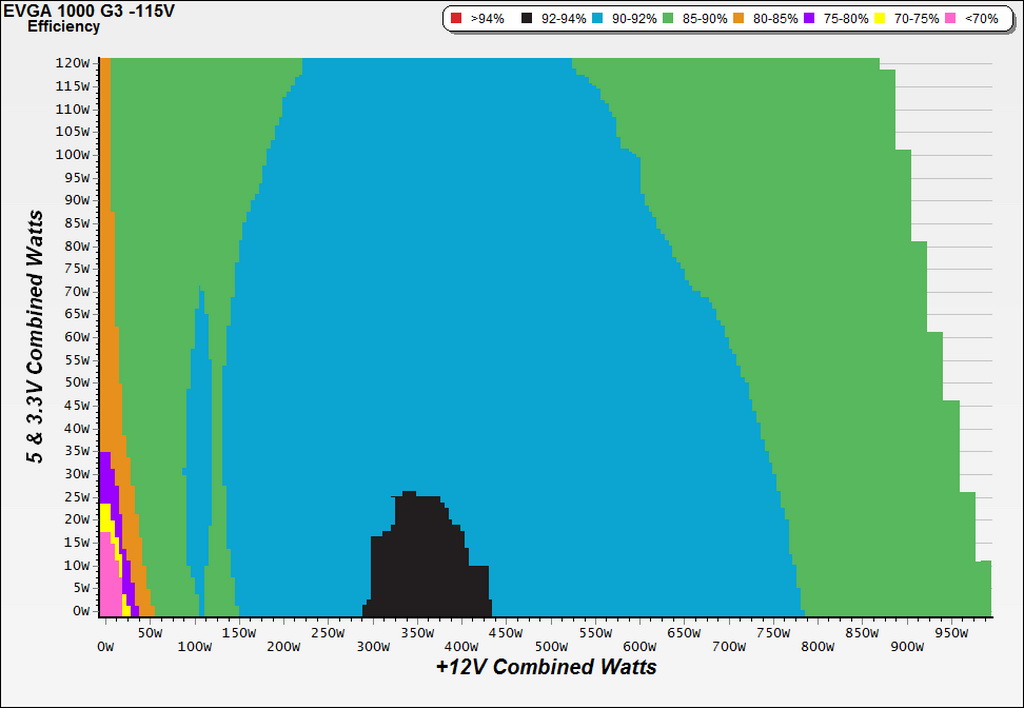
This is a very efficient PSU. It's amazing to see a Gold-rated unit offering even a small region with 92-94% efficiency levels.
Ripple Charts
Infrared Images
Toward the end of the cross-load tests, we took some photos of the PSU with our modified FLIR E4 camera that delivers 320x240 IR resolution (76,800 pixels).
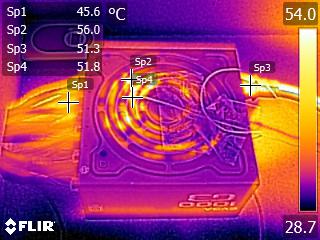
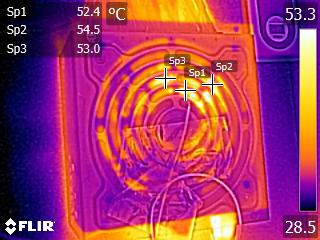
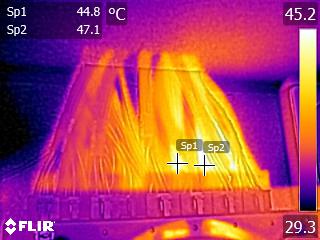
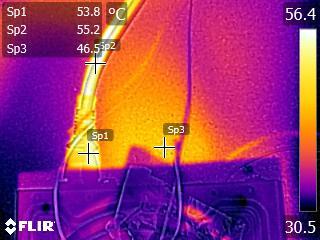
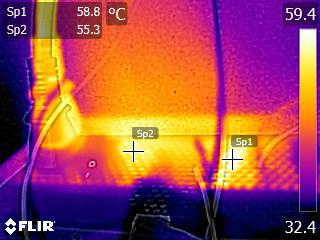
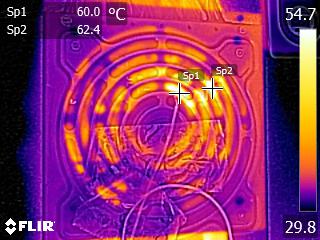
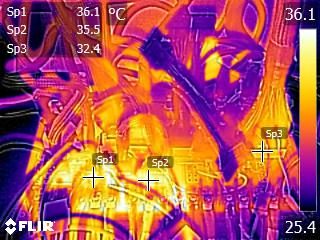
Temperatures inside of the SuperNOVA 1000 G3 look normal, given the load/stress we're putting on it. The power cable got quite hot, as you can see, since the PSU was delivering loads close to its full power for a prolonged period.
Get Tom's Hardware's best news and in-depth reviews, straight to your inbox.
Current page: Cross-Load Tests And Infrared Images
Prev Page Protection Features, Evaluated Next Page Transient Response Tests
Aris Mpitziopoulos is a contributing editor at Tom's Hardware, covering PSUs.
-
powernod 140$. Exactly the same cost with Corsair's RMx1000 current pricing. Not sure which unit i would choose between those 2.Reply -
BugariaM Nice.Reply
>>>The 1000 G3's single bulk cap is provided by Chemi-Con (400V, 820uF, 2000h @ 105°C, CE)
Strangely, but I did not find "CE" series of capacitors in the Nippon Chemi-Con catalog -
10tacle Wow. The price point of this and overall performance makes this a serious player even for those who were in the market for nothing more than 850W gold or even platinum PSUs. So many people out there say "you don't need more than a xxxW power supply for your build." I like to buy based on <60% of calculated max load use of my build for less fan noise, heat output, and higher efficiency wall draw.Reply
Buying a gold 600W PSU when my rig uses 500W for example does not make much sense to me. I'd prefer to spend a little more and buy a gold 850W ($110USD vs. $130USD in the example of these two 650 & 850 G3 series on NewEgg right now). Not only for a higher efficiency operation as described above, but for future headroom growth. But I understand many do not think that and look to save a few dollars everywhere...one being on the PSU. -
10tacle Reply19478429 said:140$. Exactly the same cost with Corsair's RMx1000 current pricing. Not sure which unit i would choose between those 2.
Keep in mind when comparing the RM1000x that it was introduced at $180 in November 2015 and it took nearly a year to see the prices drop down below $150. The EVGA was originally released at $170 and has only been out for four months. Also keep in mind that the Corsair is marketed more for silent operation (drawback to that shown below).
If none of the drawbacks described and shown here do not bother you, and if overall "hot" efficiency and exhaust temperature are among top priorities for you, then the EVGA is the better performer. Average efficiency result of 7 load line tests, and the average exhaust temps under each test:
EVGA - 88.571%, 45.0C
Corsair - 87.857%, 49.8C
^^While the <1% efficiency difference is nominal and will not be seen on your monthly power bill, that nearly 5C difference coming out can make a slight difference in the temperature of your room in the summer. So the Corsair being quieter has a drawback.
http://www.jonnyguru.com/modules.php?name=NDReviews&op=Story4&reid=494 (EVGA)
http://www.jonnyguru.com/modules.php?name=NDReviews&op=Story4&reid=449 (Corsair)
-
Co BIY I would have liked to see the EVGA 1000 G2 in the performance tables as well. Both to see the generational improvement and to make a value comparison while both units are on the market.Reply
Is EVGA stopping production of the G2 series ? -
hst101rox 10TACLE, if the efficiency of the EVGA and the Corsair are nearly identical, the ~5 degree C temp difference could be just from the amount of airflow being less in the Corsair. Power consumption is the only thing that equates to BTUs, heat.Reply -
10tacle Reply19479497 said:10TACLE, if the efficiency of the EVGA and the Corsair are nearly identical, the ~5 degree C temp difference could be just from the amount of airflow being less in the Corsair. Power consumption is the only thing that equates to BTUs, heat.
That's why I stated the downside to the Corsair is the hotter air coming out the back. Same thing with a video card: you have to sacrifice more heat output for a quieter fan speed.
-
Aris_Mp I don't have 115V test results (but only 230V) for the G2s, so I couldn't add them to the graphs.Reply -
Co BIY "We didn't get any OCP results because our unit died during the OPP test, meaning either that this particular sample had a problem or OPP is set very high."Reply
Seems like this would be a big deal ?
Maybe at least one bullet in the Con column. -
Aris_Mp I have another one here, which come late, to test. If it dies as well then I will update the con list.Reply
