Super Flower Leadex Titanium 1600W Power Supply Review
Corsair's mighty AX1500i PSU must now face some stiff competition, as Super Flower's new Leadex Titanium 1600W offers even more power and efficiency.
Why you can trust Tom's Hardware
Cross-Load Tests And Infrared Images
Our cross-load tests are described in detail here.
To generate the following charts, we set our loaders to Auto mode through our custom-made software before trying over a thousand possible load combinations with the +12V, 5V and 3.3V rails. The load regulation deviations in each of the charts below were calculated by taking the nominal values of the rails (12V, 5V and 3.3V) as point zero.
Load Regulation Charts
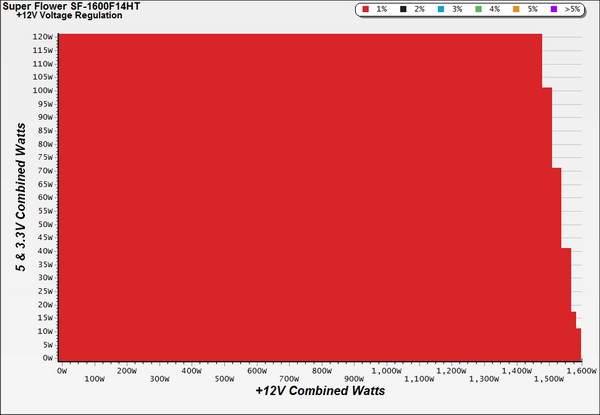
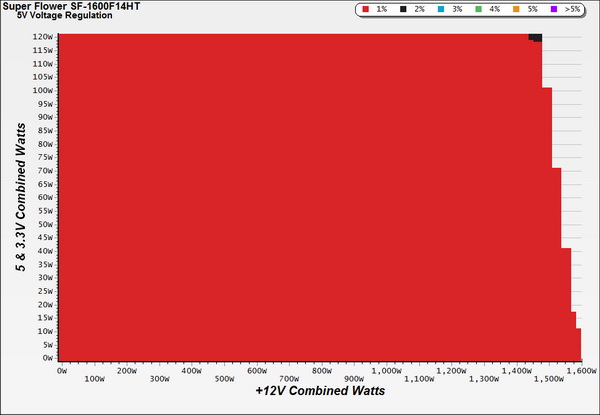
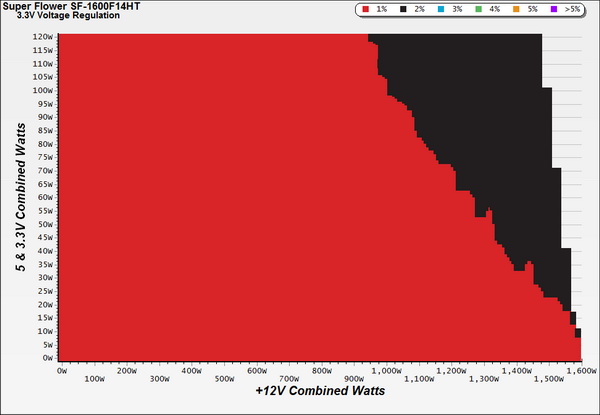
We find perfect load regulation at +12V, within one-percent deviation of this rail's nominal voltage (which is exactly 12V). There was tight load regulation at 5V, as well. Load regulation at higher loads on the 3.3V rail is a little looser compared to the +12V and 5V rails, however it is still very good and within two-percent deviation.
Efficiency Chart
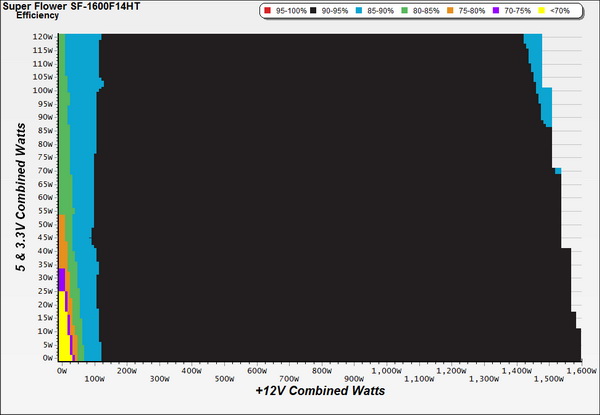
As you can see from the corresponding chart, this Titanium PSU's efficiency is simply amazing!
Ripple Charts
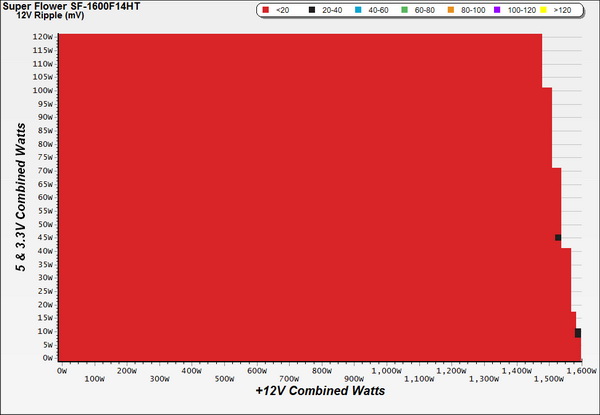
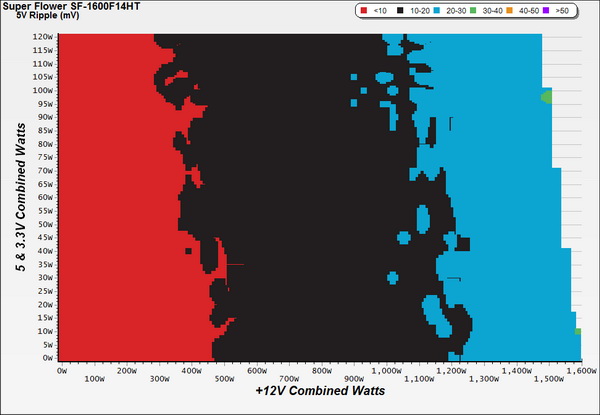
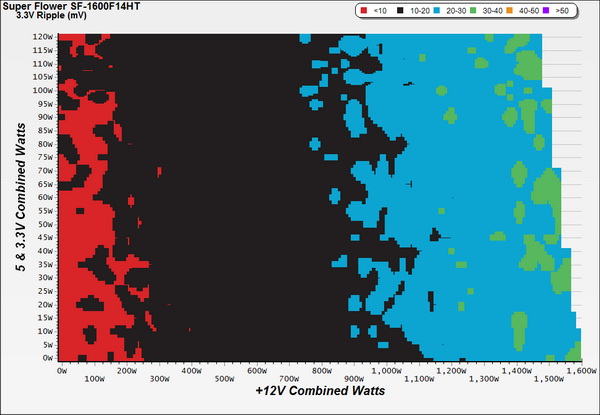
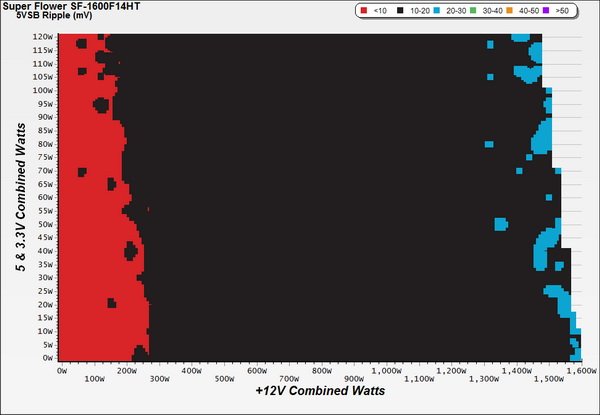
Ripple suppression at +12V is outstanding throughout the PSU's entire operating range. We would like to see even better ripple suppression on the minor rails, since Super Flower's Gold- and Platinum-rated versions of the same platform performed much better in this discipline. There are some areas with increased ripple at 3.3V.
Infrared Images
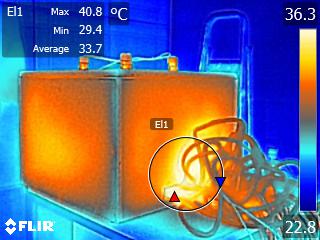
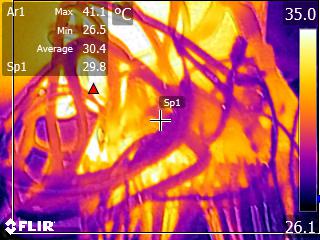
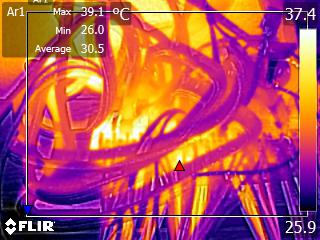
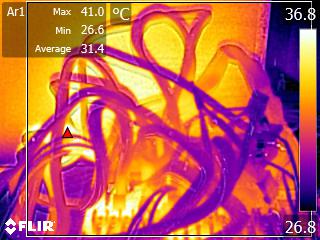
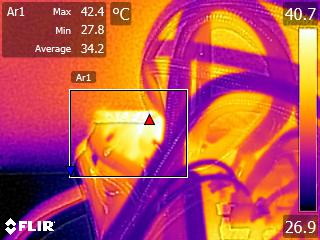
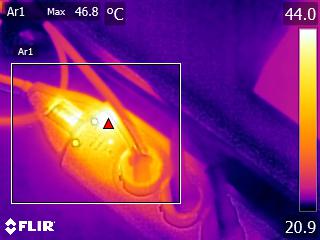
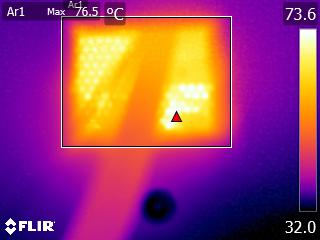
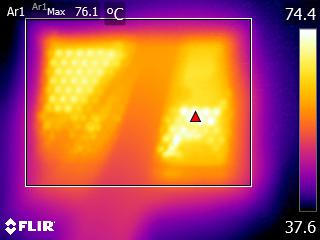
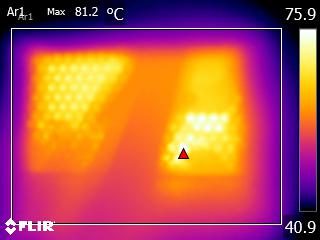
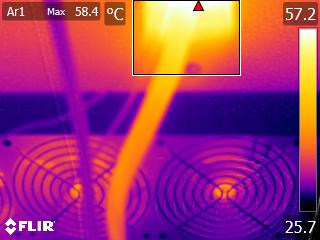
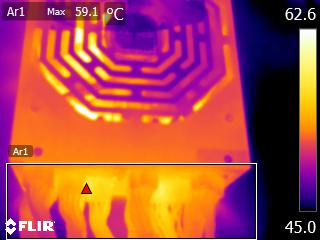
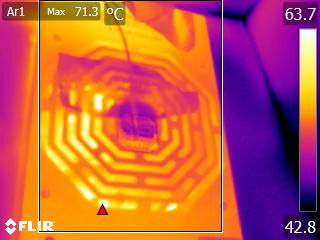
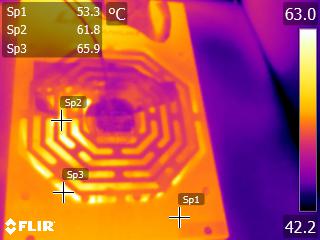
During the end of the cross-load tests, we took some photos of the PSU as it was being tested with our modified FLIR E4 camera that delivers 320x240 IR resolution (76,800 pixels).
Get Tom's Hardware's best news and in-depth reviews, straight to your inbox.
Current page: Cross-Load Tests And Infrared Images
Prev Page Efficiency, Temperatures And Noise Next Page Transient Response Tests
Aris Mpitziopoulos is a contributing editor at Tom's Hardware, covering PSUs.
-
Shankovich As much as these super powered PSU reviews are interesting, I wouldn't mind seeing more PSU's for the regular non 4-way Crossfire/SLI user. I think in July you guys did some 450W reviews? Wouldn't also mind a battle of the basement review for those cheap PSU's just for fun. Again, love these 1000+ Watt reviews, but maybe toss in some sub 600W stuff in there more often if possible. Love the depth you guys go to in your PSU reviews!Reply -
MasterMace The Power Supply failed 80 Plus Titanium specifications at 50% (93.34% vs 94%) and 100% (89.61% vs 90%)Reply -
tanjo Page 9 graphs shows a different PSU (Corsair CS850M) though they all link to the correct full list images when clicked.Reply -
ko888 Reply15706850 said:The Power Supply failed 80 Plus Titanium specifications at 50% (93.34% vs 94%) and 100% (89.61% vs 90%)
80 PLUS certification occurs at 23°C only.
Tom's Hardware is testing in a hotbox at over 42°C. So how is that failing 80 Plus Titanium specifications when 80 PLUS Organization doesn't certify or even test at that temperature?
Kitguru.net measures efficiency at 35°C and the SuperFlower Leadex Titanium 1600W has no problem meeting 80 PLUS Titanium:
http://www.kitguru.net/components/power-supplies/zardon/superflower-leadex-titanium-1600w-review/6/ -
alidan ReplyAs much as these super powered PSU reviews are interesting, I wouldn't mind seeing more PSU's for the regular non 4-way Crossfire/SLI user. I think in July you guys did some 450W reviews? Wouldn't also mind a battle of the basement review for those cheap PSU's just for fun. Again, love these 1000+ Watt reviews, but maybe toss in some sub 600W stuff in there more often if possible. Love the depth you guys go to in your PSU reviews!
i personally cant see a reason to go lower than 650 watts, the most basic computer with a gpu may only use 50-60% of it at load, but the head room is valued by me far more than the cheaper outset cost...
i had a psu blow up on me... never again. -
Aris_Mp ReplyAs much as these super powered PSU reviews are interesting, I wouldn't mind seeing more PSU's for the regular non 4-way Crossfire/SLI user. I think in July you guys did some 450W reviews? Wouldn't also mind a battle of the basement review for those cheap PSU's just for fun. Again, love these 1000+ Watt reviews, but maybe toss in some sub 600W stuff in there more often if possible. Love the depth you guys go to in your PSU reviews!
As much as these super powered PSU reviews are interesting, I wouldn't mind seeing more PSU's for the regular non 4-way Crossfire/SLI user. I think in July you guys did some 450W reviews? Wouldn't also mind a battle of the basement review for those cheap PSU's just for fun. Again, love these 1000+ Watt reviews, but maybe toss in some sub 600W stuff in there more often if possible. Love the depth you guys go to in your PSU reviews!
As much as these super powered PSU reviews are interesting, I wouldn't mind seeing more PSU's for the regular non 4-way Crossfire/SLI user. I think in July you guys did some 450W reviews? Wouldn't also mind a battle of the basement review for those cheap PSU's just for fun. Again, love these 1000+ Watt reviews, but maybe toss in some sub 600W stuff in there more often if possible. Love the depth you guys go to in your PSU reviews!
The next PSUs will be more down to earth, with sub-1000 W capacities
-
Aris_Mp ReplyThe Power Supply failed 80 Plus Titanium specifications at 50% (93.34% vs 94%) and 100% (89.61% vs 90%)
Page 9 graphs shows a different PSU (Corsair CS850M) though they all link to the correct full list images when clicked.
Already informed the editors responsible to fix this. Thanks!
