Thermaltake Toughpower Grand RGB 750W PSU Review
RGB LED lighting is the new hotness, and a lot of power supplies are incorporating it. Thermaltake's Toughpower Grand RGB with 750W of maximum power boasts RGB lighting, surprisingly good performance, and modular cabling.
Why you can trust Tom's Hardware
Cross-Load Tests And Infrared Images
Our cross-load tests are described in detail here.
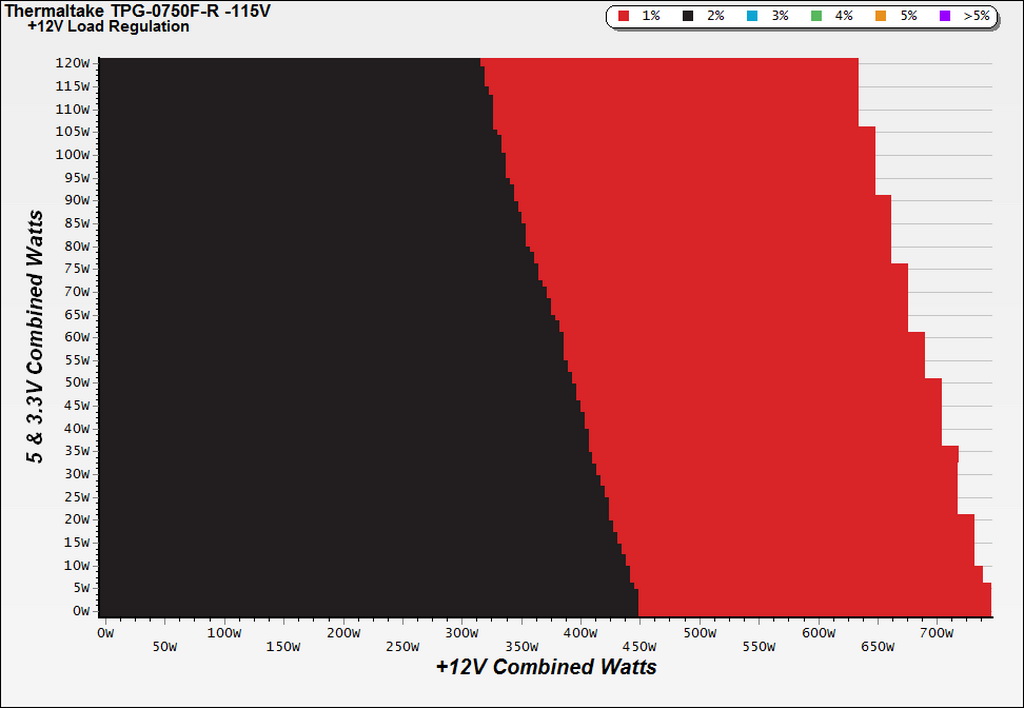
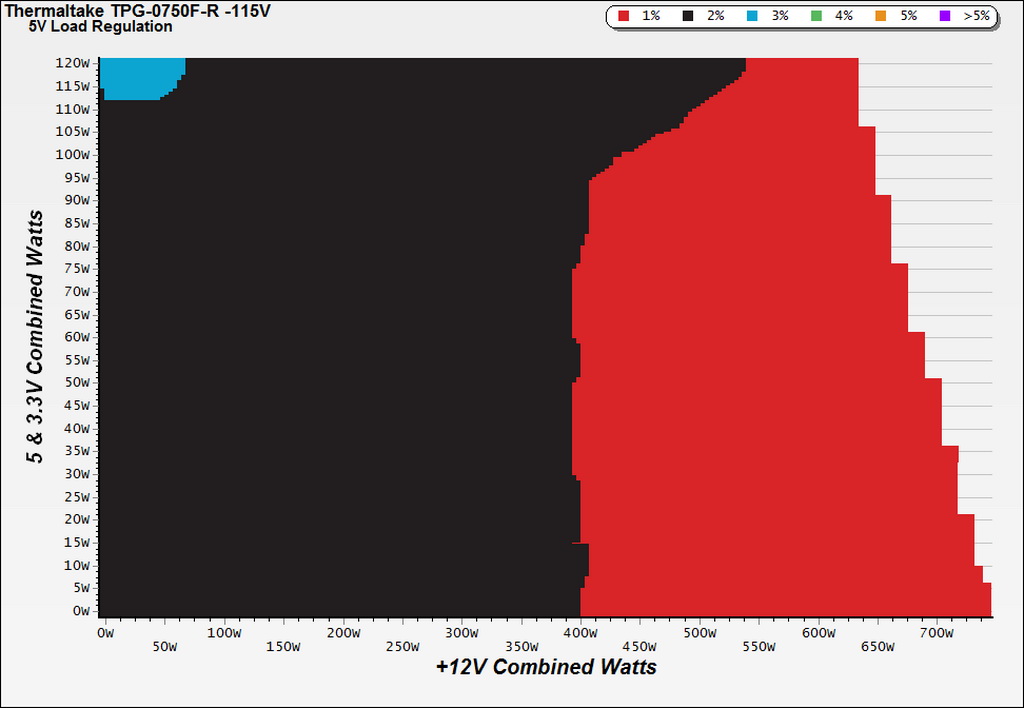
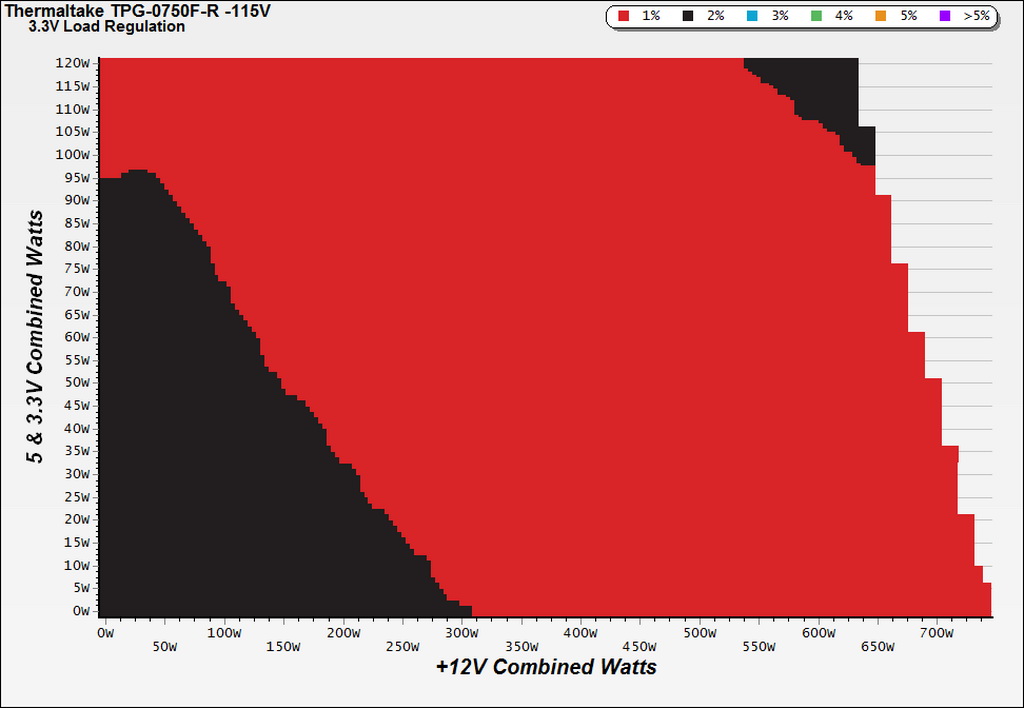
To generate the following charts, we set our loaders to auto mode through our custom-made software before trying more than 25,000 possible load combinations with the +12V, 5V and 3.3V rails. The load regulation deviations in each of the charts below were calculated by taking the nominal values of the rails (12V, 5V and 3.3V) as point zero. The ambient temperature was between at 30°C (86°F) to 32°C (89.6°F).
Load Regulation Charts
Efficiency Chart
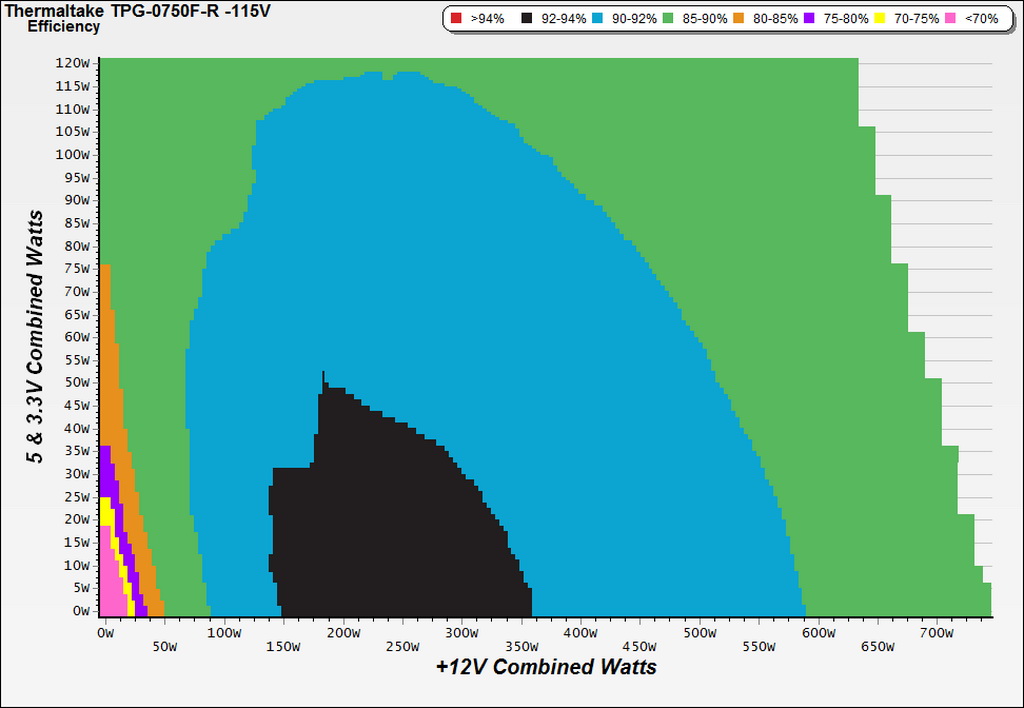
Even for the 80 PLUS Gold specification's standards, Thermaltake's TPG-0750F-R performs very well. It achieves over 92% efficiency between 150W and 350W loads on the +12V rail, while load on the minor rails doesn't exceed 40W-50W.
Ripple Charts
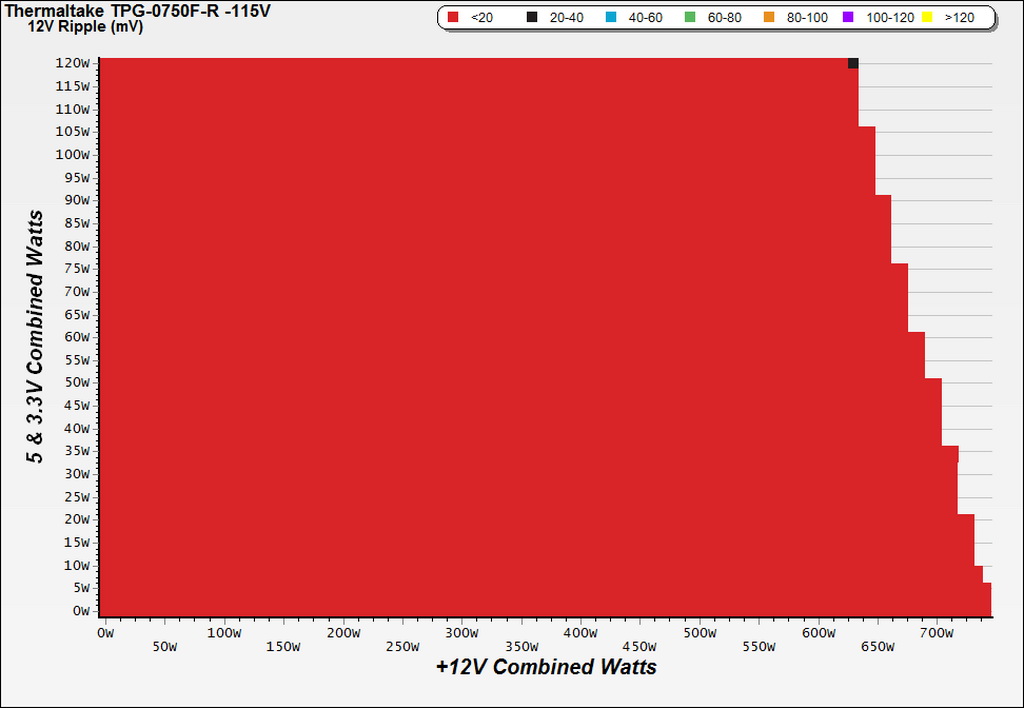
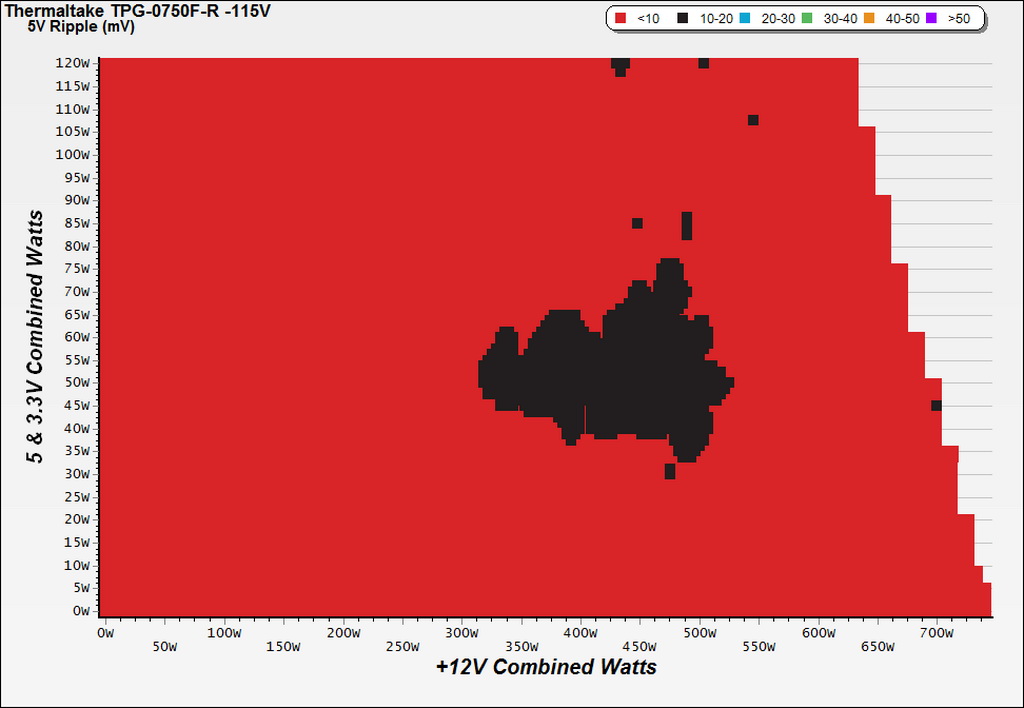
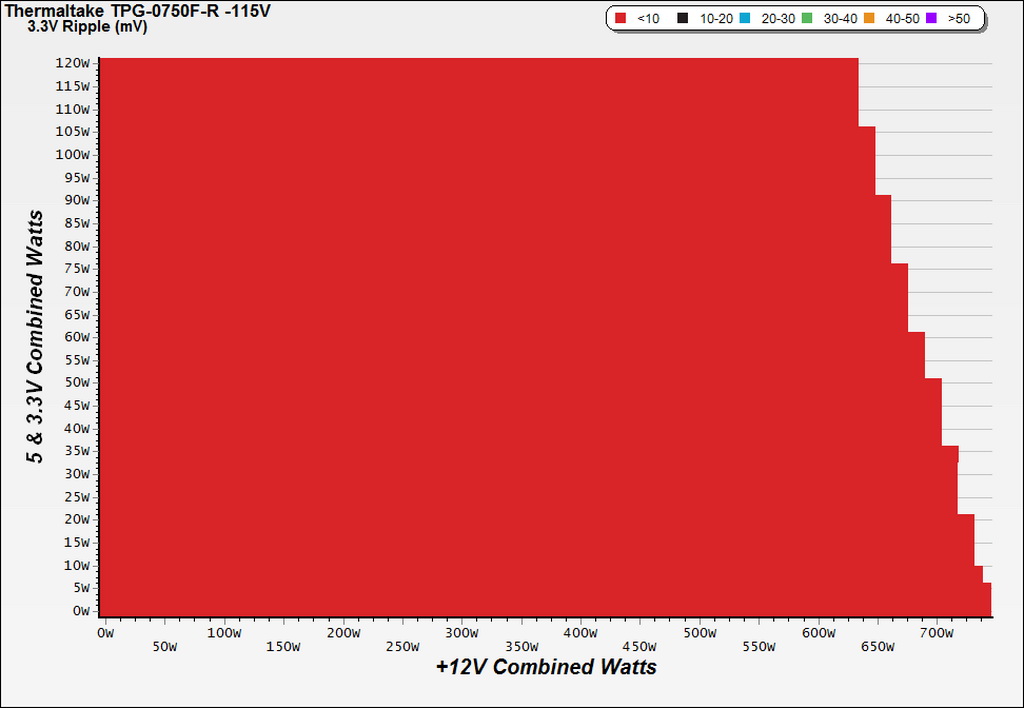
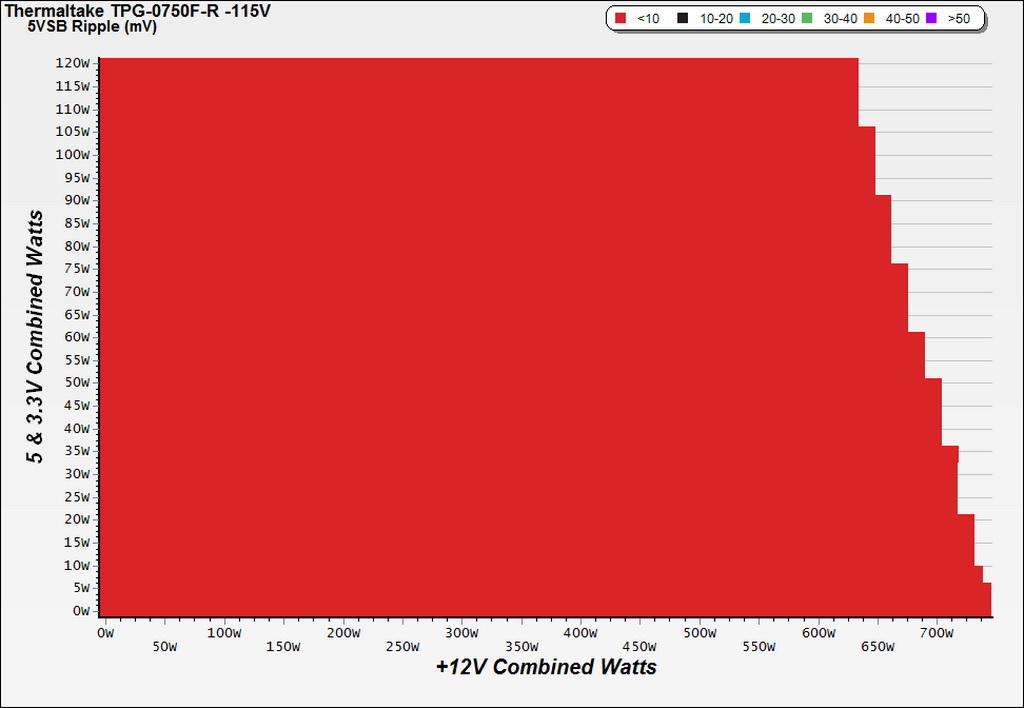
Infrared Images
Toward the end of the cross-load tests, we took some photos of the PSU with our modified FLIR E4 camera that delivers 320x240 IR resolution (76,800 pixels).
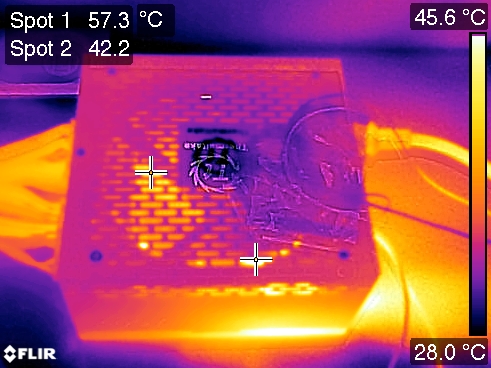
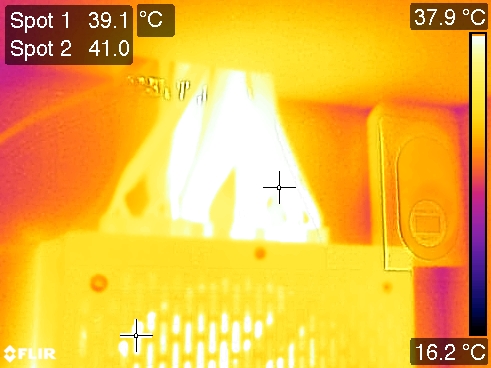
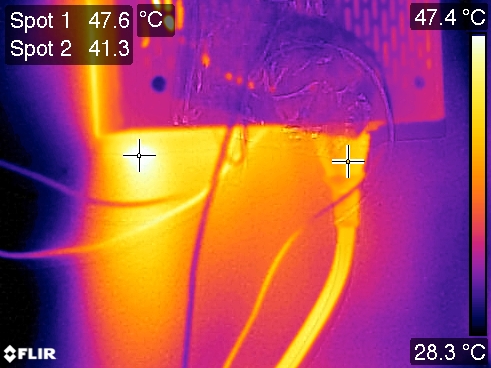
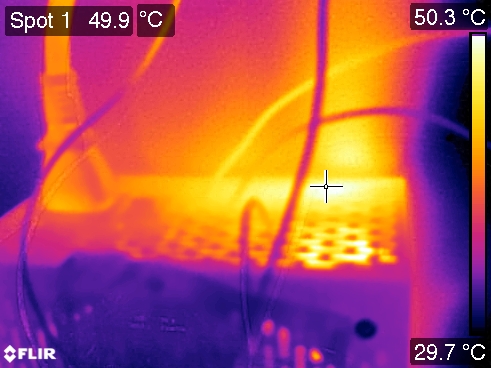
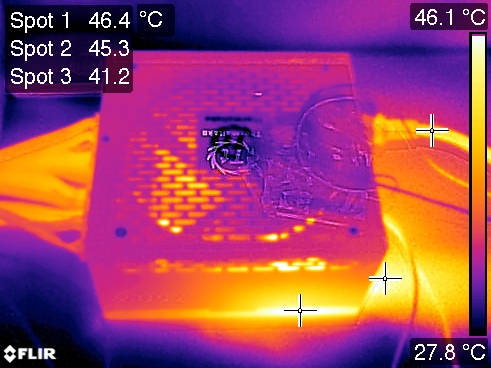
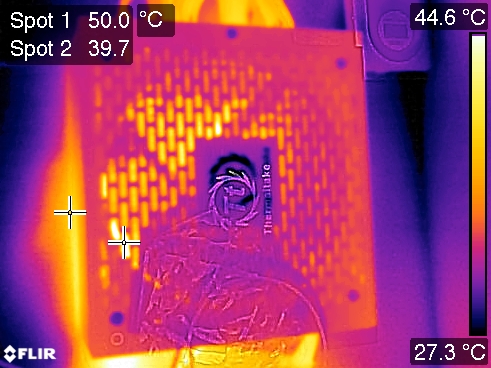
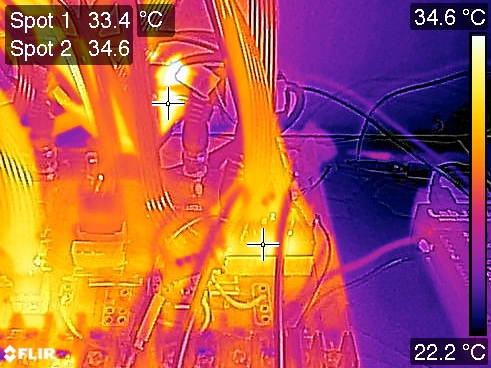
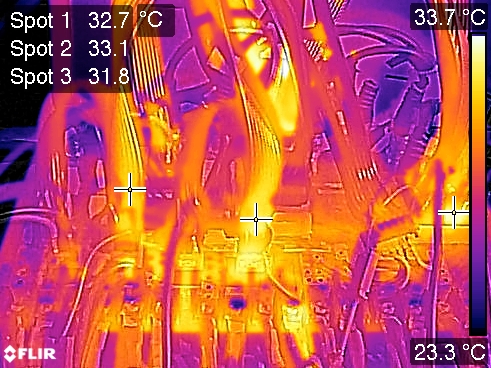
Temperatures inside the PSU are normal, despite the prolonged testing we performed under very high loads. High efficiency and an aggressive fan profile definitely help with thermals.
Get Tom's Hardware's best news and in-depth reviews, straight to your inbox.
Current page: Cross-Load Tests And Infrared Images
Prev Page Protection Features, Evaluated Next Page Transient Response Tests
Aris Mpitziopoulos is a contributing editor at Tom's Hardware, covering PSUs.
-
shrapnel_indie Has anyone tested this claim of a cooler PC with the PSU fan facing up into the case instead of down and drawing air from outside?Reply
Edit: I see with at least this unit, it was found to be so, What about other units? -
Phillip Wager I have my computer case in a dusty area of my house and on the floor. i flipped my psu fan to face inside the case because i was sick of having to clean the dust filter every week or so. I'm paranoid about psu dust death. I have PLENTY of case fans(5) so i'm not worried about the psu overheating in this configuration.Reply -
Malik 722 but mounting power supply fan side up won't suck in hot air from the chassis and increase the power supply temperature.Reply -
Virtual_Singularity Reply19328496 said:I want it, for my Asus
Cool
Na, you really don't, you can do better methinks. -
blackmagnum "It's common knowledge that hot air rises, so if we want to improve airflow inside a chassis, we have to help move hot air up and out with fans installed on the top or back. We'll have to revisit this topic in a story about PSU orientation and its effect on case cooling."Reply
-I'll be looking forward to the article. -
SeoulFood I just won this PSU at a LAN this past weekend. I would use it, but I won a Silverstone 850w at the last LAN. Craigslist here we come.Reply
