Why you can trust Tom's Hardware
AMD Ryzen 5 9600X Productivity Application Benchmarks, the TLDR
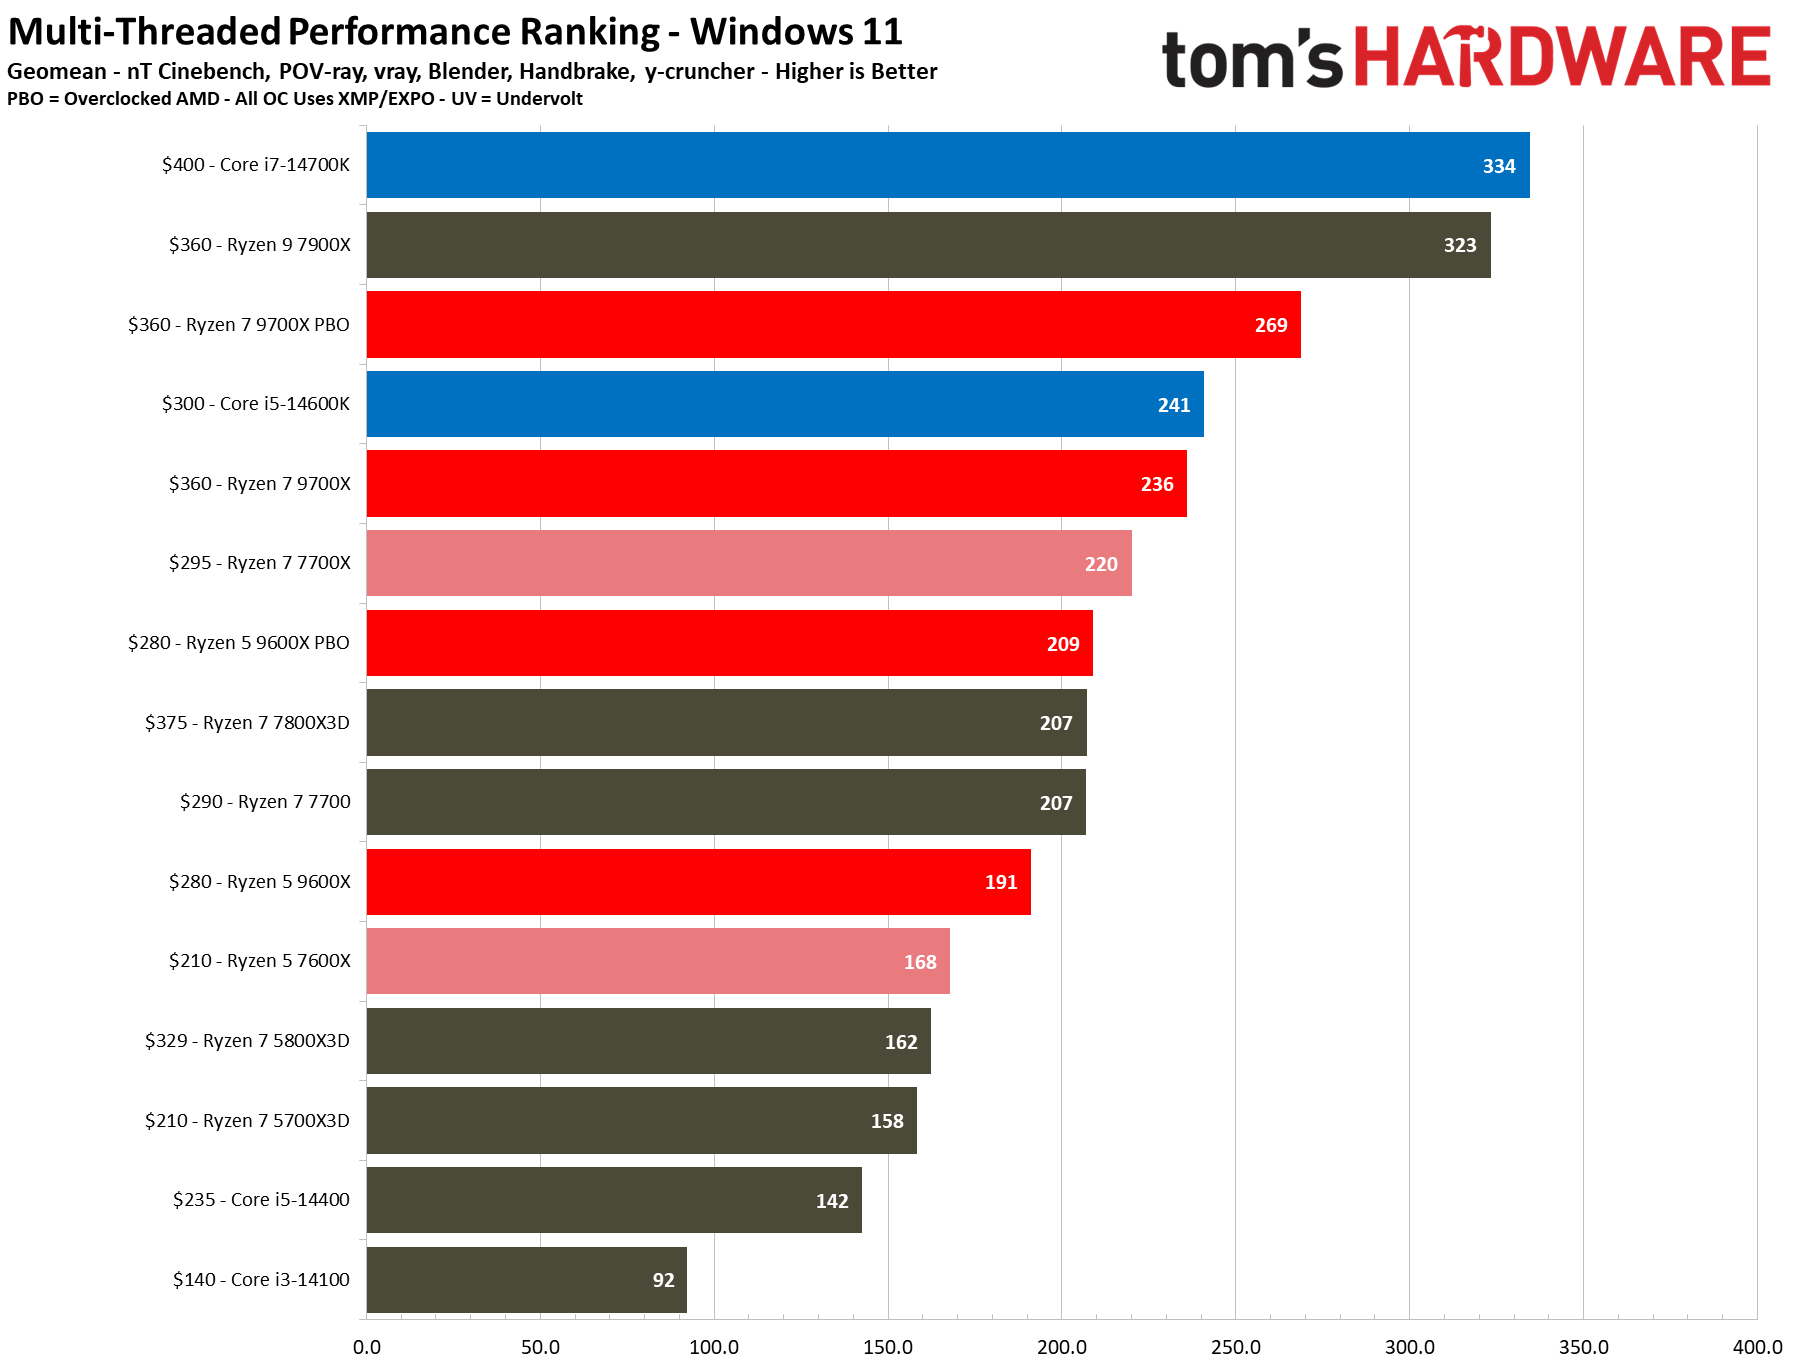
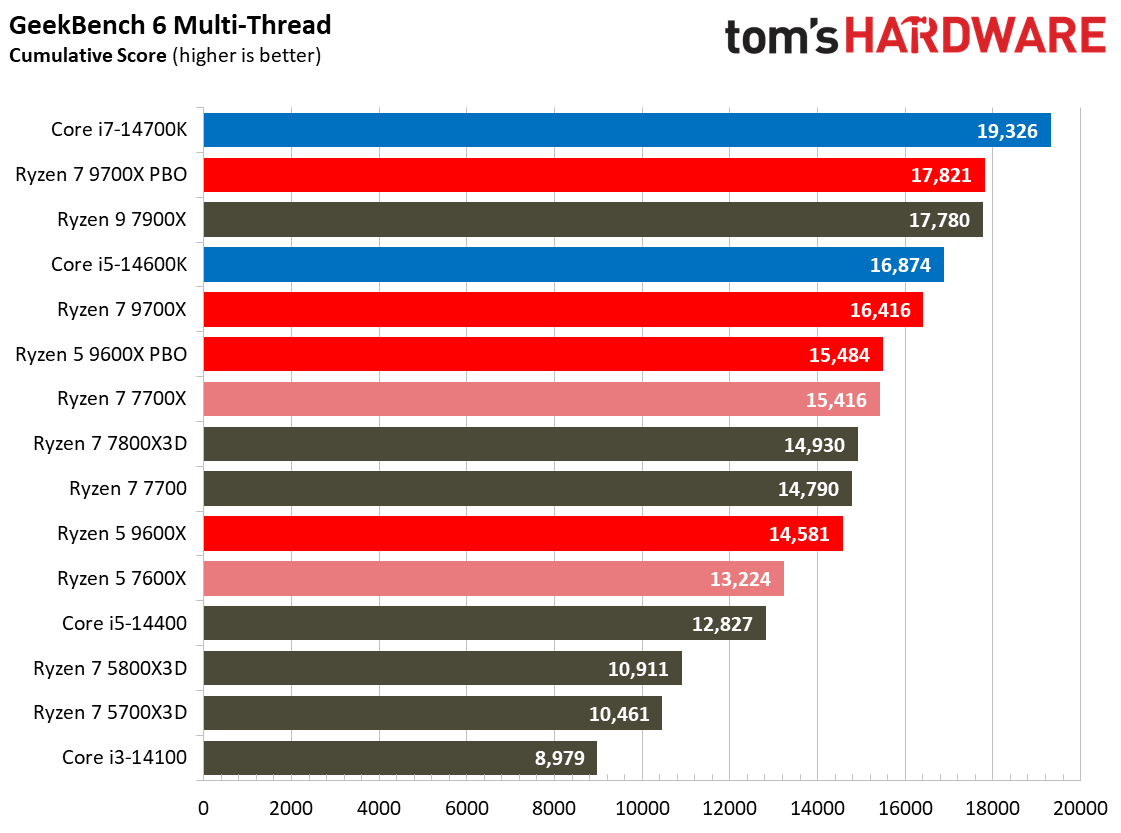
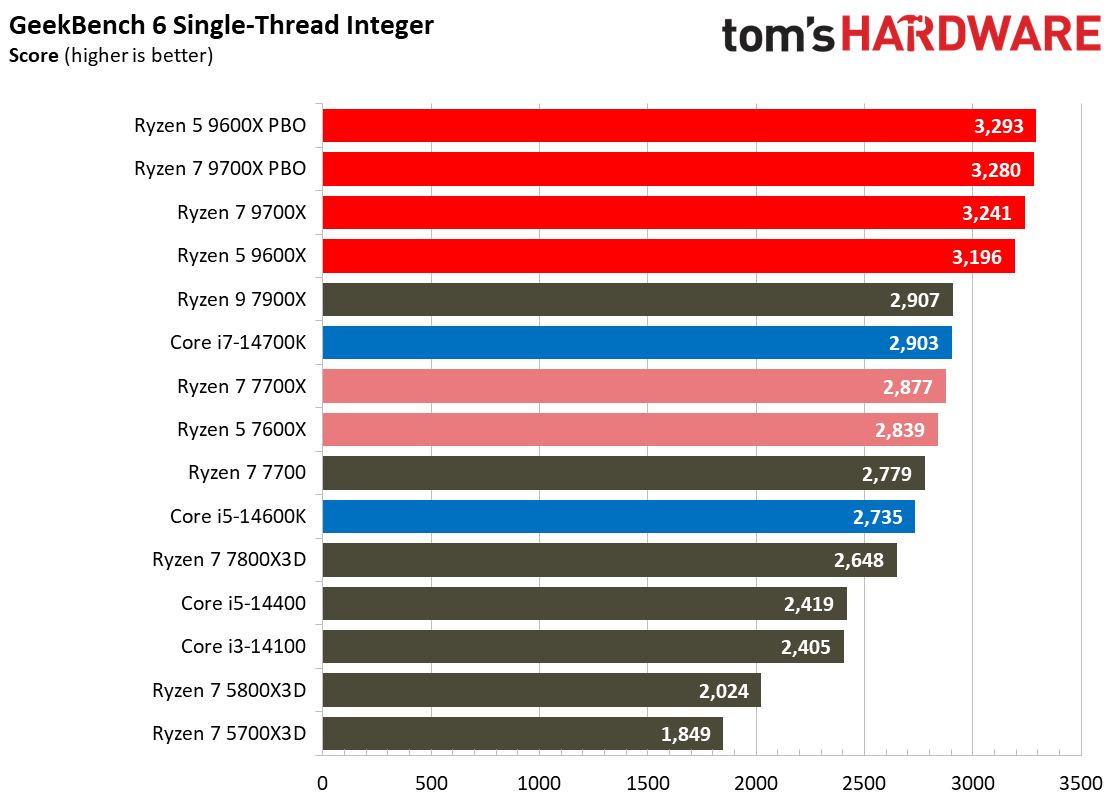
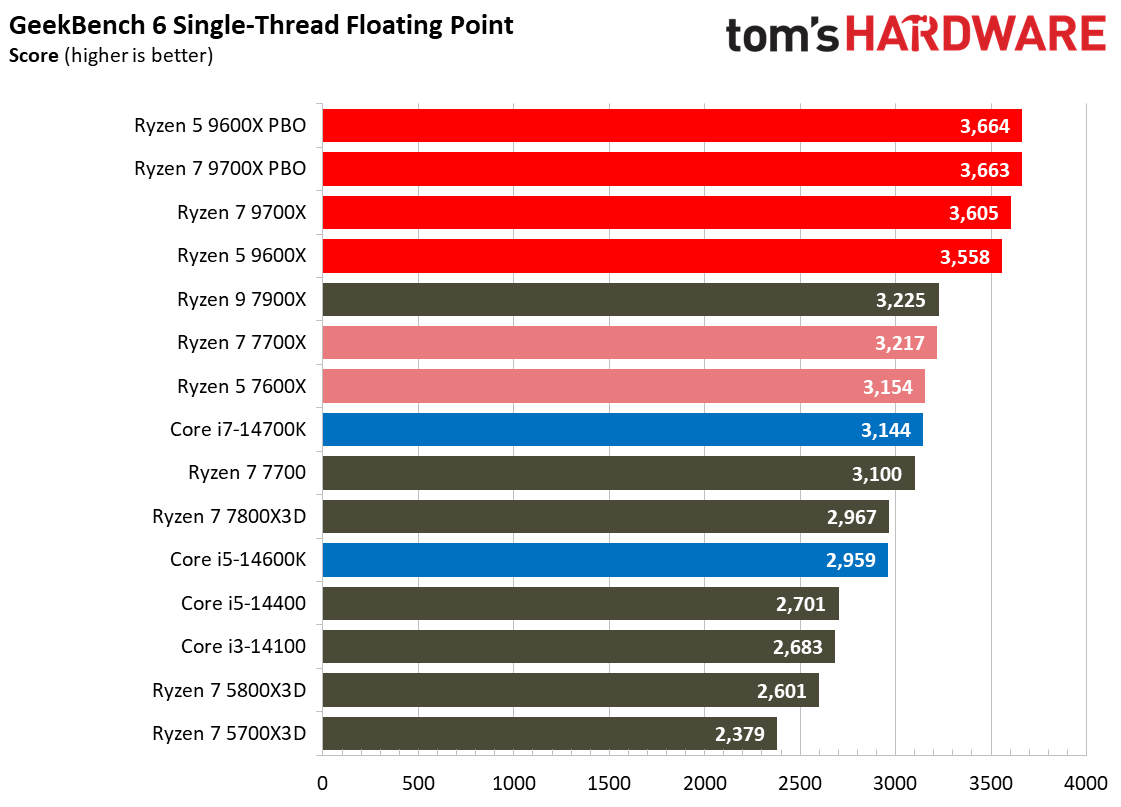
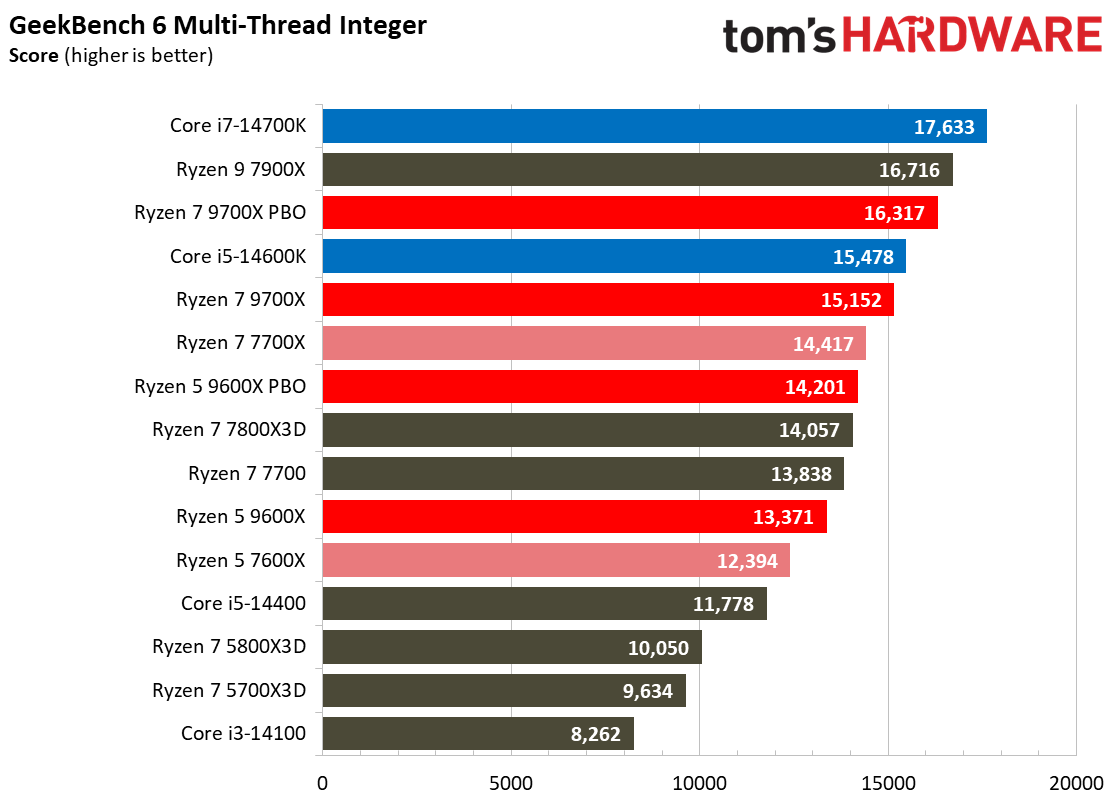
We boil down productivity application performance into two broad categories: single- and multi-threaded. These slides show the geometric mean of performance in several of our most important tests in each of these categories, but be sure to look at the expanded results below for more granular analysis.
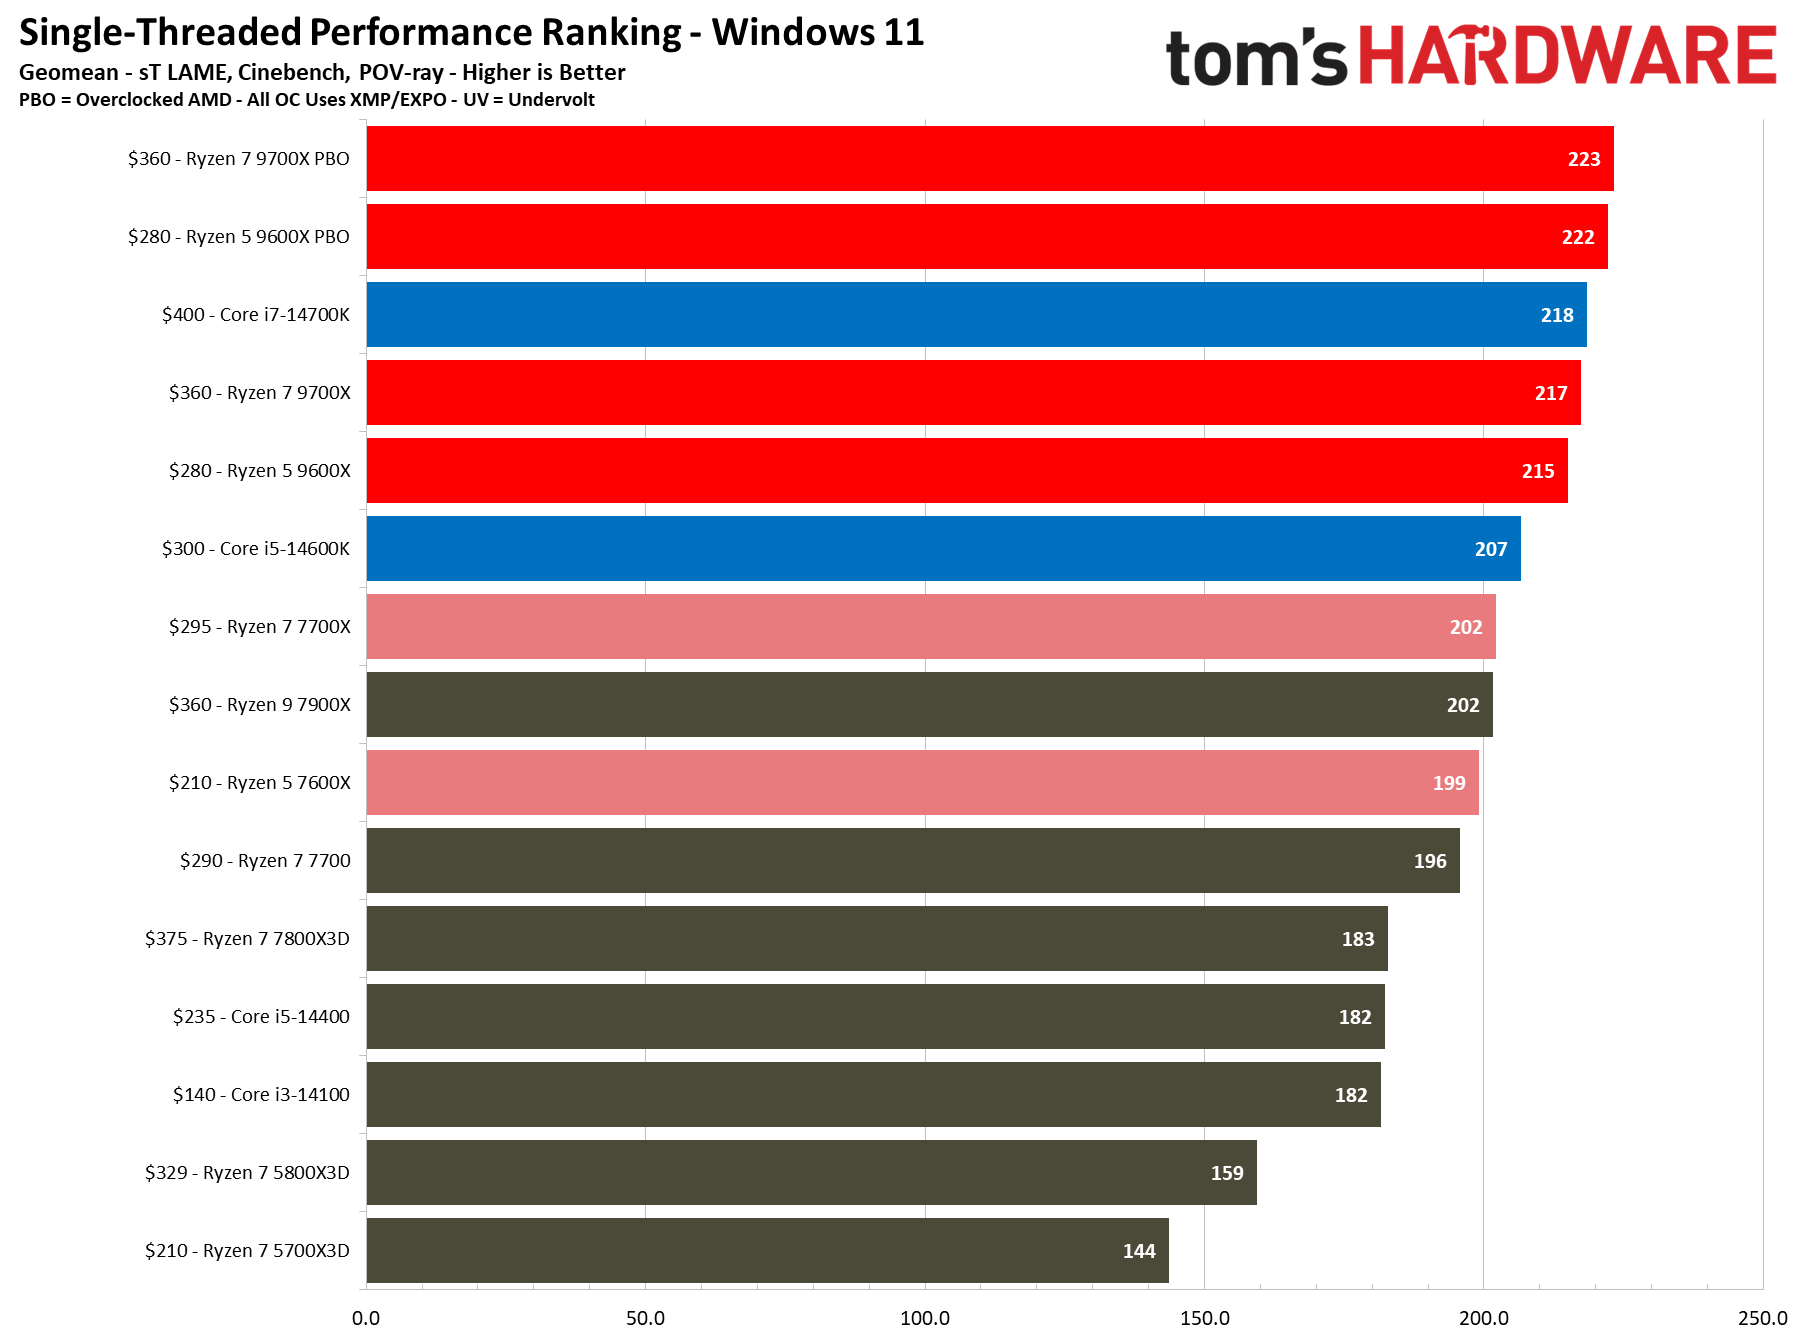
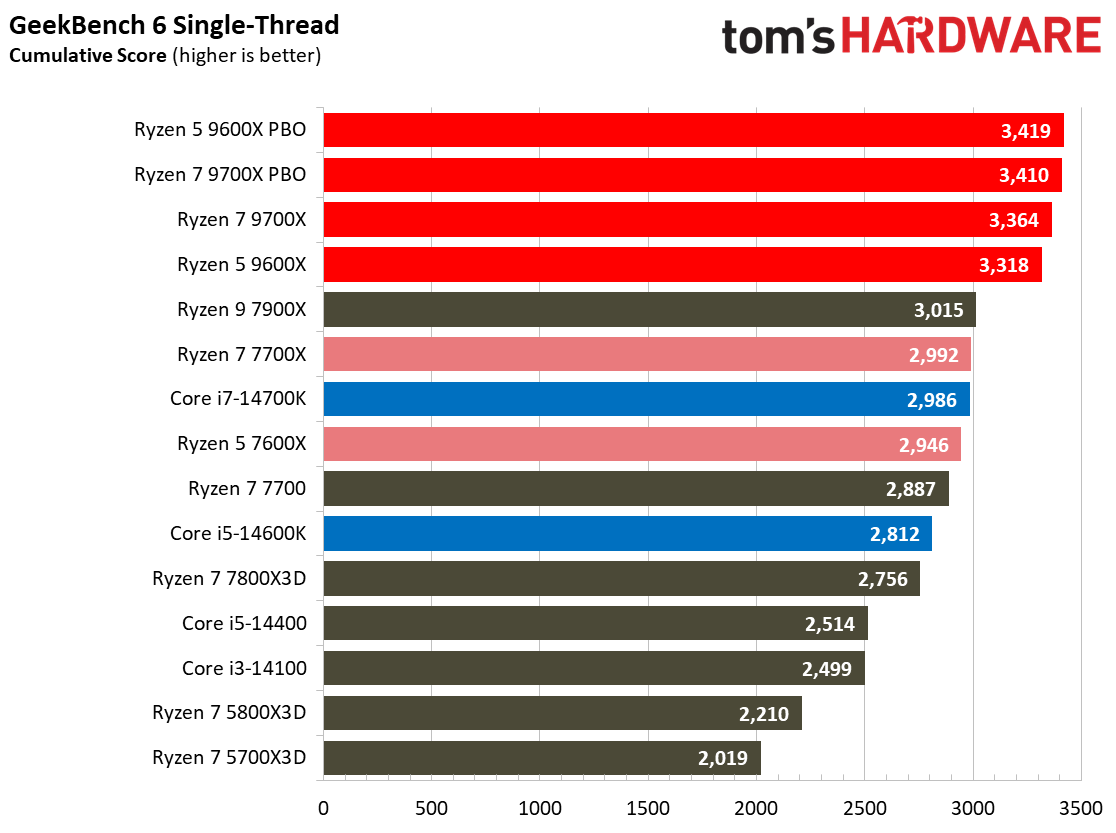
The Ryzen 5 9600X and Ryzen 7 9700X deliver solid generational gains in single-threaded performance, matching or exceeding the price-comparable Intel models. The Ryzen 5 9600X is 8% faster in our cumulative measure of single-threaded performance than the prior-gen Ryzen 5 7600X and 4% faster than the Core i5-14600K. The Ryzen 7 9700X is 7% faster than the prior-gen Ryzen 7 7700X, and it trails the 14700K by a single point, or less than half a percent. That's close enough to call a tie. You'll also see plenty of examples in the benchmarks below where the Ryzen processors excel in mixed workloads (complex combined single- and multi-threaded workflows).
The Intel processors manage to keep their lead in our cumulative measure of heavily threaded productivity application performance, and often by large margins, but there are a few caveats of note (more on that below). The Core i5-14600K is 26% faster than the Ryzen 5 9600X in our cumulative measure of multi-threaded performance, while the 14700K is 41% faster than the Ryzen 7 9700X.
In threaded work, the Ryzen 5 9600X is 14% faster than the prior-gen 7600X, while the Ryzen 9 9700X is 7% faster than its prior-gen comparable, the Ryzen 7 7700X. Again, that's while consuming quite a bit less power, so the generational efficiency gains are even more impressive.
While the Ryzen 7 5800X3D and 5700X3D are exceptional in our gaming benchmarks, rivaling the Ryzen 9000 chips at a lower price point, pay attention to the huge disparities in application performance with these Zen 3 chips. Both Ryzen 9000 models are around 35% faster in single-threaded work than the 5800X3D. The 9600X is also 18% faster in threaded workloads than the 5800X3D, while the 9700X is 45% more performant. The deltas aren't quite as large with the 7800X3D, but even this Zen 4 gaming beast doesn't perform as well as standard chips in productivity apps.
We couldn't match AMD's guideline score for the multi-threaded Cinebench 2024 benchmark, lagging their reported score by roughly 5% for the 9600X and 9700X. However, our Cinebench 23 scores were within the expected variance. Cinebench 2024's sensitivity to memory throughput may impact the score — AMD's tests for the reviewer's guide use a DDR5-6000 EXPO profile for its 'stock' configurations. In contrast, we use the officially supported AMD spec of DDR5-5600. We retested with a DDR5-6000 EXPO profile and reduced the disparity to a more acceptable -2.5%, but the impact of the stock settings is included in the above geometric mean. As such, pay extra attention to the scores in the individual benchmarks below.
The slides above show the impact of the DDR5-6000 EXPO memory profile and the auto-overclocking PBO feature. Engaging this combo yielded a 9% improvement for the 9600X in the threaded benchmarks, bringing it within 15% of the stock 14600K config. The Ryzen 7 9700X also profits nicely from tuning, gaining 14% more performance in threaded work, reducing its deficit to the 14700K to 24%.
Intel's chips can overclock, too — at least normally. Unfortunately, given the current state of Intel's silicon, presenting overclocked benchmarks with the 14600K and 14700K could be misleading. However, be aware that the company intends to fix its issues with a microcode patch, at which time we will add overclocked test results.
The AMD chips also get an uplift in single-threaded work from PBO tuning — both chips get around 3% more performance from engaging PBO.
Rendering Benchmarks on AMD Ryzen 5 9600X
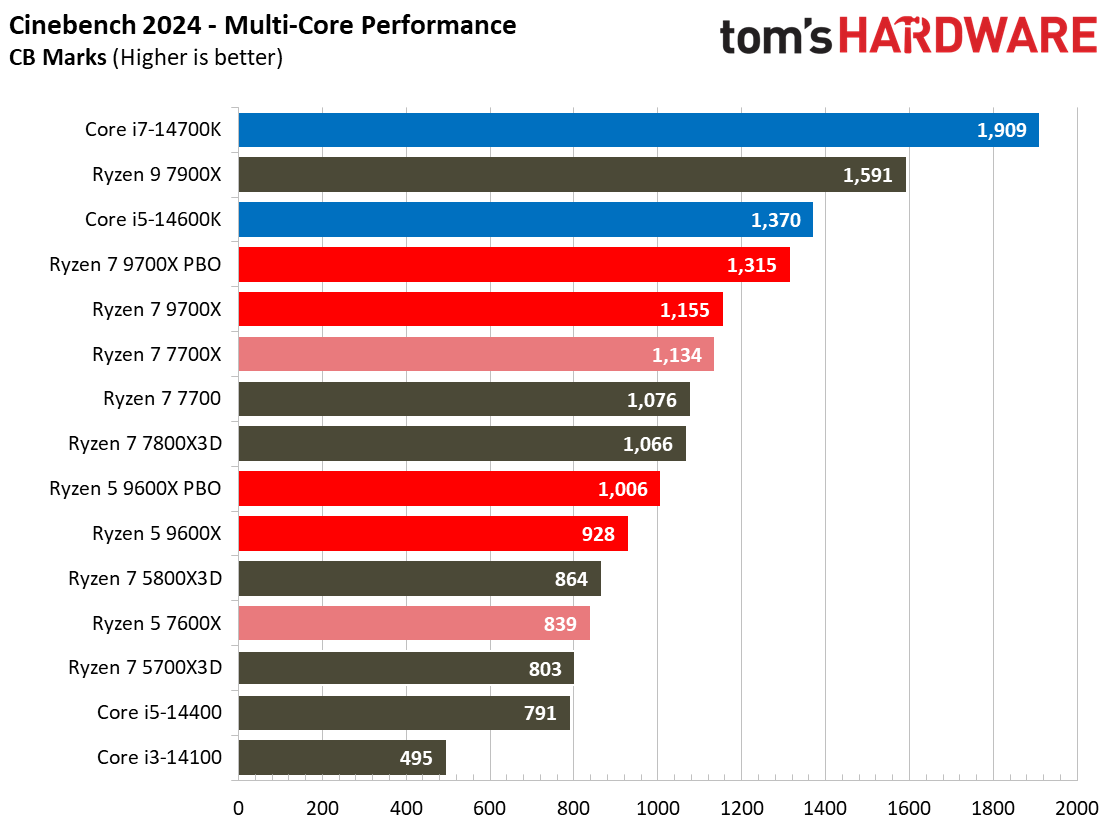
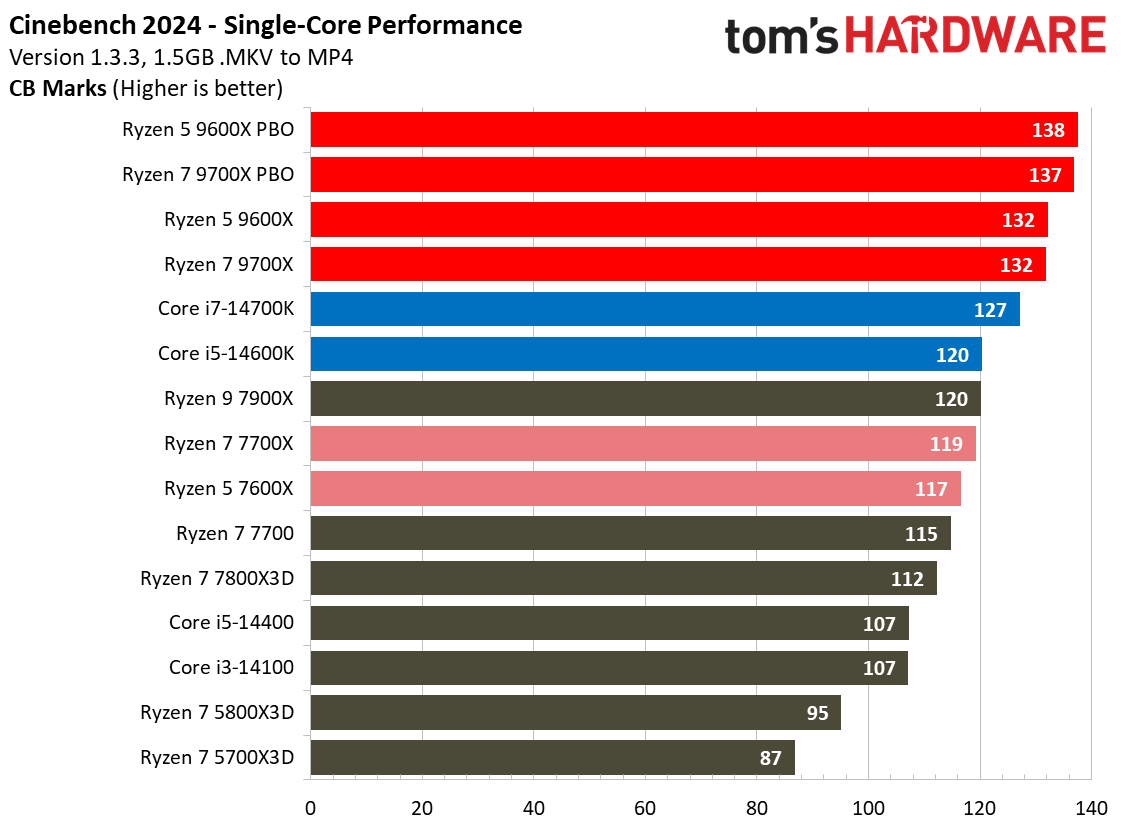
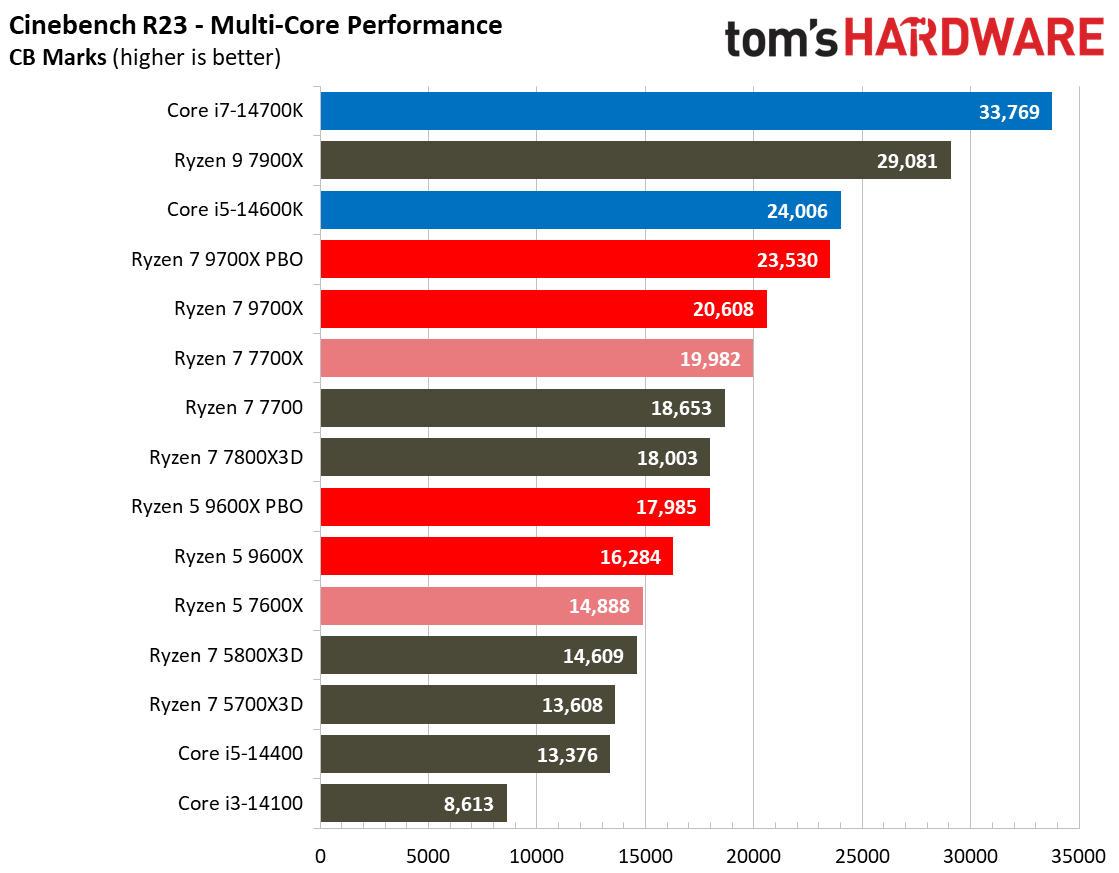
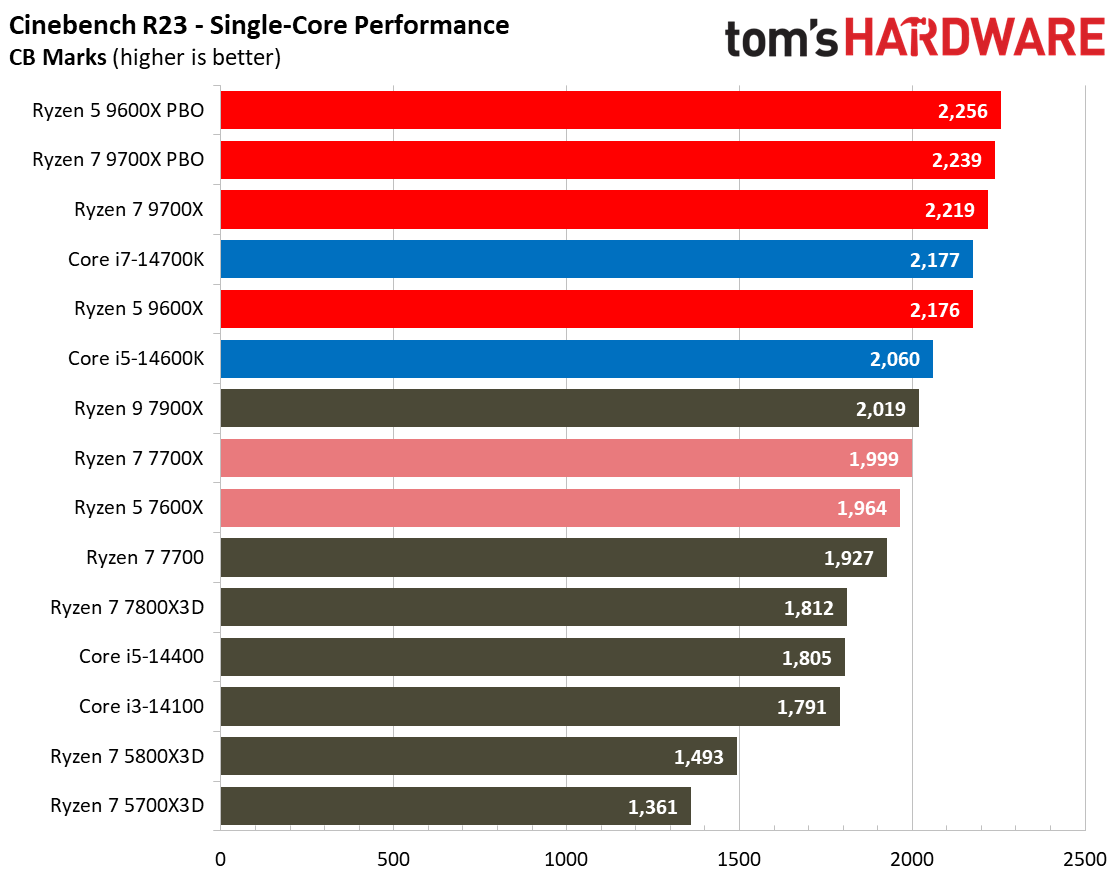
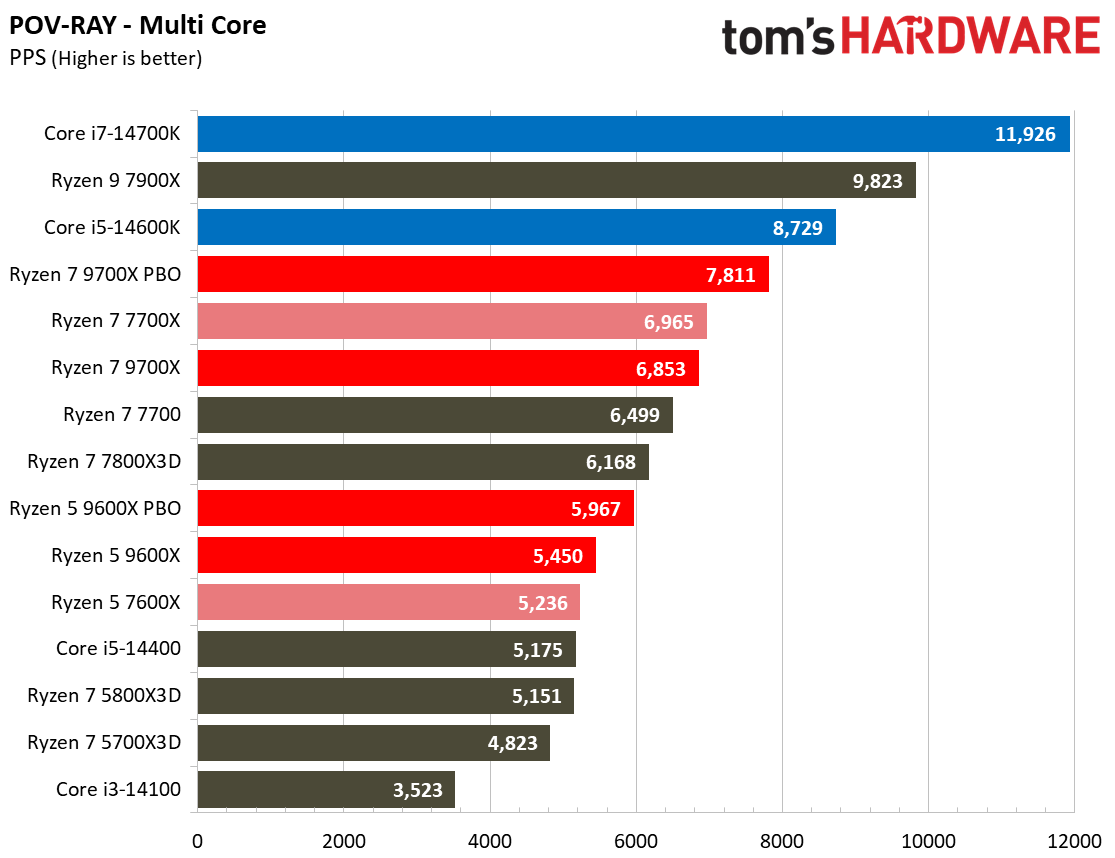
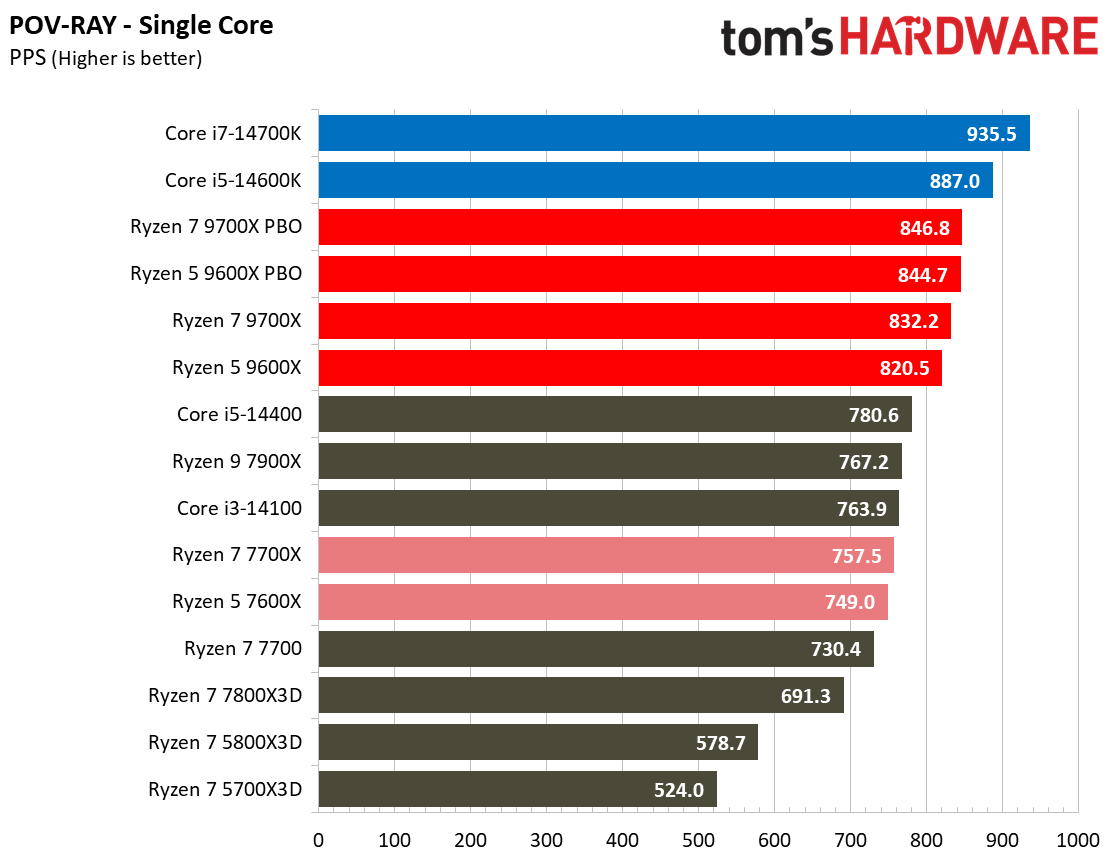
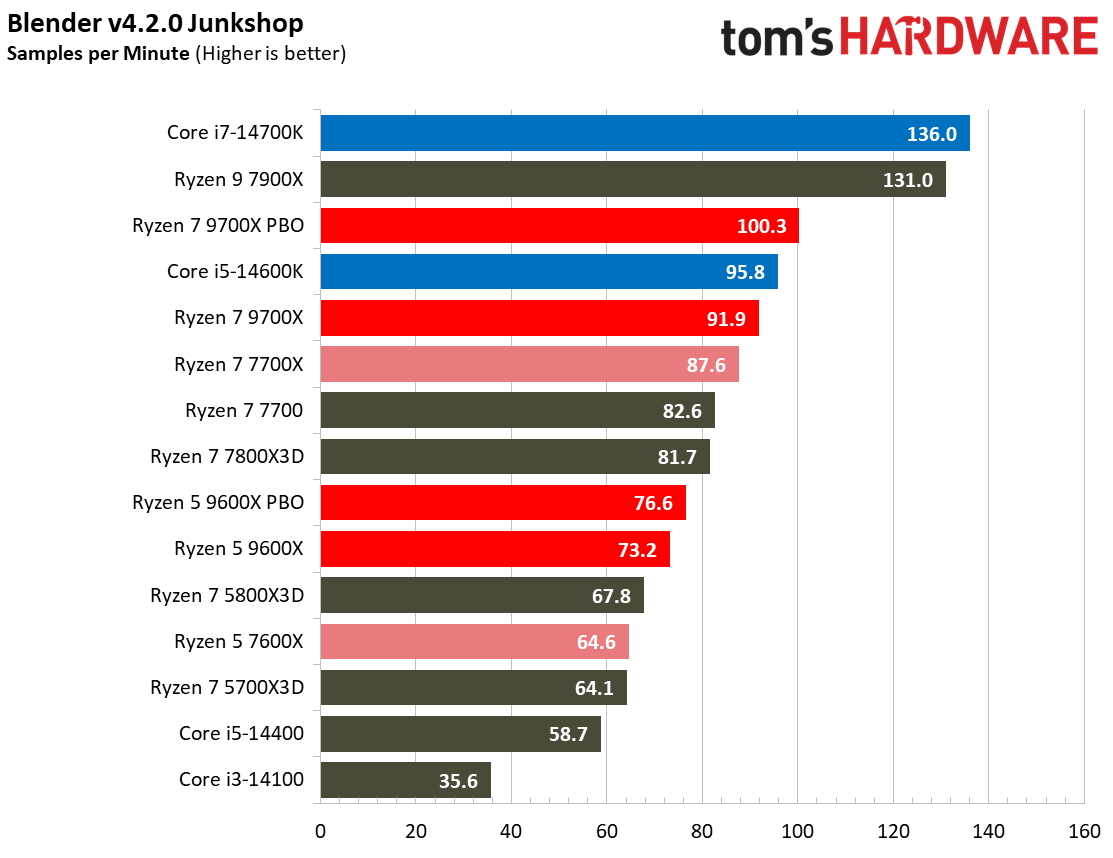
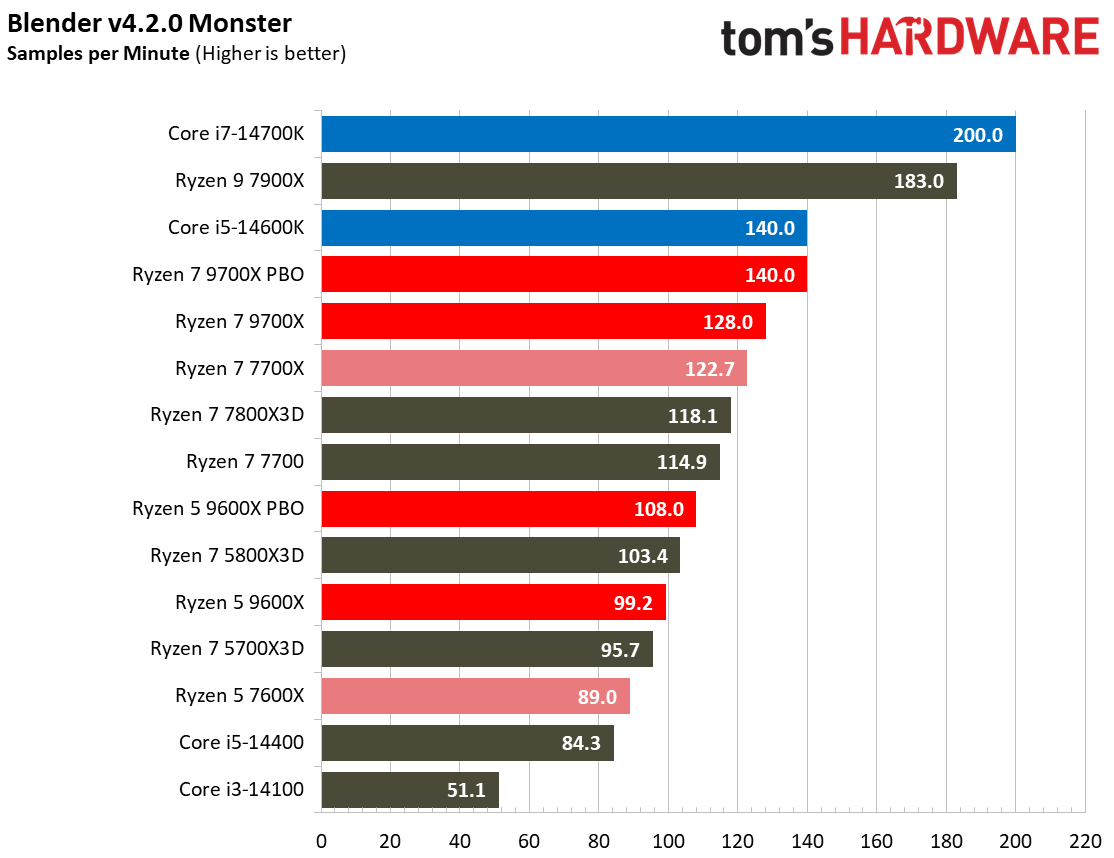
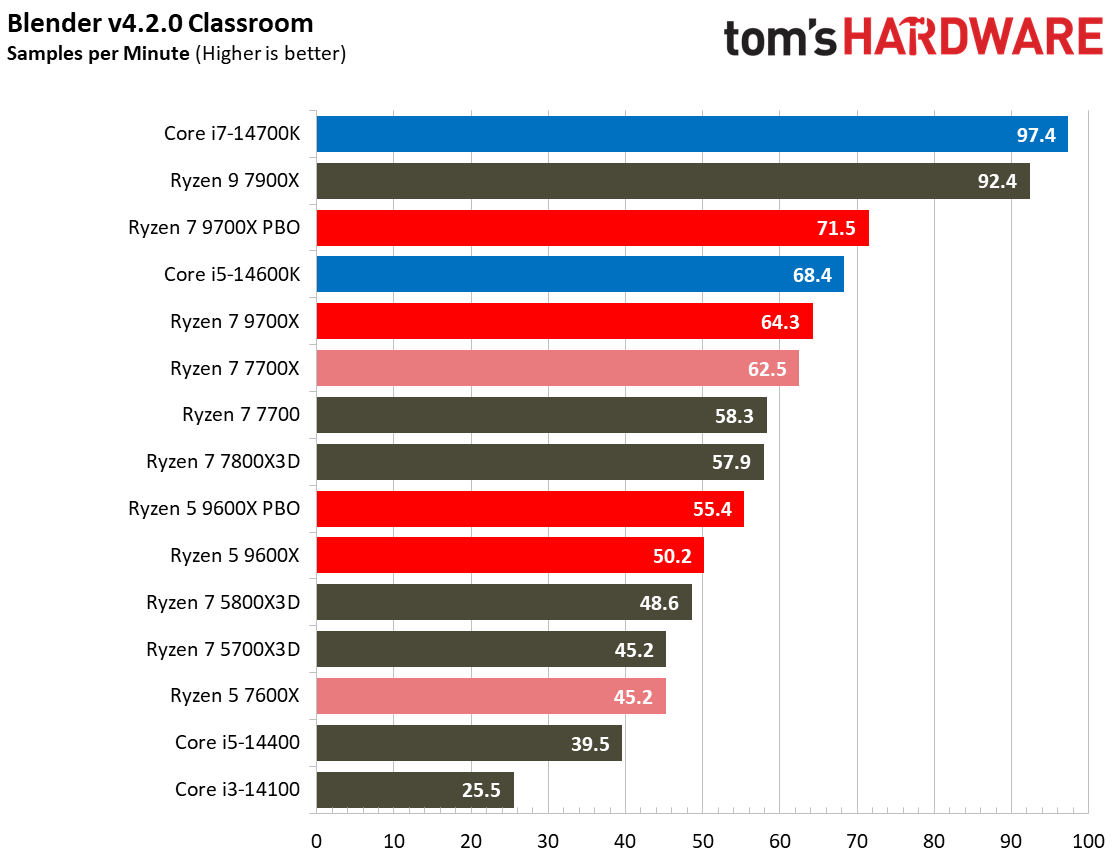
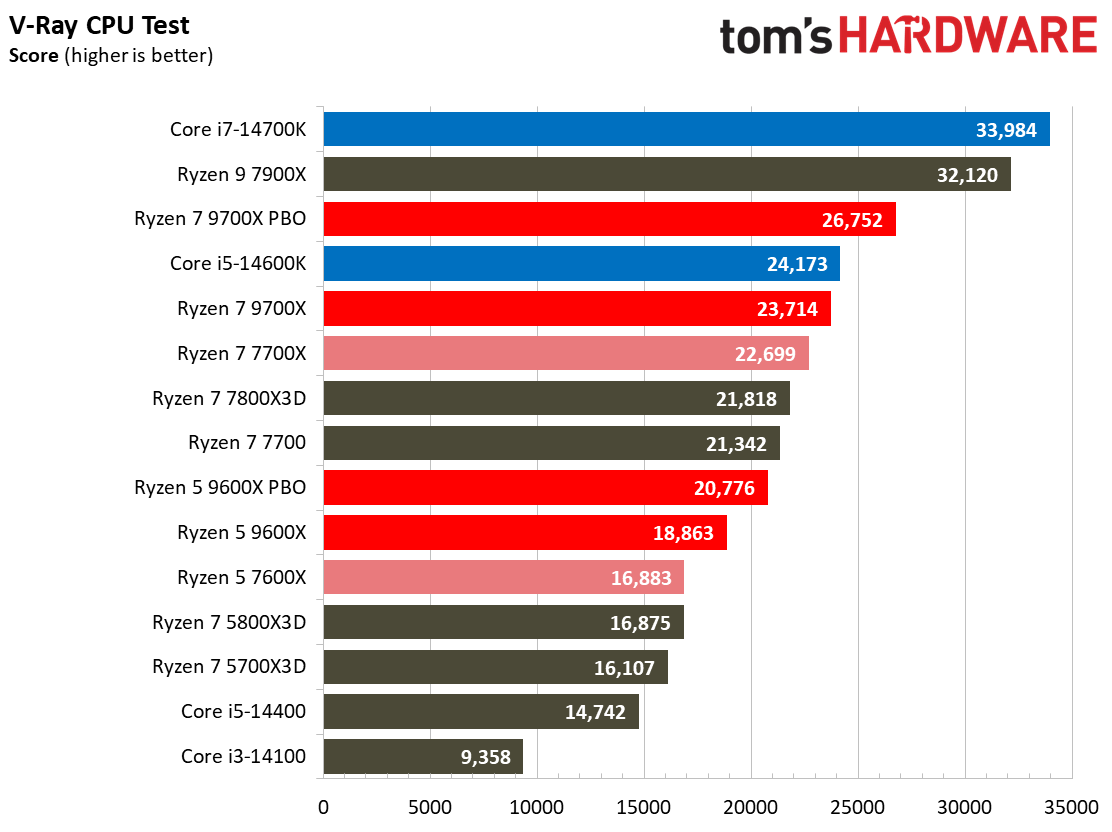
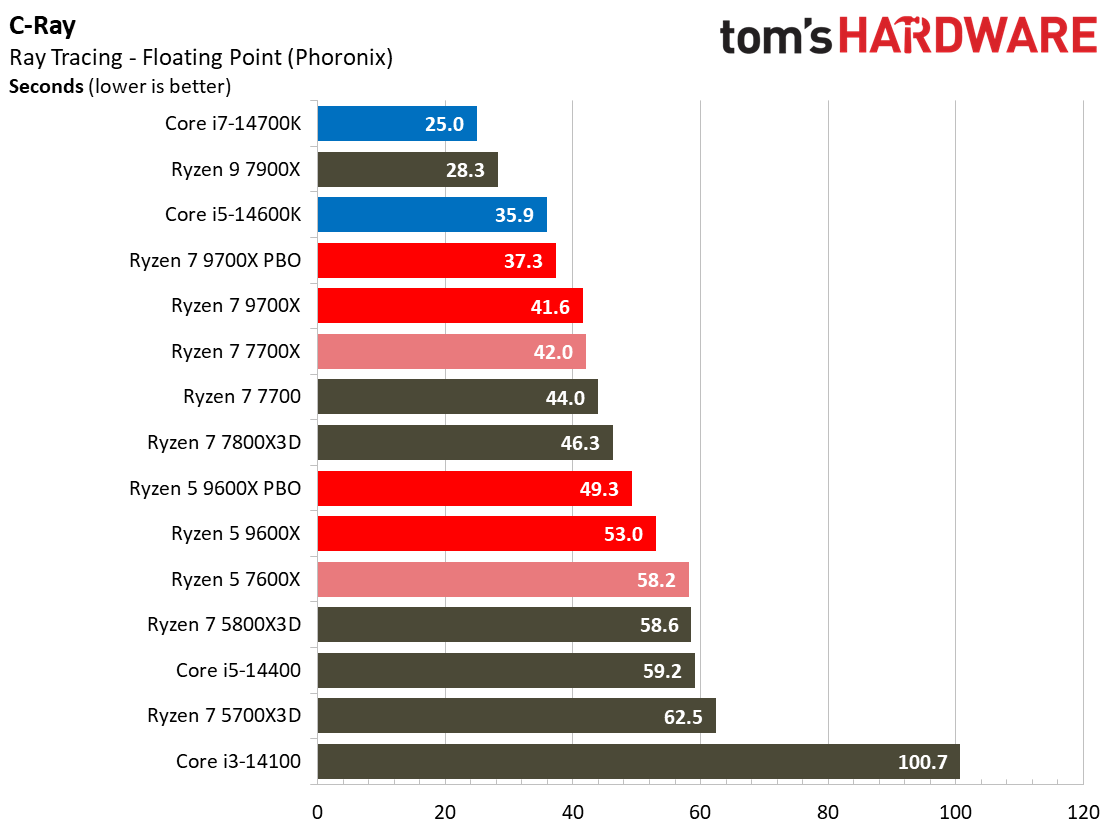
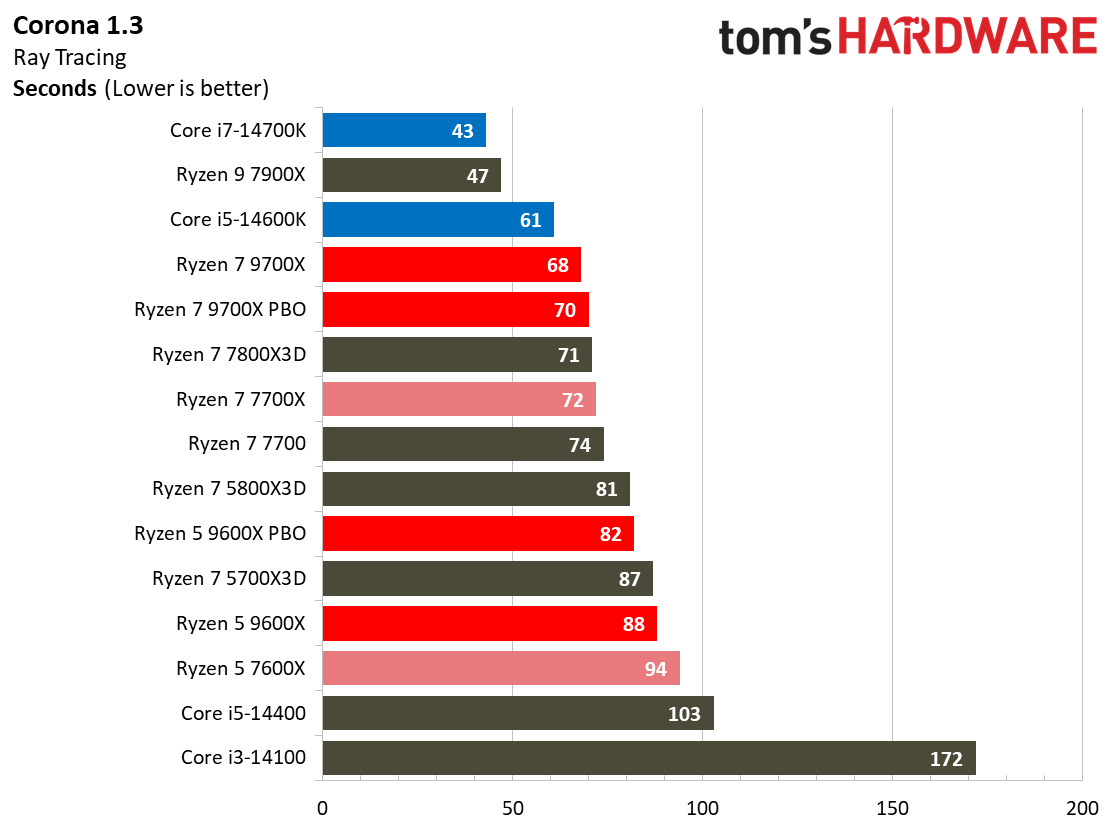
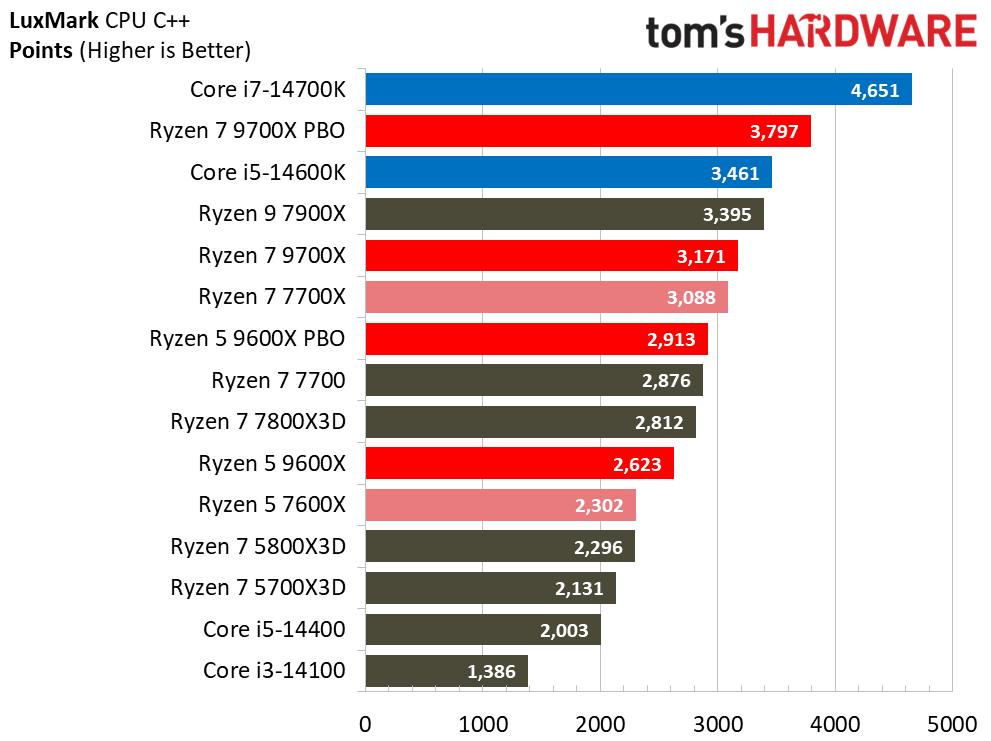
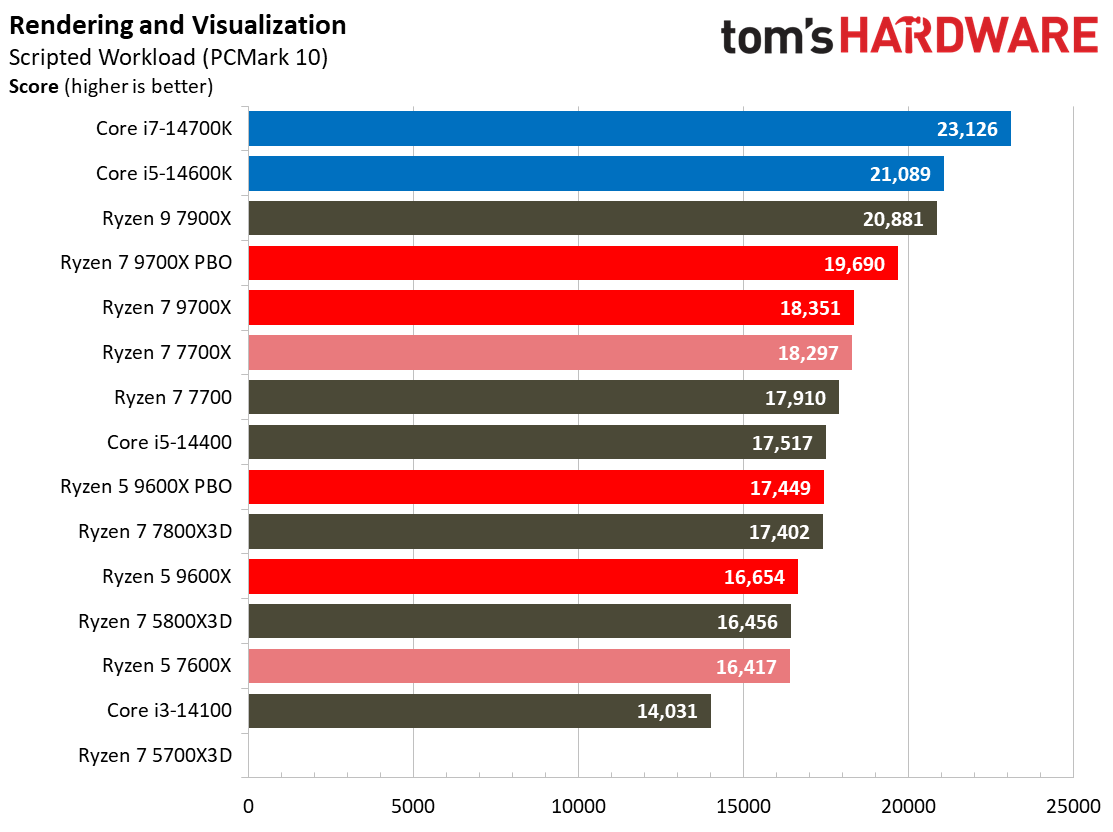
We've included test results for Cinebench 2024 and R23. Both show distinct advantages for AMD's chips in single-threaded rendering, while the multi-threaded benchmarks favor Intel. Intel excels in both single- and multi-threaded POV-Ray and is also performant in C-Ray, Corona, and the various Blender workloads.
Encoding Benchmarks on AMD Ryzen 5 9600X
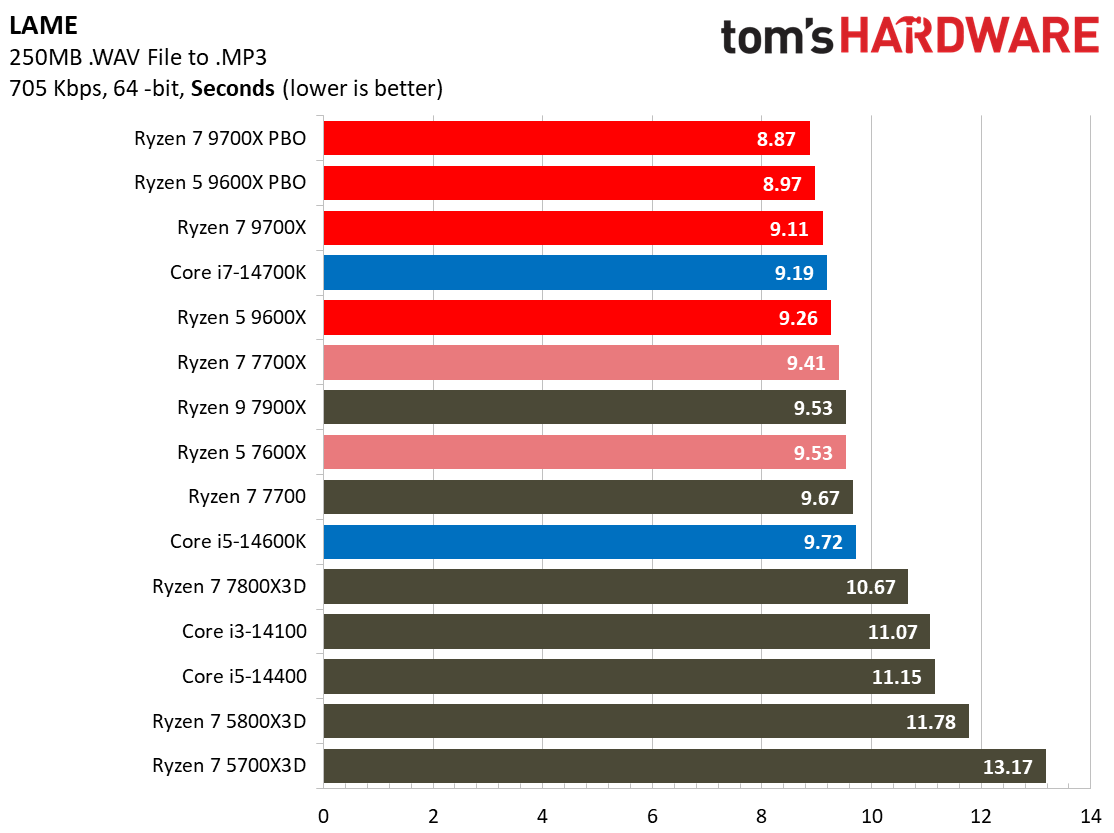
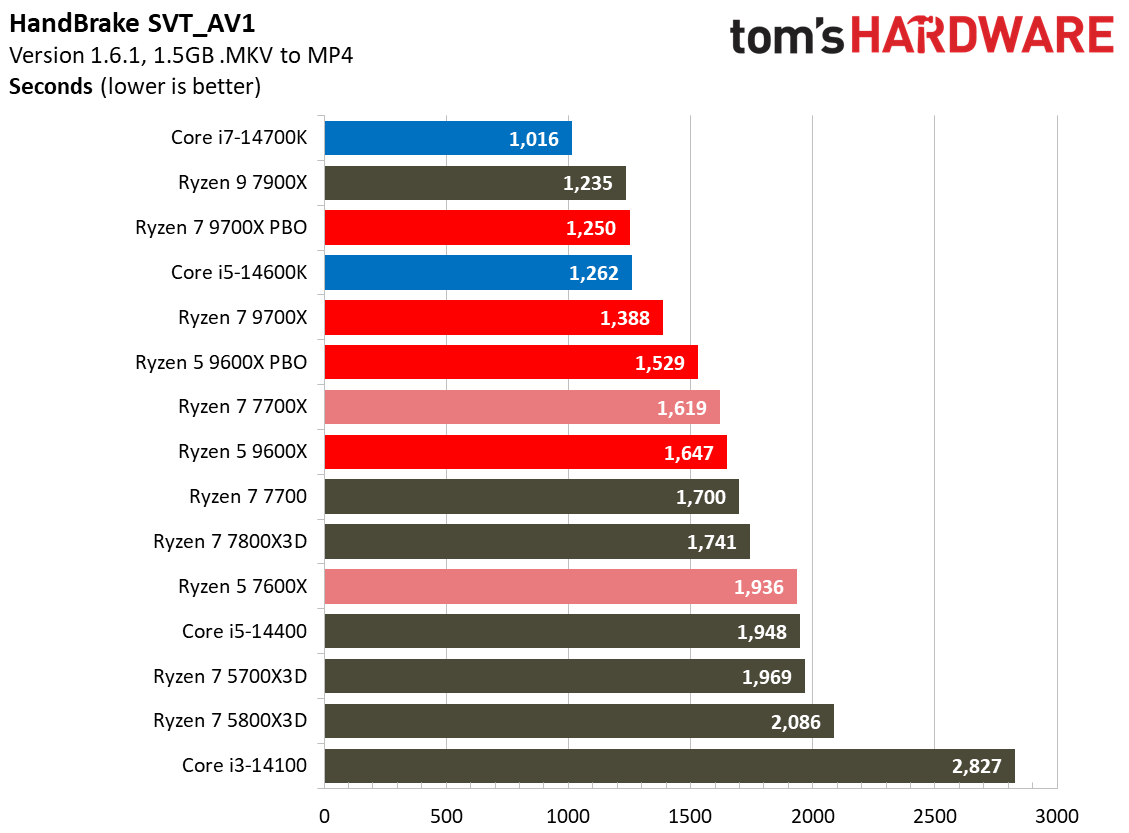
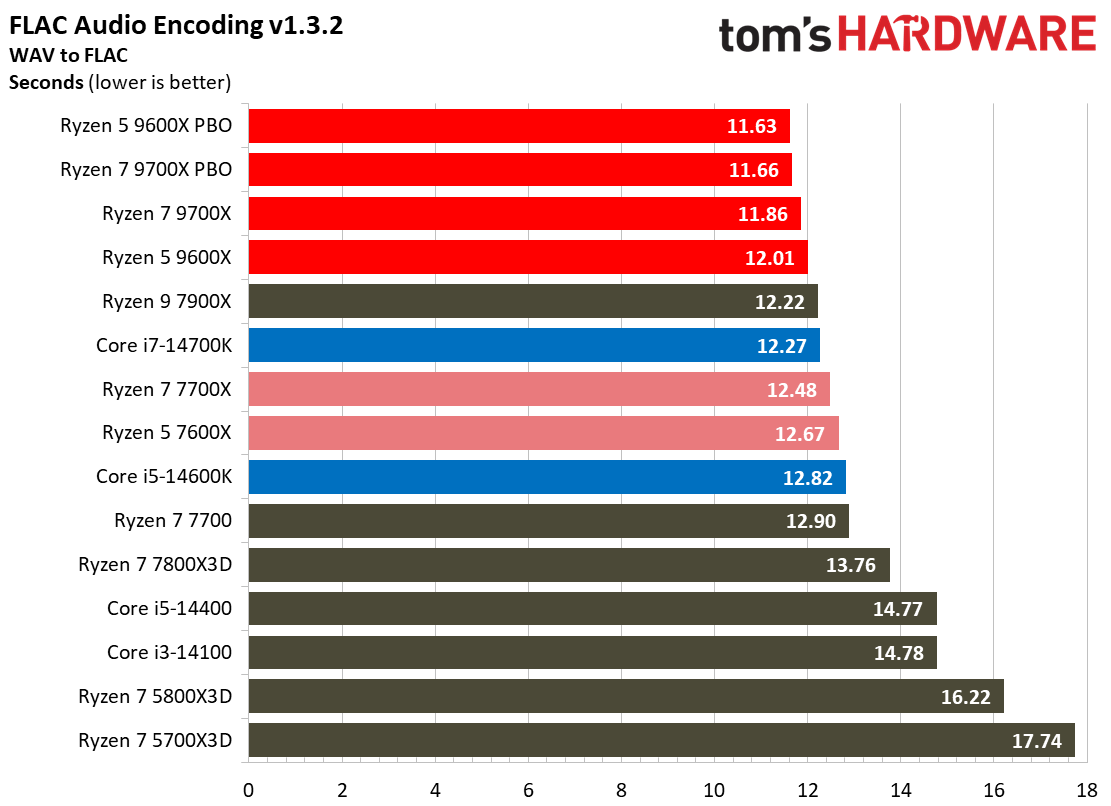
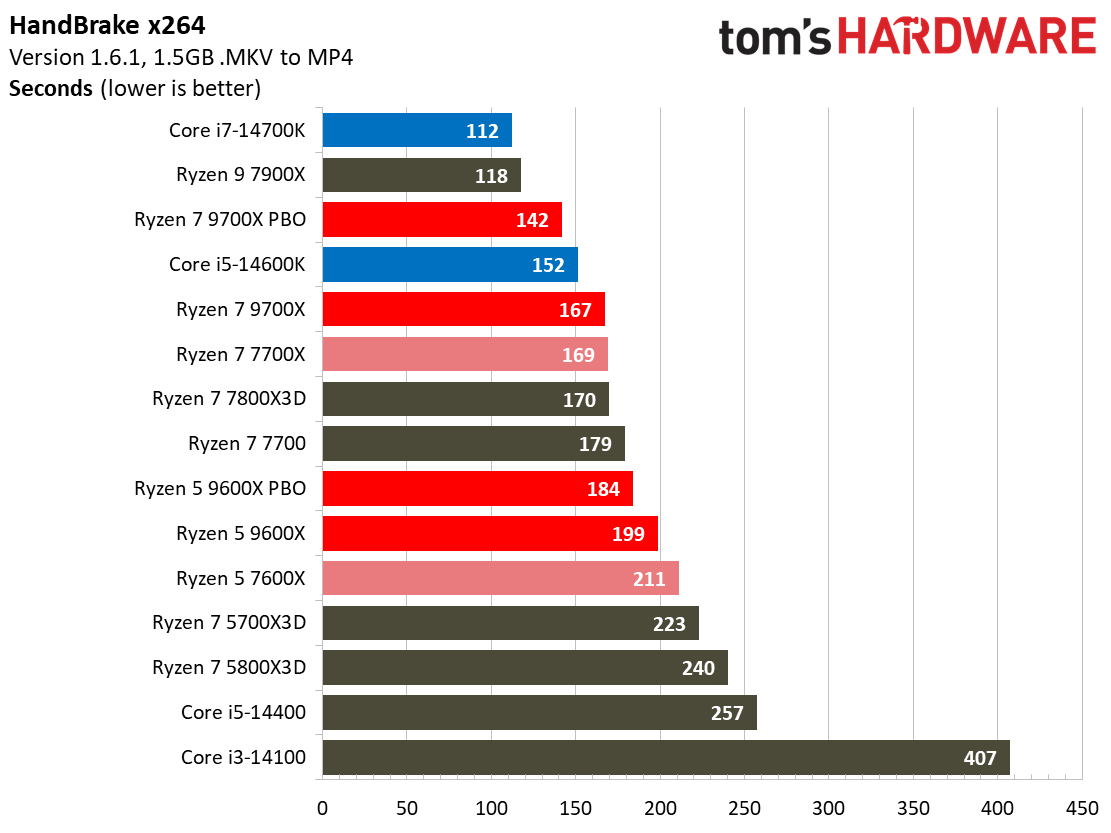
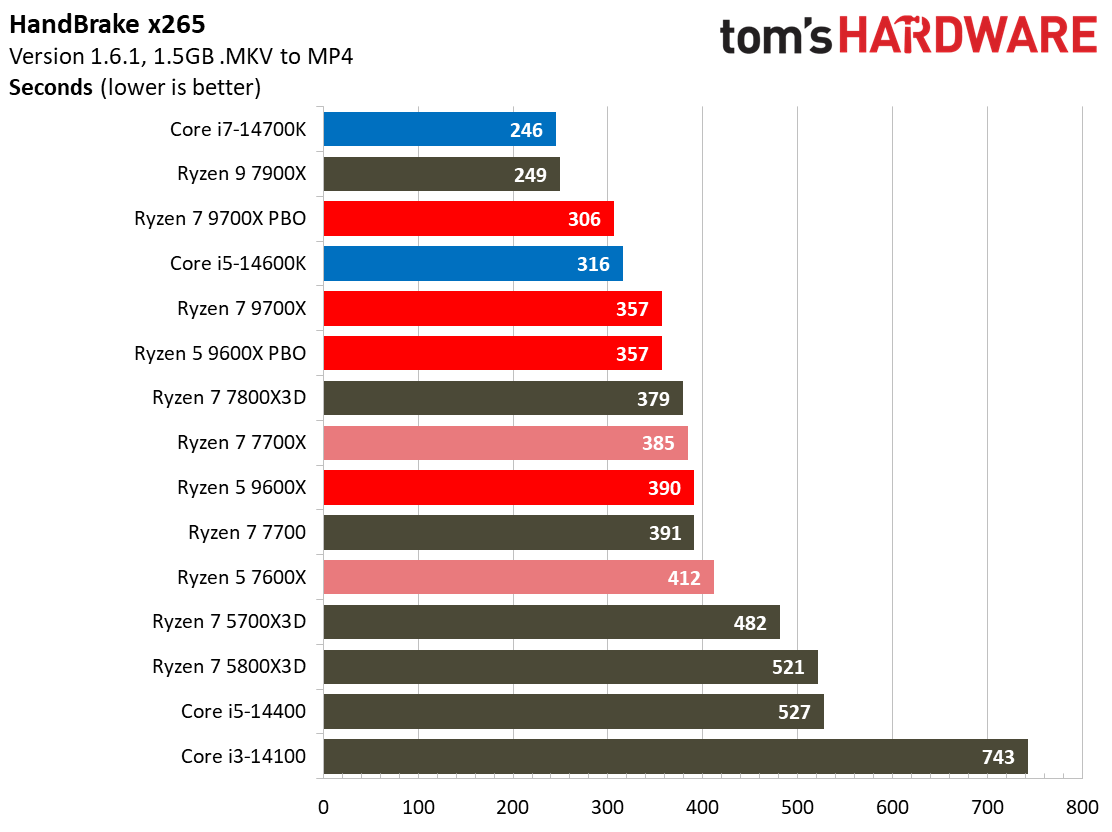
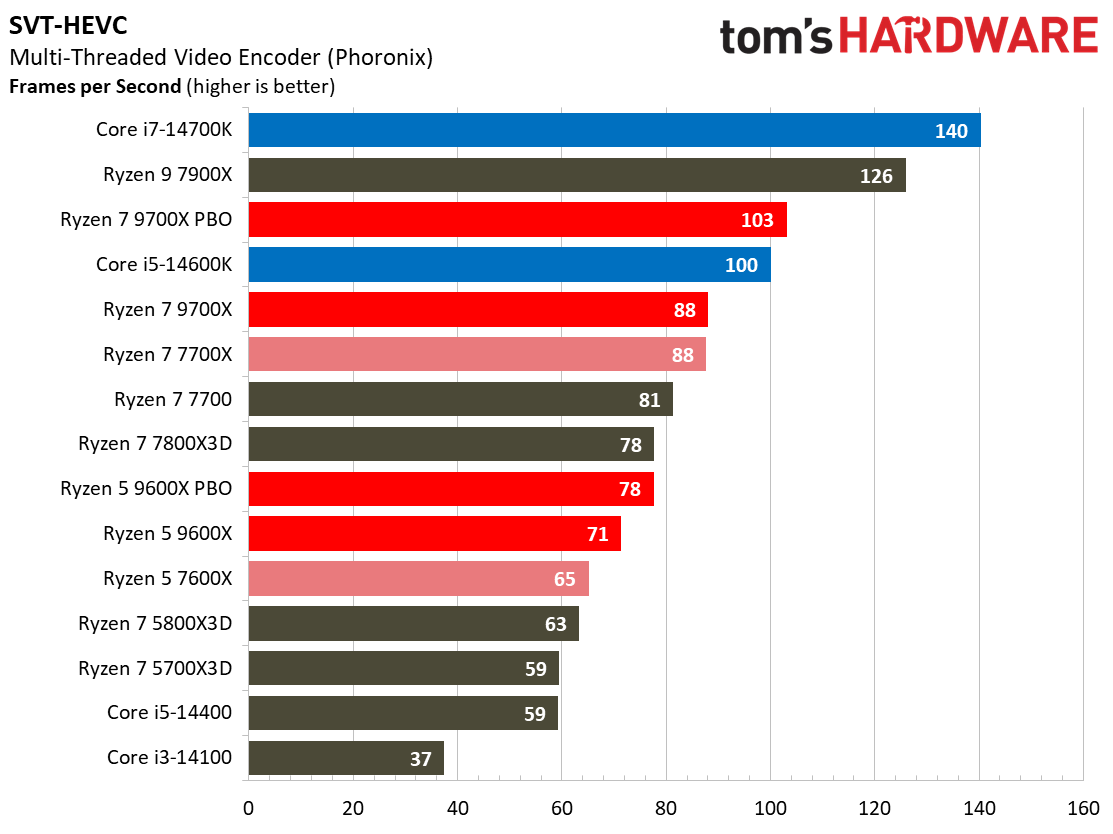
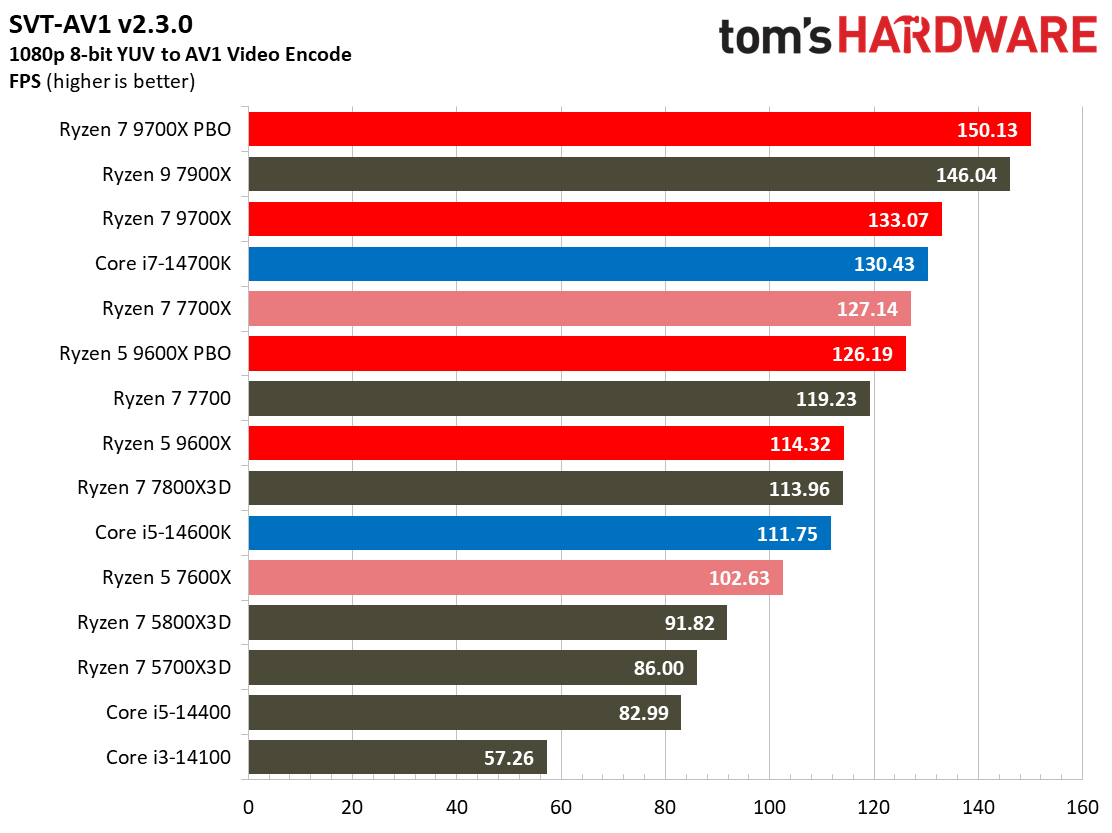
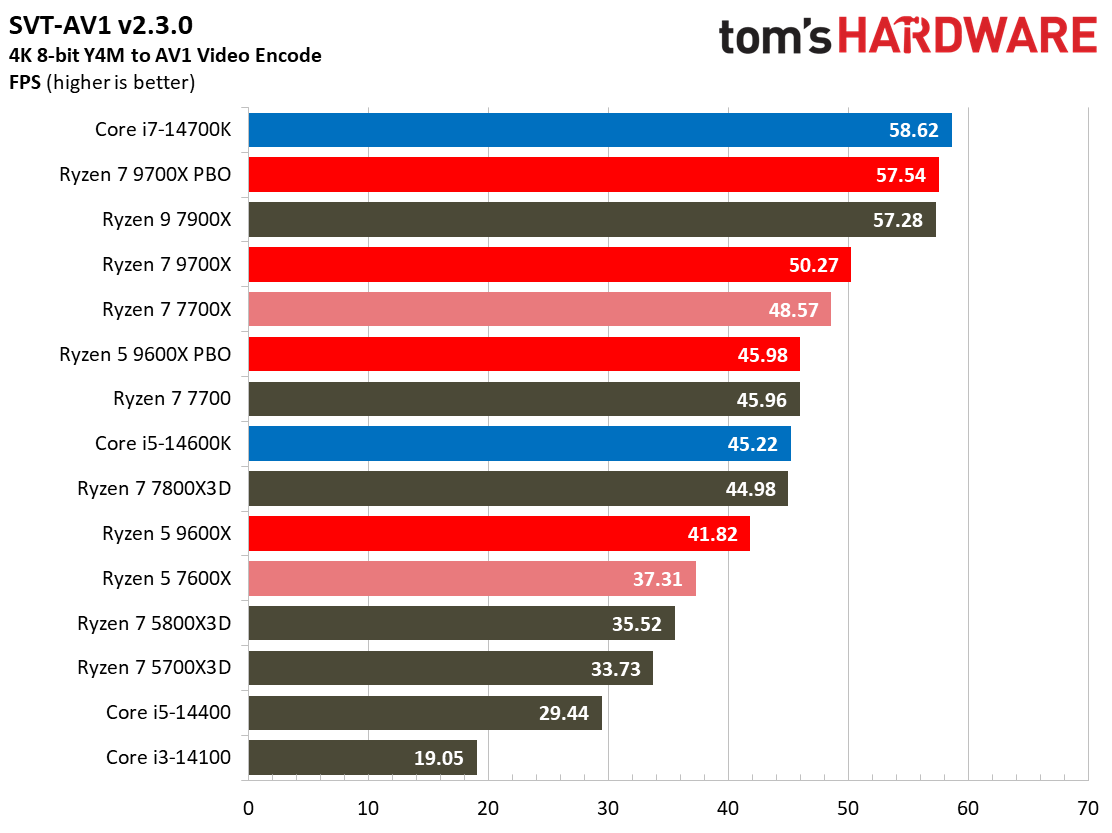
Our tests include single-threaded encoding benchmarks, like LAME and FLAC, but the SVT-AV1 and SVT-HEVC tests represent a newer class of threaded encoders. AMD takes the win in LAME, the quintessential single-threaded benchmark, and also excels in the FLAC and SVT-AV1 encoders. Intel also carves out plenty of wins, taking the lead in SVT-HEVC and Handbrake.
Office Workloads on AMD Ryzen 5 9600X
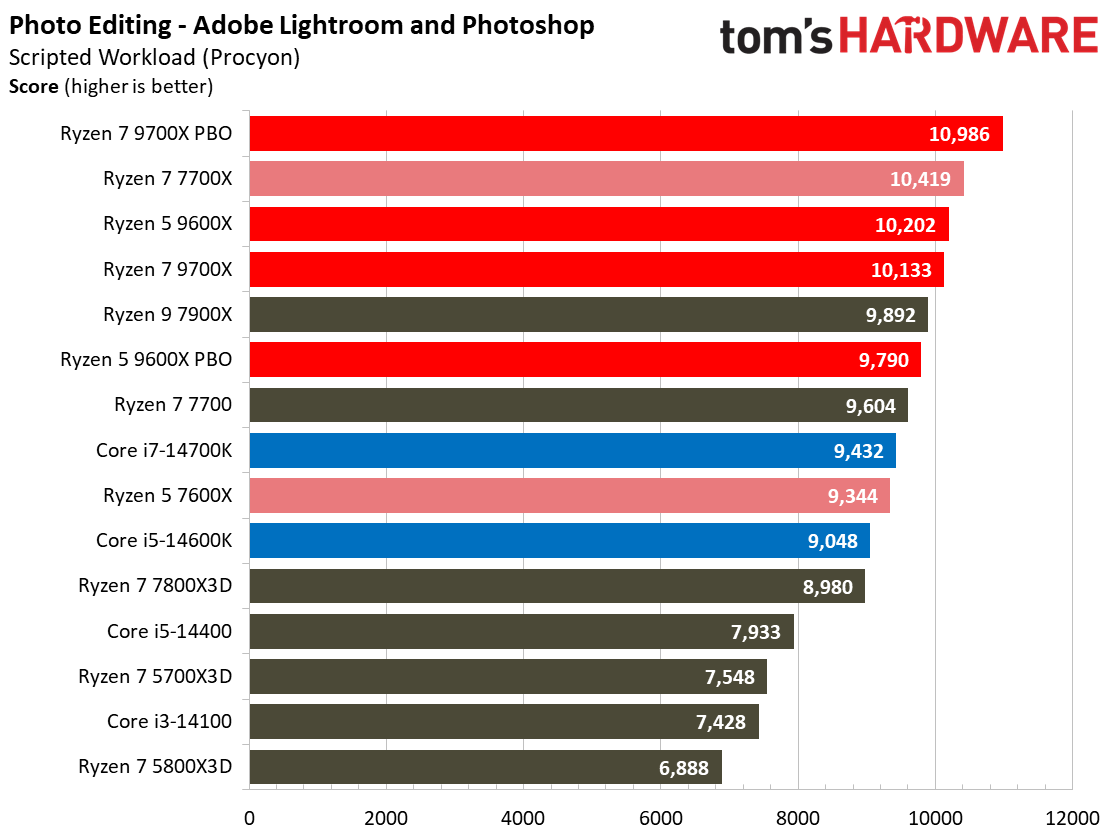
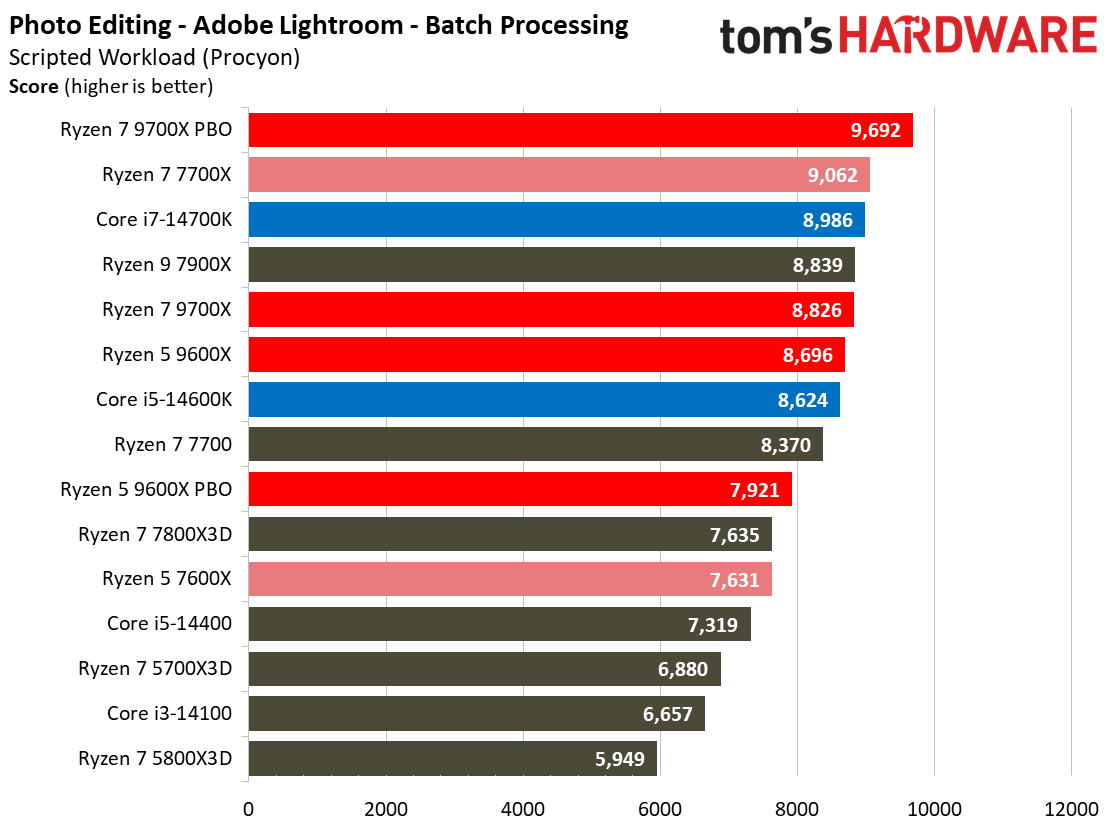
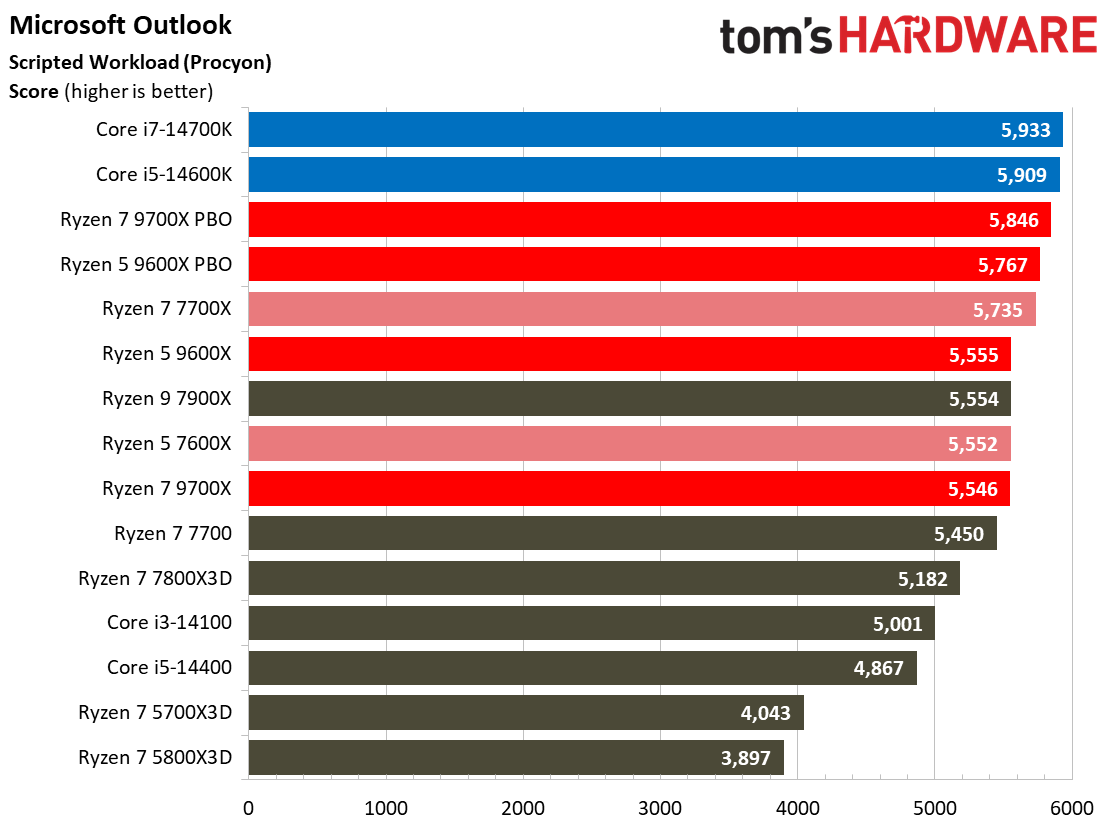
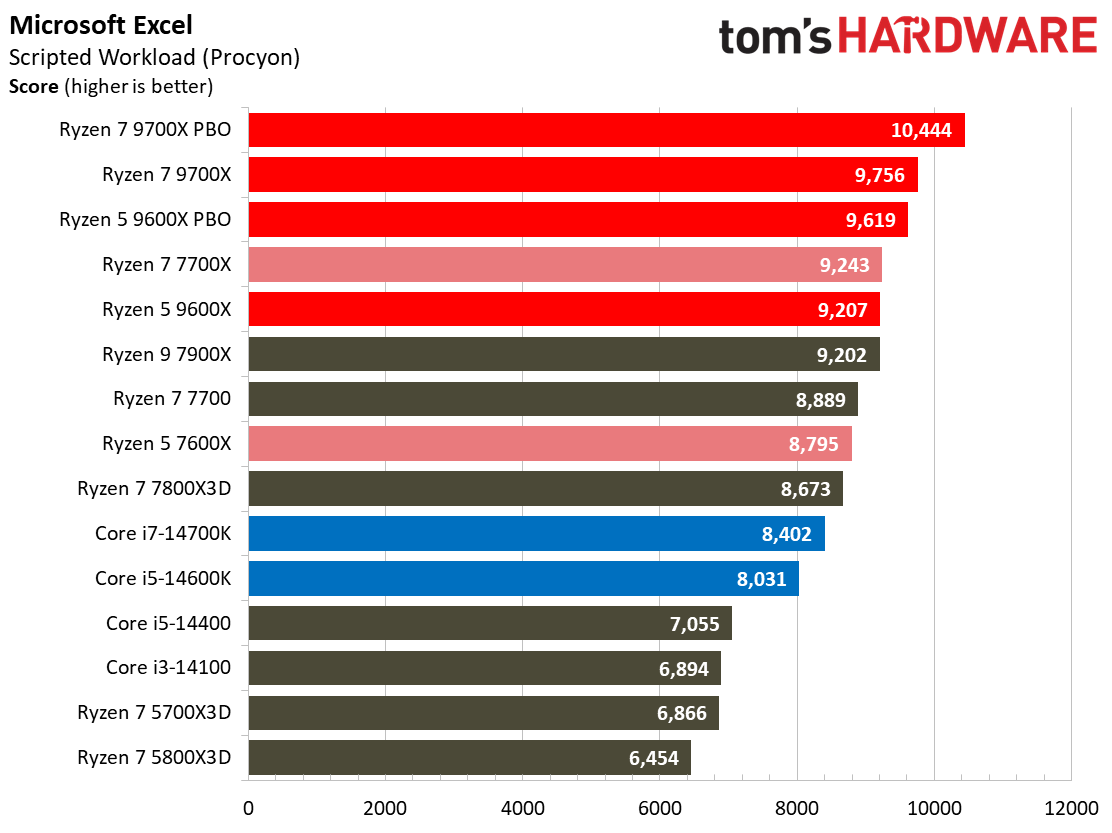
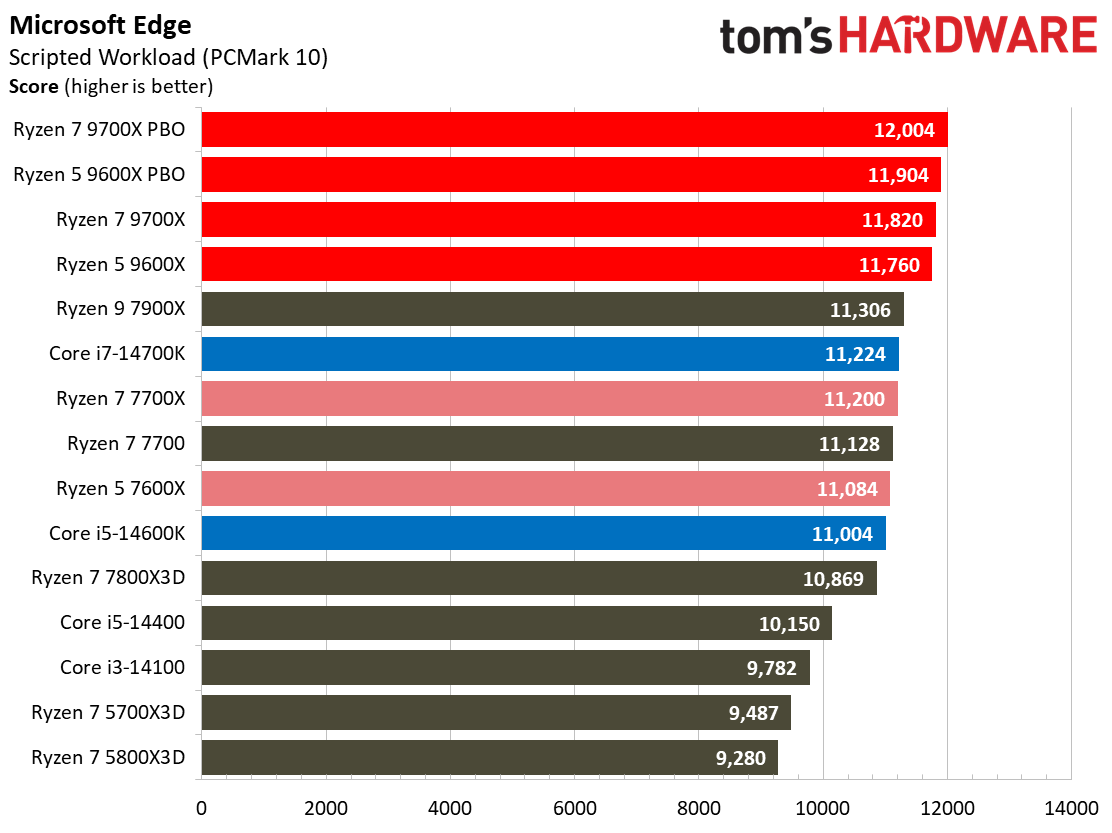
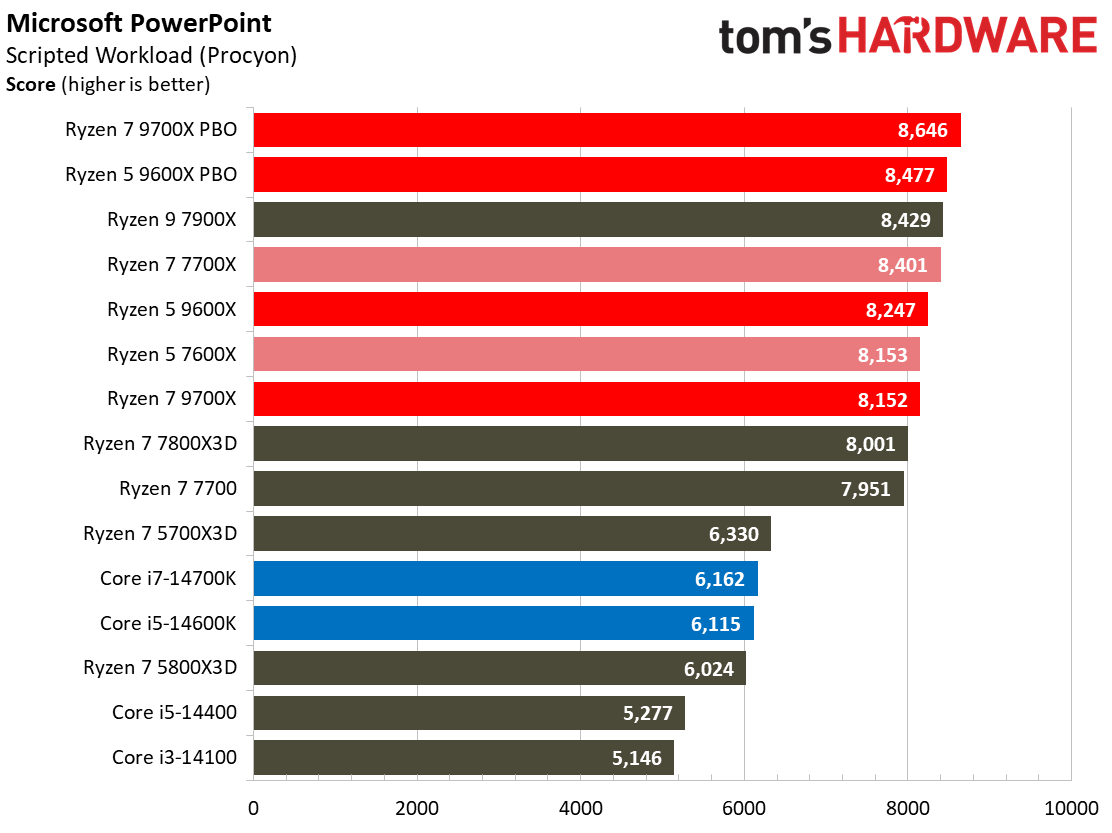
AMD scores substantial wins in the Procyon Adobe suite and also dominates the Microsoft Office and web browser benchmarks.
Compilation, Compression, AVX on AMD Ryzen 5 9600X
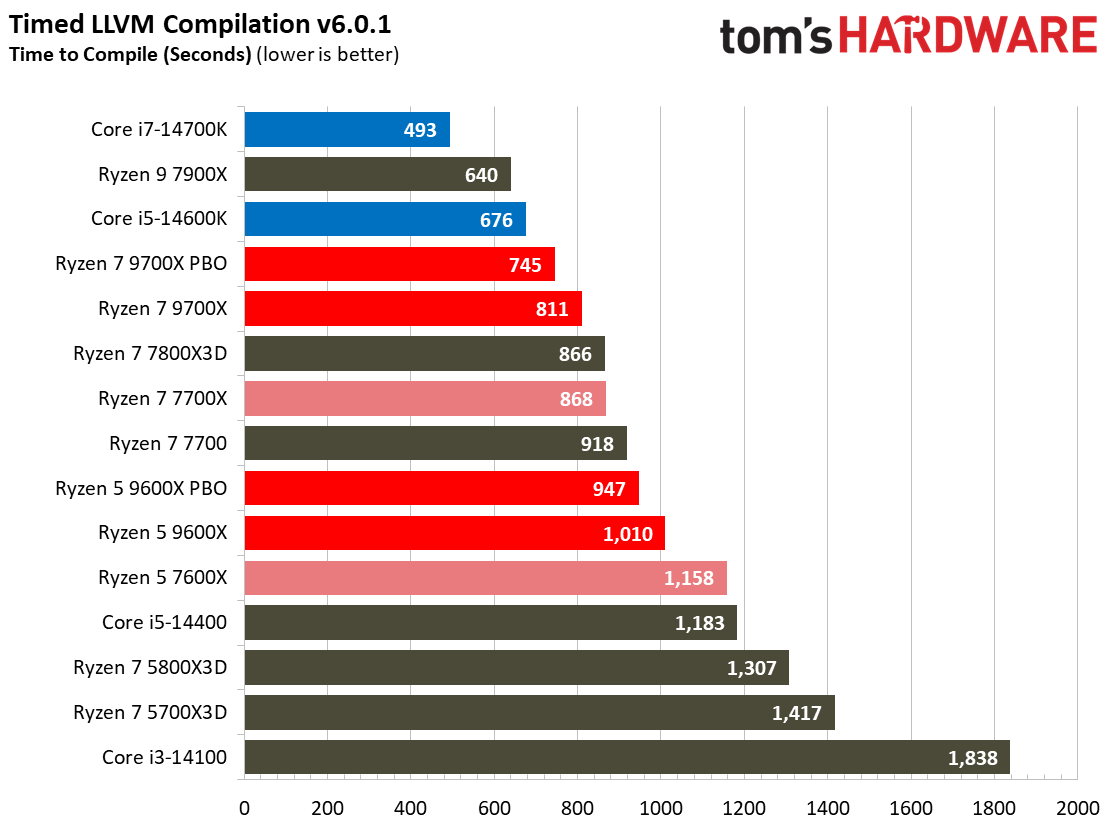
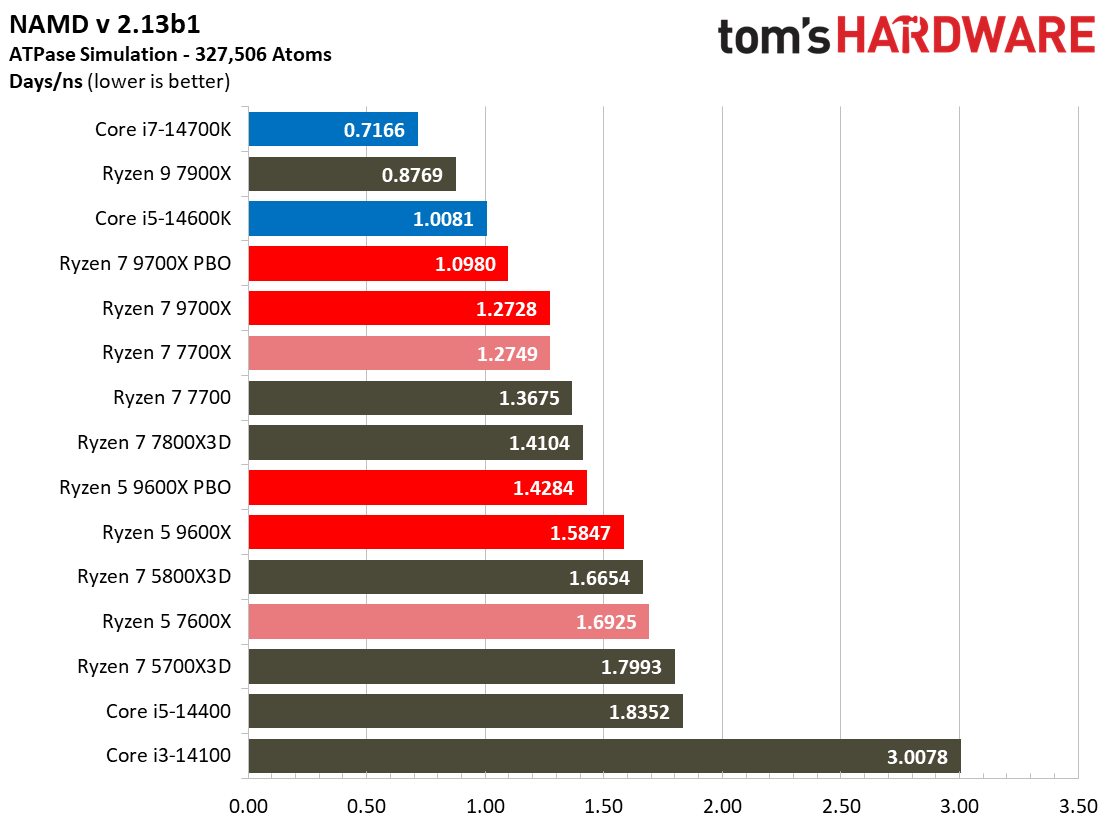
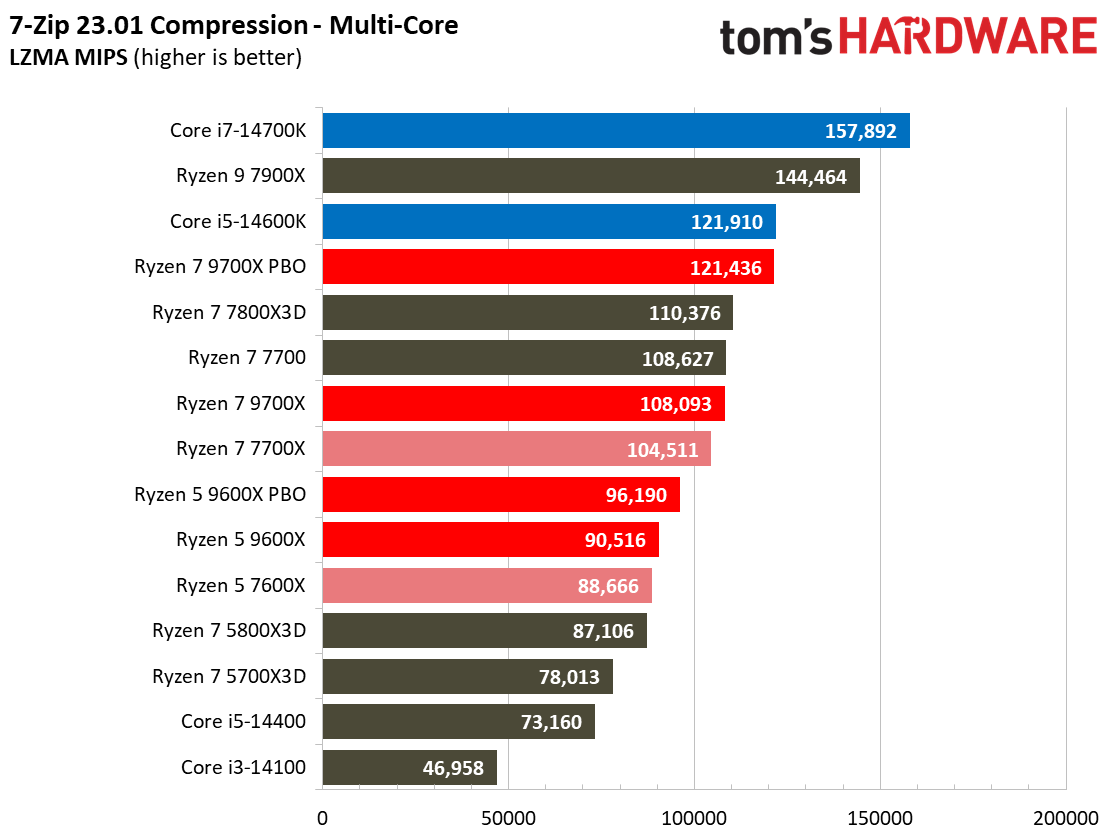
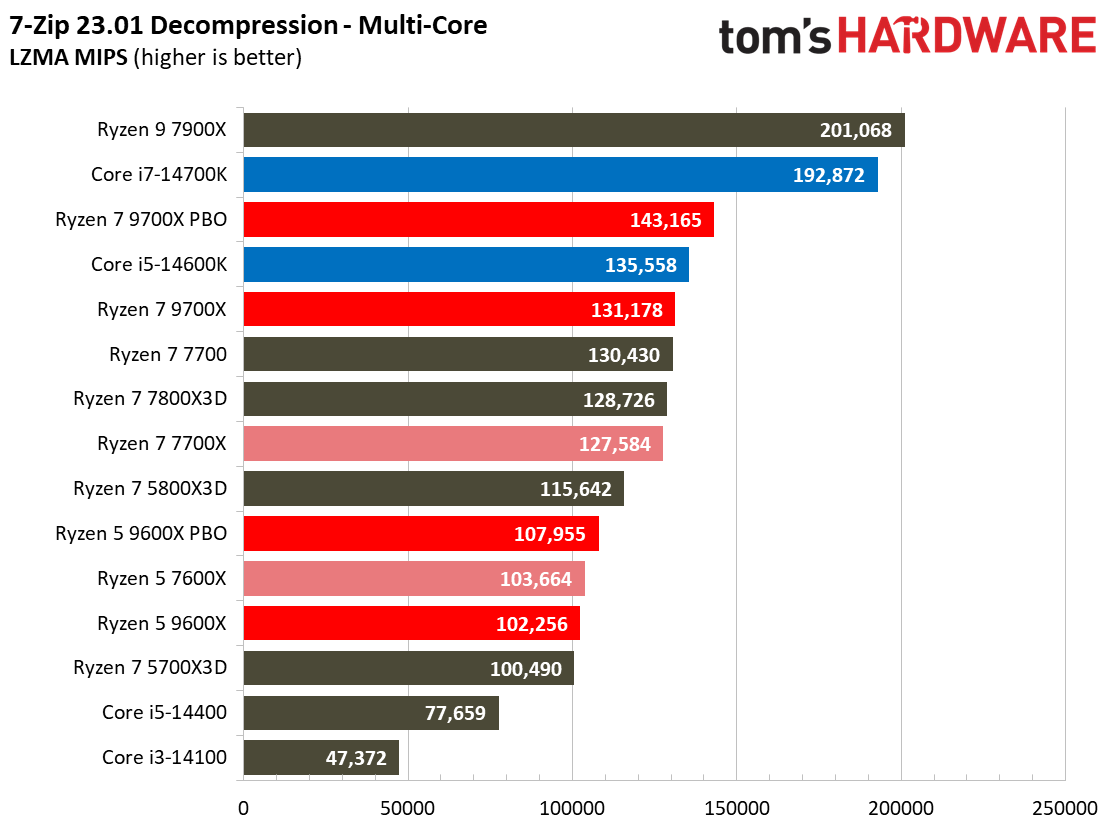
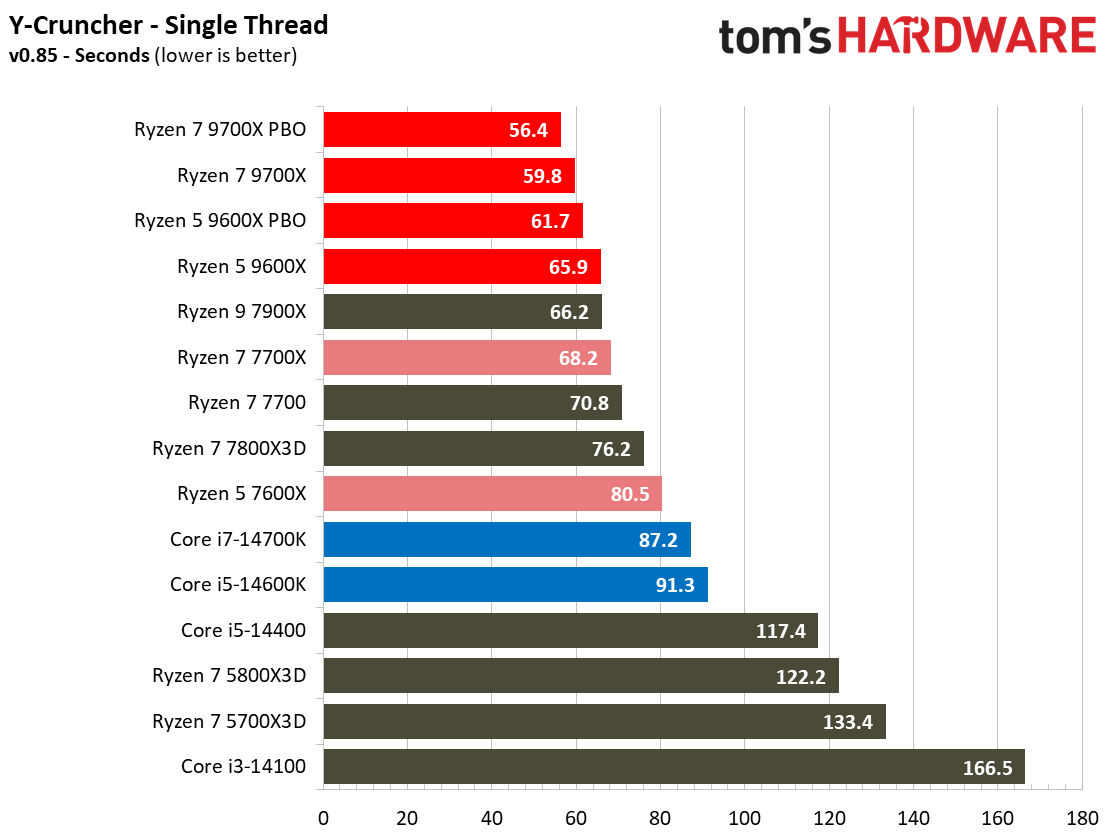
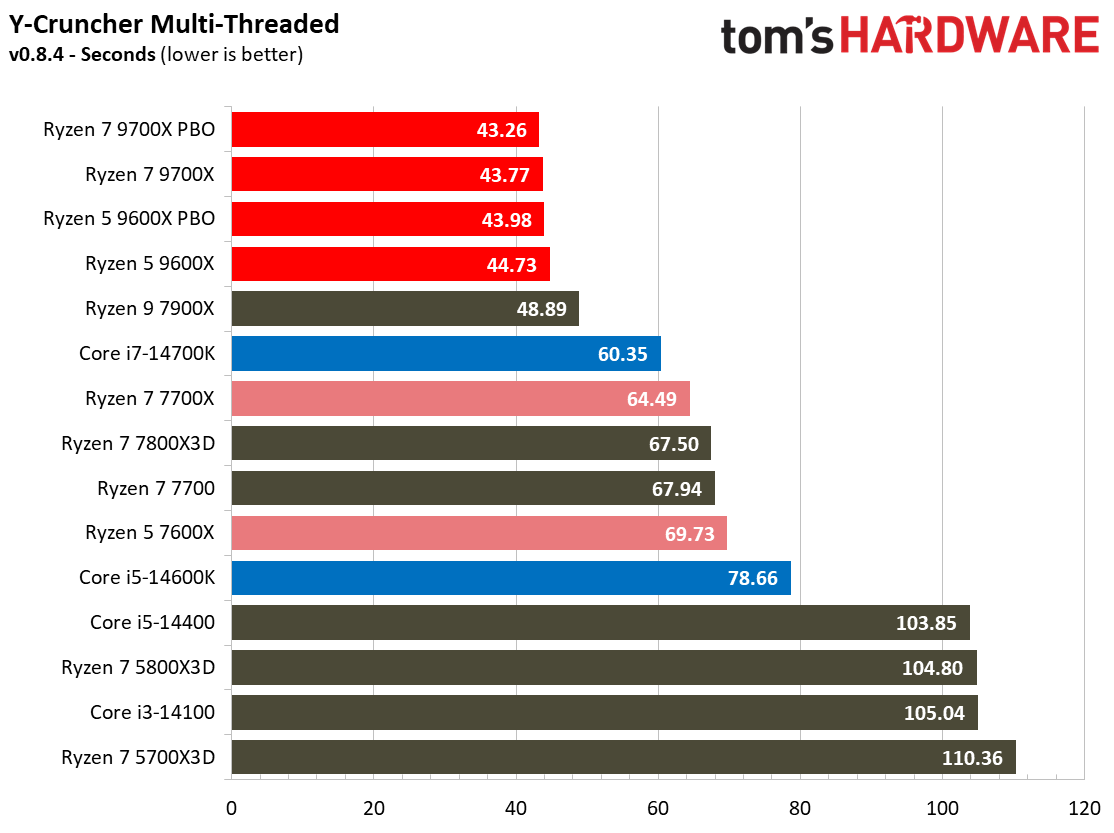
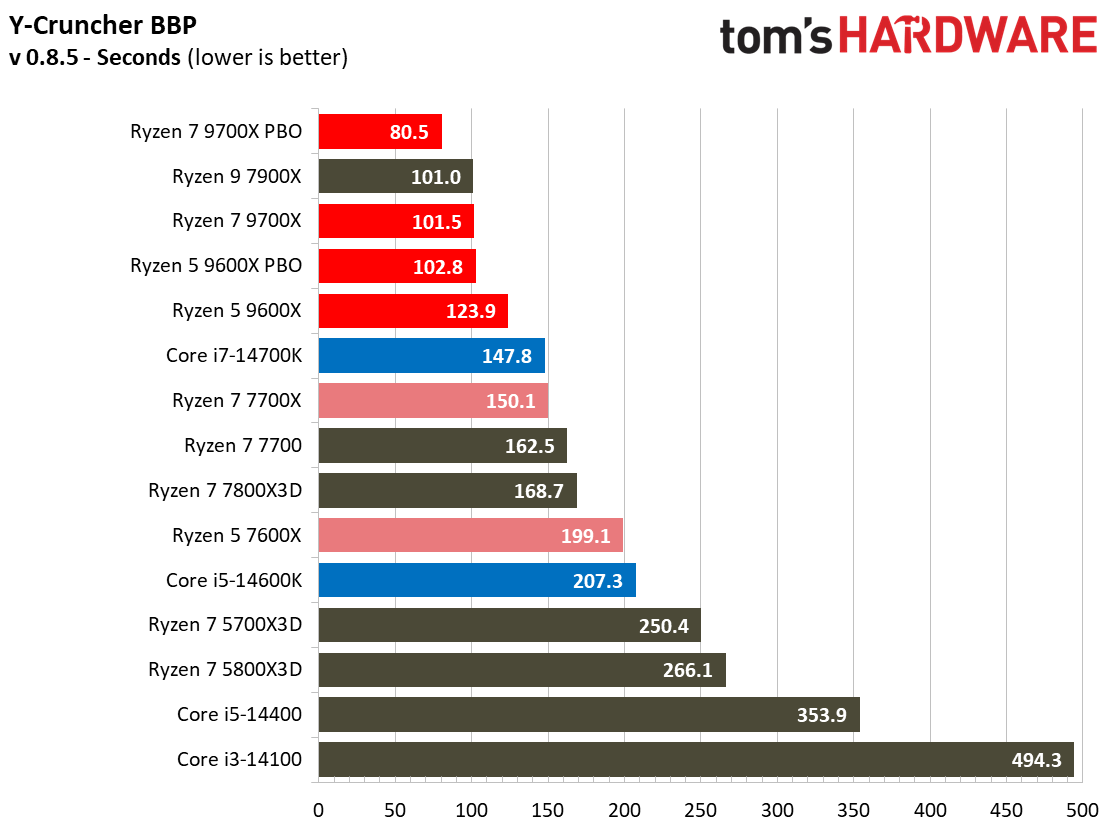
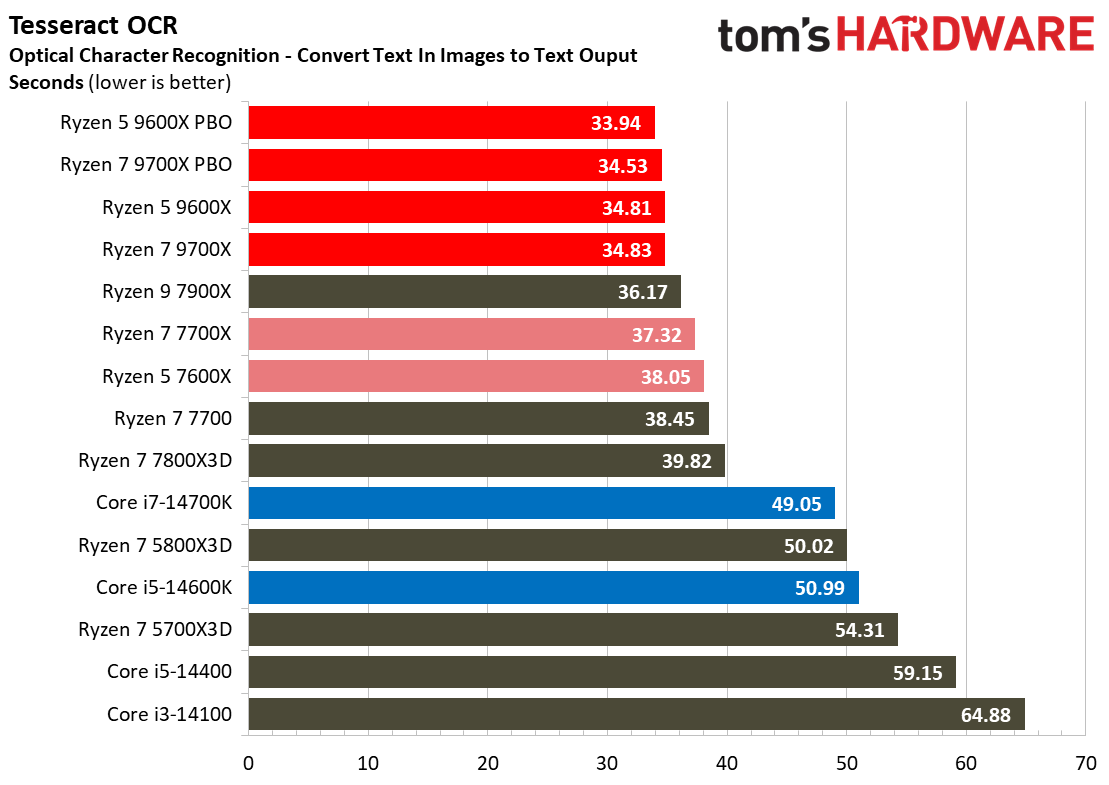
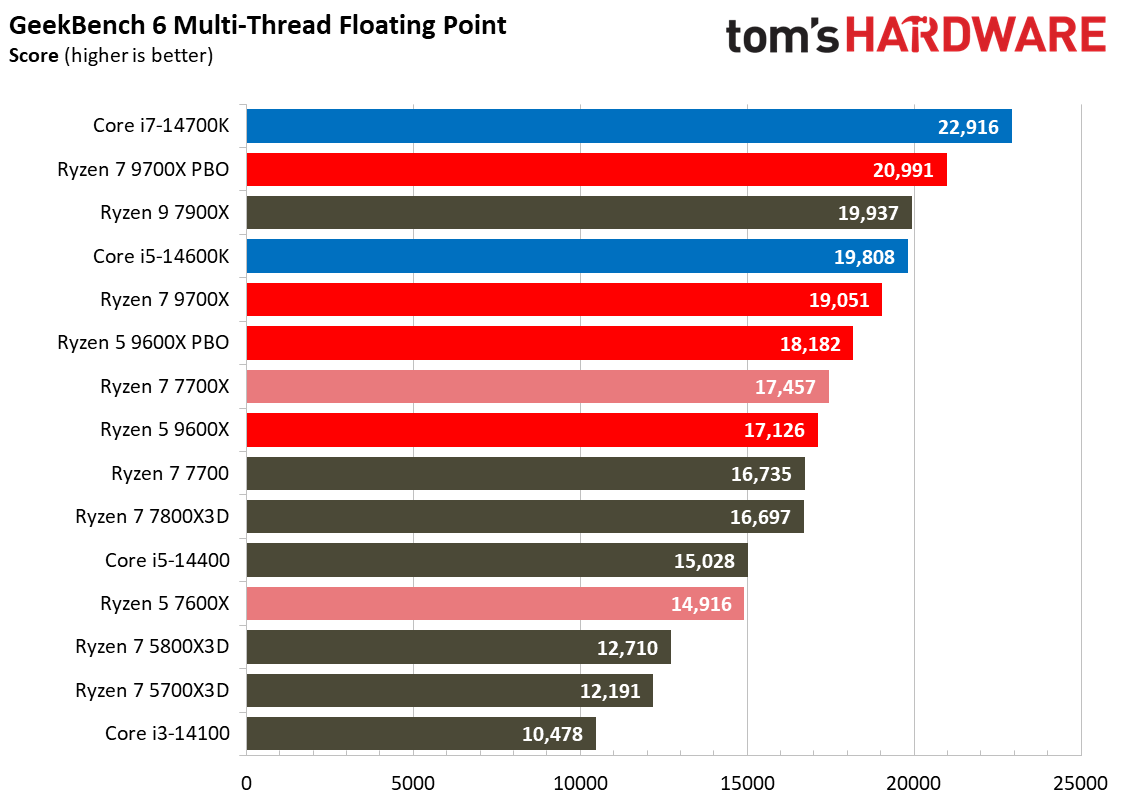
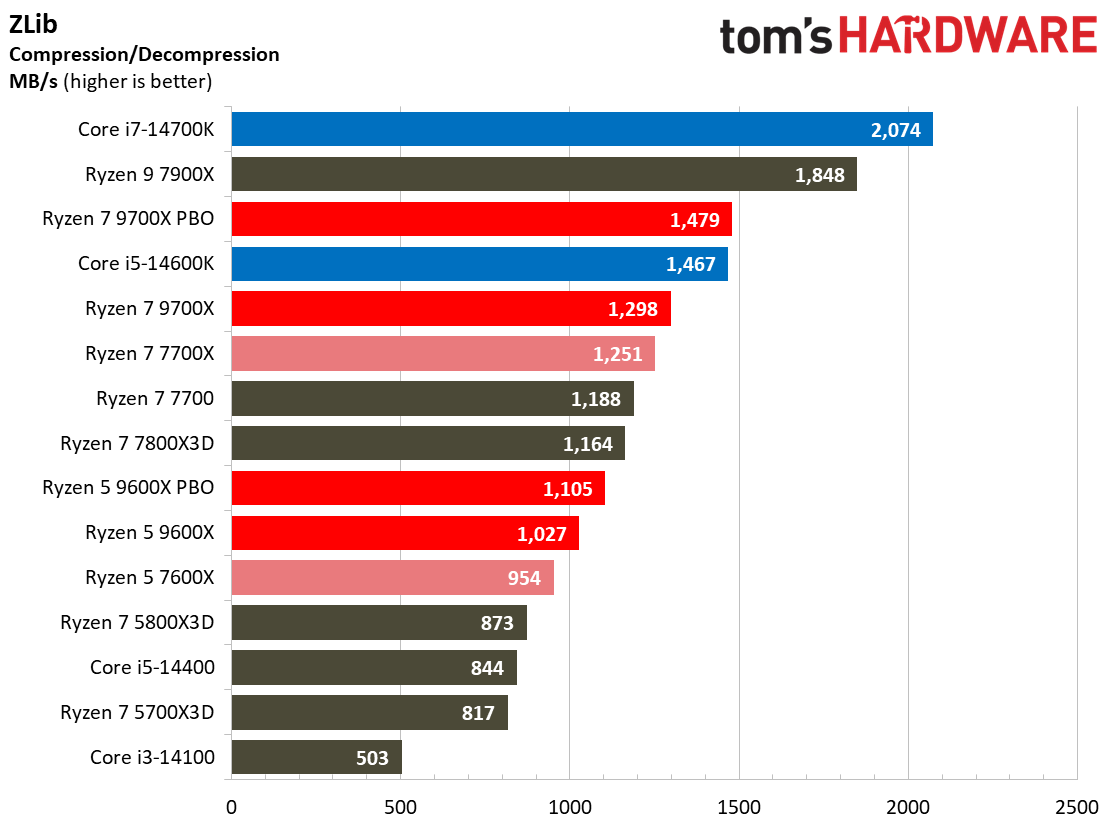
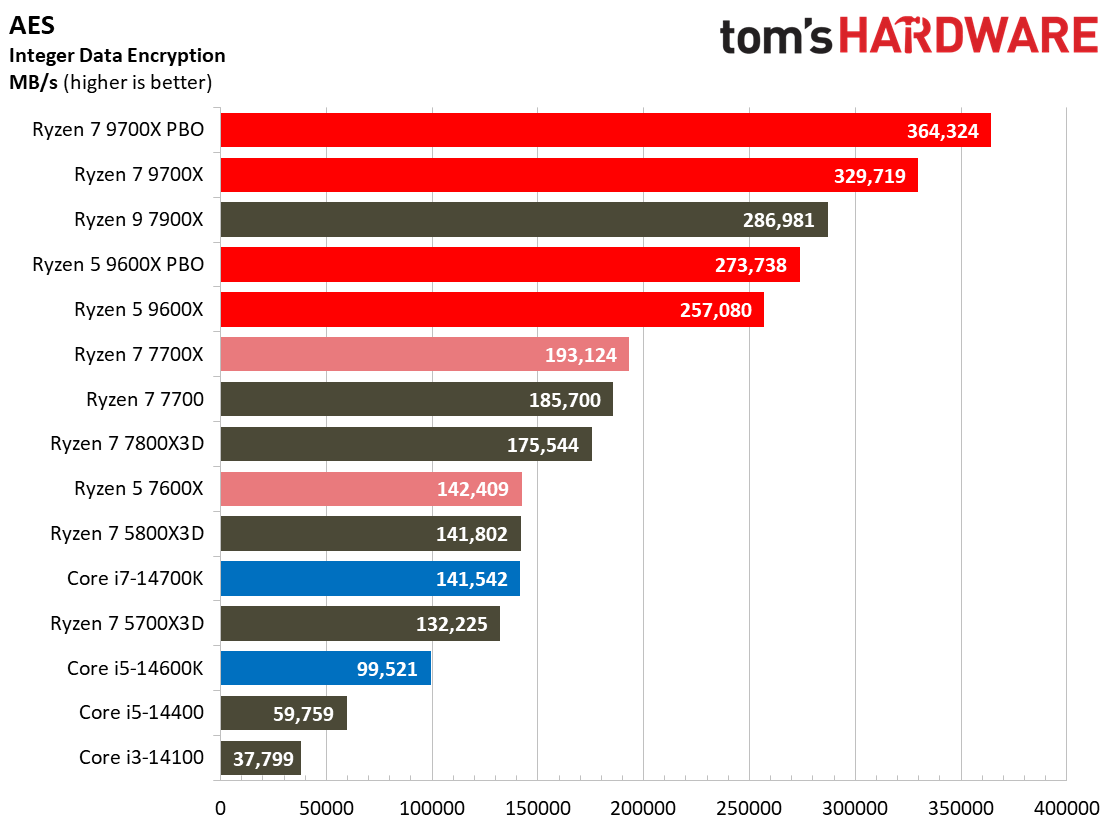
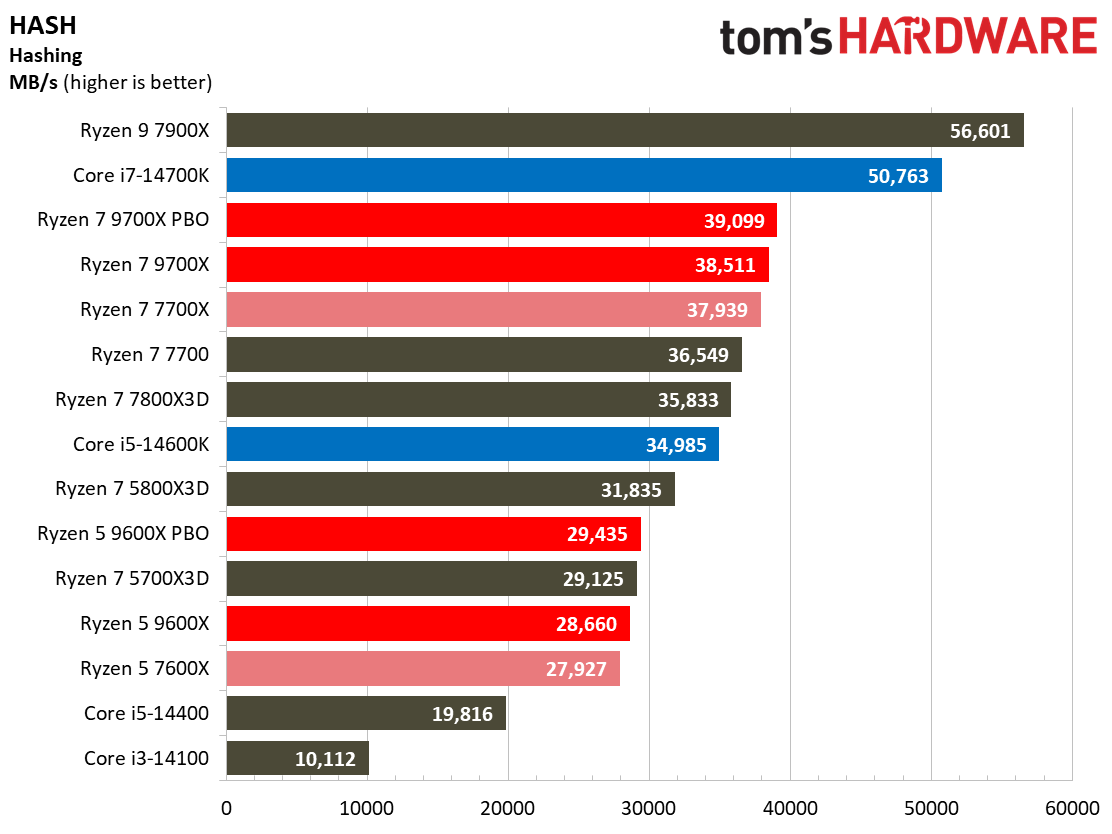
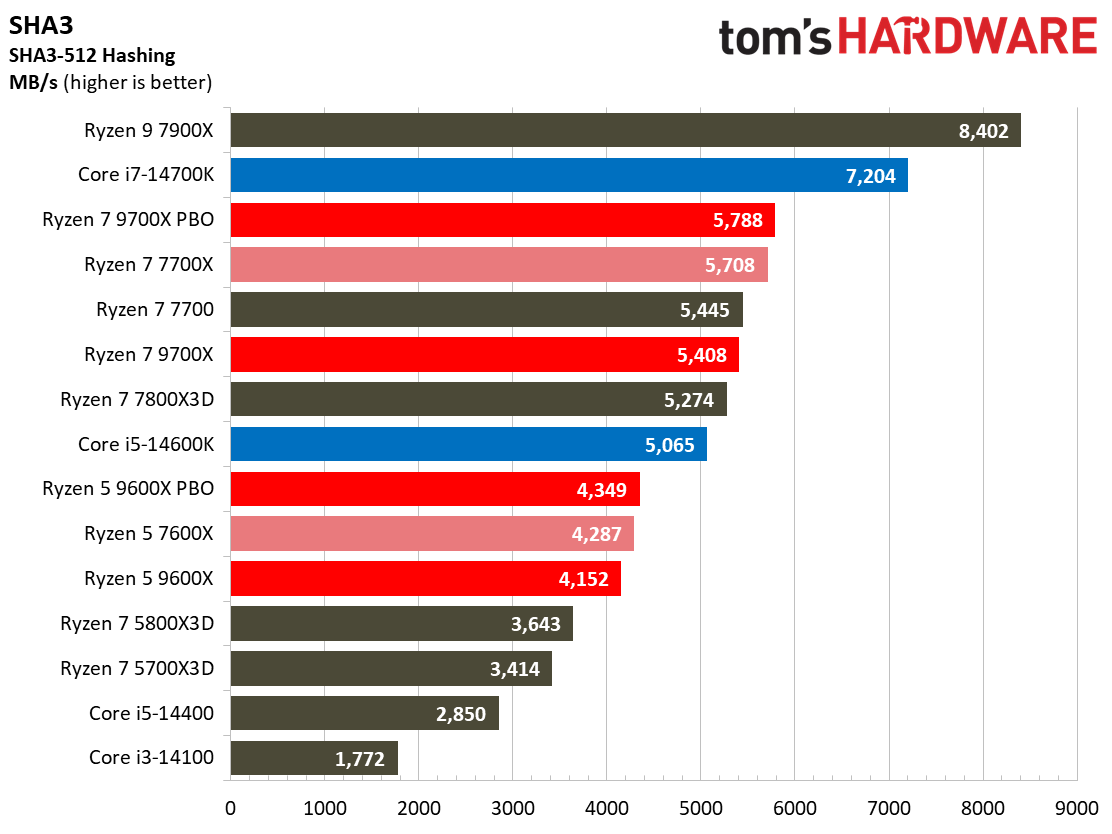
This selection of tests spans from massively parallel molecular dynamics simulation code in NAMD to compression/decompression performance. Y-cruncher computes Pi with the AVX instruction set, making for an incredibly demanding benchmark. Many of these tests aren't very relevant to the target audience for this class of chip, but we include them for completeness.
Intel leads in the NAMD and LLVM compilation benchmarks, but as we've seen when AMD has made significant alterations to its core microarchitecture in the past, software tuning could yield big gains for Ryzen 9000 in the future.
AMD dominates the y-cruncher benchmarks, and we've now added the Pi-BBP y-cruncher benchmark. This variant of the benchmark isn't as sensitive to memory throughput as the standard threaded benchmark, making it better suited for testing the execution cores.
- MORE: Best CPU for gaming
- MORE: CPU Benchmark Hierarchy
- MORE: Intel vs AMD
- MORE: How to Overclock a CPU
Get Tom's Hardware's best news and in-depth reviews, straight to your inbox.
Current page: AMD Ryzen 5 9600X Productivity Benchmarks
Prev Page AMD Ryzen 5 9600X Gaming Performance Next Page AMD Ryzen 5 9600X Power Consumption, Overclocking, Test Setup, Thermals
Paul Alcorn is the Editor-in-Chief for Tom's Hardware US. He also writes news and reviews on CPUs, storage, and enterprise hardware.
-
MergleBergle Nice review! Another site mentioned some power issues, where both the new cpus were idling at at 45-50W. Did you come across this problem yourself? I'm sure the issue will be dealt with relatively quickly, but as the other site mentioned, their test bench and config may have been part of the initial issue.Reply -
edzieba The gaming benchmarks appear to diverge wildly from the testing conducted by others (e.g. Eurogamer, Anandtech, Techpowerup) despite having very similar test rigs.Reply -
YSCCC Nice efficiency, but GN and Jay reported the pre release bios isn't stable, need to wait (if) the imporved bios release and for all round, better pay for the top tier ones in the Zen lineupReply -
Paul Alcorn Check out the page on power and thermals. The third album down has the power trace during different workloads. You can see the idle at the tail end. Sub-25W.Reply -
maestro0428 Hmm. I dont get the 4.5stars. A new architecture cannot beat a two gen old one in the 5800x3d consistently at gaming? Sure efficiency is better, but I don't really care about that unless it means a higher OC. Application performance is great, most of the time, except when its beat by the 14600k. I guess Ill wait and see how this shakes out in the next month or so. There is also a mistake in the article where you call the cpu 9700x3d, in the test system area.Reply -
gggplaya ReplyPaulAlcorn said:Check out the page on power and thermals. The third album down has the power trace during different workloads. You can see the idle at the tail end. Sub-25W.
I'd like to see you guys try a test with Star Citizen vs the 7800x3D and 7700x and the new 9800x. Star citizen is very math intensive with very heavy physics. It's a very cpu bottlenecked game because of it. I'm wondering if the new parallel floating point pipelines in the 9000 series will really help. -
Mattzun Very different from other reviews this morning that shows 3-5 percent gains and called 9700x meh or bad valueReply
Nice to see both base and PBO for all tests. -
jeremyj_83 The gaming performance and overall efficiency is quite nice. Will be interesting to see how the Ryzen 9's perform.Reply -
stuff and nonesense PBO turns it into a different beast, similar power consumption to the previous gen but much better all core frequencies, 4.4/4.5 GHz to approximately 5.3GHz. (The friendly German overclocker demonstrated this).Reply
PBO off it looks a little meh compared to the 7000 series. It will be a good upgrade from my 3900x. -
JarredWaltonGPU Reply
Note that the 4.5 stars is for the 9600X, while the 9700X only gets 3.5 stars. Paul will be putting together a standalone review of the 9700X as time permits (same data, some different text with a different overall score). The overall combination of gaming performance, price, and efficiency is what makes the 9600X an attractive option. It's not always faster than an i5-14600K, but it's using about half as much power.Mattzun said:Very different from other reviews this morning that shows 3-5 percent gains and called 9700x meh or bad value
Nice to see both base and PBO for all tests.
YSCCC said:Nice efficiency, but GN and Jay reported the pre release bios isn't stable, need to wait (if) the improved bios release and for all round, better pay for the top tier ones in the Zen lineup
There are definitely some teething pains with the initial BIOS releases to support these chips, from what I've seen. The specific boards used along with BIOS settings applied will certainly impact results, and initially there's going to be some tuning required and probably clean installing the AMD chipset drivers for each processor.
We can't say how others test, what settings, memory, etc. gets used, or other potential instability-causing aspects of reviewing. Brand-new hardware can be problematic, but I'd expect any serious problems to be ironed out shortly with updated firmware. Paul may have gotten 'lucky' with his chosen board, memory, and test settings (or simply been more pragmatic and careful about what 'stock' settings to run). Others have reported issues.
